1402
Multi-parametric MRI-based classification for generating muscle percentage index in muscular dystrophy1Texas A&M University, College Station, TX, United States, 2Texas A&M University at Qatar, Doha, Qatar
Synopsis
Imaging biomarker for muscular dystrophies, such as muscle percentage index (MPI), successfully differentiates between healthy and dystrophic muscles. However, the current methods to generate this biomarker are not well defined and therefore lack robustness and reproducibility. This study imaged ten Golden Retriever Muscular Dystrophy (GRMD) pectineus-muscle samples at a 4.7T MRI scanner. To facilitate estimation of MPI and to validate the results, we use trichrome-stained histology images. These images were registered accurately
Introduction
Imaging biomarker for muscular dystrophies, such as muscle percentage index (MPI), successfully differentiates between healthy and dystrophic muscles1. However, the current methods to generate this biomarker are not well defined and therefore lack robustness. This study focuses on assessing a classification approach to generate MPI. Specifically, the aim of this study is to develop and validate an automated method to generate MPI by classifying multi-parametric quantitative MRI (qMRI) into muscle and non-muscle areas. The qMRI of Golden Retriever Muscular Dystrophy (GRMD) pectineus-muscle samples include T1-map, T2-map, Water fraction, Fat fraction, FA, ADC, MD, and TrD.Methods
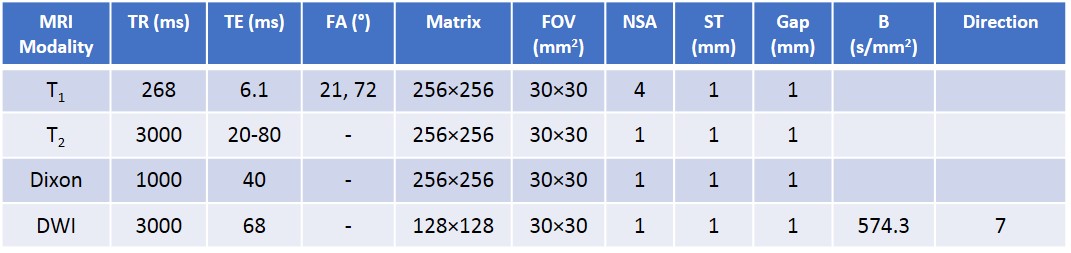
One healthy adult and nine differently aged GRMD muscle samples were imaged with a 4.7T horizontal (40 cm) bore Varian Bruker MRI scanner and an in-house developed 10 cm birdcage coil. The imaging sequences (detailed in Table 1) include T1-weighted (T1-w), T2-weighted (T2-w), T1-map, T2-map, Dixon and DWI. T1-maps were estimated using Despot1 approach with two flip angles2. Two Dixon maps, water and fat3, were converted into two fat fractions: i.e., fat volume fraction and fat mass fraction4. DTI parameters were calculated using Camino diffusion toolkit with weighted least squares regression5. After MRI acquisition, the whole pectineus muscles were histologically processed. One histology section was obtained for all muscles (middle of the muscle block) at a thickness of 5µm, stained by a trichrome stain, and finally scanned to produce histology image. To co-register histology images with 3D qMRI, we employed a 3-step (slice-to-volume) registration framework consisting of interactive alignment, 2D-3D affine registration, and 2D-2D elastic refinement6. Image content from histology image and T1-w MRI were used during the registration procedure. The slice-to-volume registration accuracy was quantitatively evaluated after each step by using anatomical landmarks. Subsequently, all qMRI maps were co-registered with T1-w MRI images. To facilitate classification process, the pixels in histology images were automatically labeled as muscle or non-muscle tissues7. This dataset was unbalanced with the ratio of positive to negative instances ranging from 3:1 (adult GRMD) to 27:1 (young GRMD). For each physical sample, we matched the size of the negative class, by randomly under-sampling positive class pixels, to prevent overfitting towards majority class. For this balance dataset (training:test = 14594:9696 pixels), we used a hold-out approach (40%) to test the models. A soft margin binary SVM classifier was trained with repeated 10-fold cross-validation. The parameters that provided the highest training accuracy were used to build the final SVM model. The accuracy of the final model was assessed by a 40% hold-out test set. We performed two different classification experiments to train and validate the automated segmentation:
- Experiment I: Local gradient information, captured by the histogram of oriented gradients (HOG), was used to calculate features for all qMRI maps8,9. This resulted in 36 HOG features for each qMRI map, expanding to a feature vector (length 288) for each spatial pixel.
- Experiment II: Local texture information for all qMRI maps was separately assessed by local binary pattern10, gray-level co-occurrence matrix11, and gray-level run-length matrix12. This resulted in 21 texture features for each qMRI map, expanding to a feature vector (length 168) for each spatial pixel.
Results
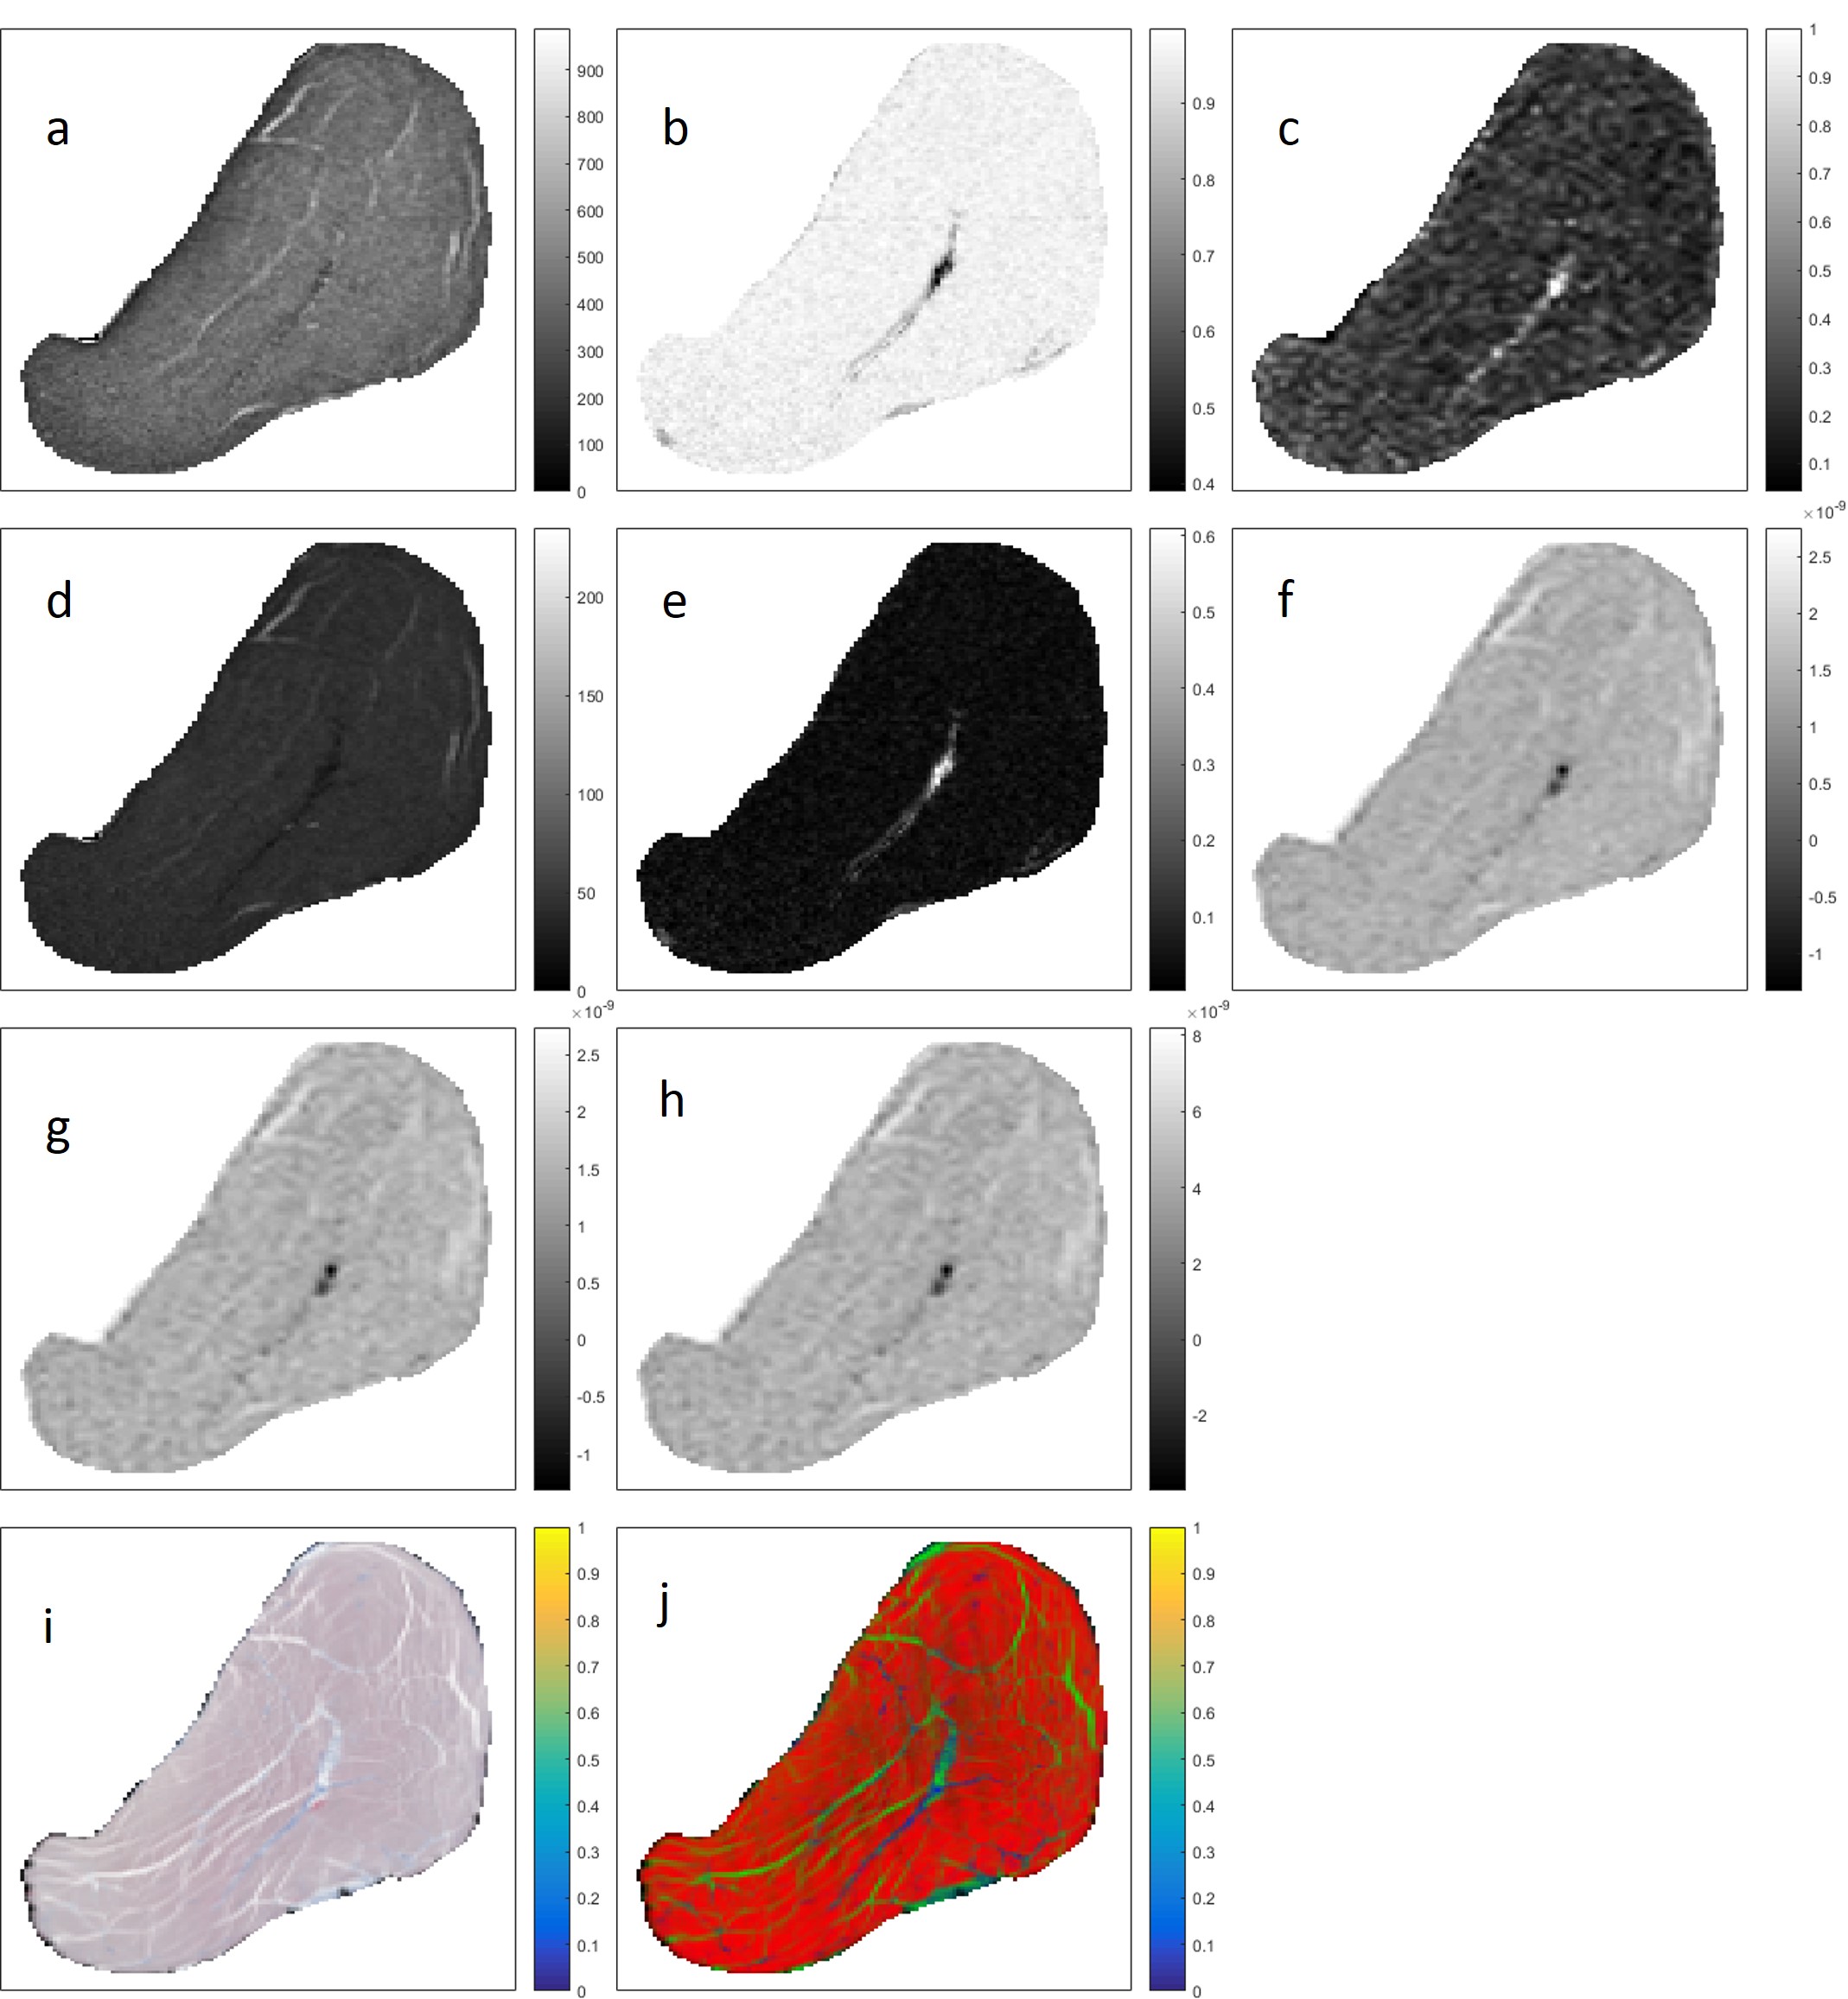
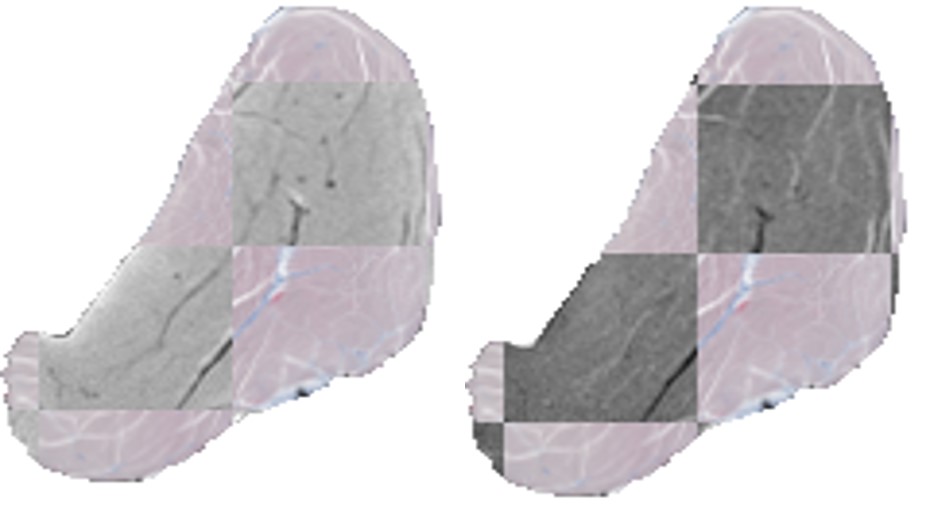
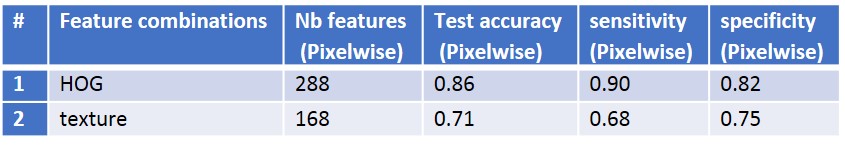
Averaged over 10 samples, the RMS error for the registration was 0.16 ± 0.03 mm. Figure 1 shows all qMRI maps, corresponding histology images, and histology segmentations for a one-year-old subject after registration. Figure 2 illustrates the registration accuracy using a checkerboard image constructed from registered histology and both T1-w and T2-w MRI images. Table 2 reports the classification statistics (i.e., accuracy, sensitivity, specificity) for both classification experiments.Discussion and Conclusion
Both classification experiments (local texture information and local gradient information) showed promising results for segmenting MPI in the GRMD ex vivo studies. The classification accuracies were 0.71 (using texture features) and 0.85 (using HOG features). The quantitative results show the potential of the proposed classification method to automatically generate MPI for an objective and reproducible assessment of individual muscle composition. Future research will extend it to in vivo clinical studies for evaluation of the classification based MPI as a robust and accurate non-invasive imaging biomarker for muscular dystrophy studies with respect to natural history and clinical trials.Acknowledgements
We acknowledge partial funding supports: National Science Foundation (1606136), Natural Science Foundation China (81729003), Natural Science Foundation of Shenzhen (GHHZ20150316143320494), Qatar National Research Fund (NPRP6-241-2-102, NPRP8-1606-3-322 and NPRP8-293-2-124), A. Eresen was partially supported by the Ministry of National Education of the Republic of Turkey.References
1.Godi C, Ambrosi A, Nicastro F, et al. Longitudinal MRI quantification of muscle degeneration in Duchenne muscular dystrophy. Annals of Clinical and Translational Neurology. 2016; 3(8):607-622.
2.Deoni SCL, Rutt BK, Peters TM. Rapid combined T1 and T2 mapping using gradient recalled acquisition in the steady state. Magnetic Resonance in Medicine. 2003; 49:515-26.
3.Glover GH, Schneider E. Three-point dixon technique for true water/fat decomposition with B0 inhomogeneity correction. Magnetic Resonance in Medicine. 1991; 18:371-83.
4.Reeder SB, Hines CD, Yu H, et al. On The Definition of Fat-Fraction for In Vivo Fat Quantification with Magnetic Resonance Imaging. Proceedings of International Society for Magnetic Resonance in Medicine; 2009.
5.P. A. Cook YB, S. Nedjati-Gilani, K. K. Seunarine, et al. Camino: Open-Source Diffusion-MRI Reconstruction and Processing. 14th Scientific Meeting of the International Society for Magnetic Resonance in Medicine; May 2006.
6.Eresen A, McConnell S, Birch S, et al. Correlating MRI and Histological Parameters in GRMD Muscles. A Comparison Between 3T and 4.7T Acquisitions. Proceedings of International Society for Magnetic Resonance in Medicine; 2017.
7.McConnel S. Automatic Canine Muscle Histology Image Segmentation Based on RGB Histogram. Master’s Thesis, Texas A&M University, College Station, TX, 2016.
8.McConnell RK. Method of and apparatus for pattern recognition. Google Patents, 1986.
9.Freeman WT, Roth M. Orientation Histograms for Hand Gesture Recognition. Technical Report TR94-03, Mitsubishi Electric Research Laboratories, 1994.
10.Ojala T, Pietikainen M, Maenpaa T. Multiresolution gray-scale and rotation invariant texture classification with local binary patterns. IEEE Transactions on Pattern Analysis and Machine Intelligence, 2002. 24(7); 971-987.
11.Haralick RM, Shanmugam K, Dinstein IH. Textural features for image classification. IEEE Transactions on Systems, Man, and Cybernetics. SMC-3(6); 610-621, 1973.
12.Galloway MM. Texture analysis using gray level run lengths. Computer Graphics and Image Processing. 4(2); 172-179, 1975.
Figures