1400
Using texture analysis based on T2WI, DWI and delayed T1-enhanced imaging to differentiate benign and malignant soft tissue tumors1Dept. of MRI, The First Affiliated Hospital of Zhengzhou University, Zhengzhou, China, 2Philips Healthcare, Beijing, China
Synopsis
With the popularity of magnetic resonance technology in recent years, the detection rate of soft tissue tumors has been greatly improved. The soft tissue tumors in MR images show various signal intensity distribution in different modalities. This work investigated and evaluated the role of texture analysis on T2WI, DWI and delayed T1-enhanced images to characterize the soft tissue tumors, and then evaluate the textures by support vector machine classifiers (SVM) to differentiate benign and malignant soft tissue tumors. Results showed that the application of texture analysis in T2WI, DWI and T1-enhanced imaging is helpful to distinguish benign and malignant soft tissue tumors by SVM.
Purpose
With the development of MR techniques and diagnostic level, common sequences( T2WI, DWI and delayed T1-enhanced imaging) can help us to make accurate location of soft tissue tumor, but the various signal intensity characteristics of the soft tissue tumor always make the diagnosis more difficult. This work aimed to analyze conventional magnetic resonance images of benign and malignant soft tissue tumors by texture analysis method1-2, and evaluate the ability of texture characteristics by support vector machine (SVM) to diagnose benign and malignant soft tissue tumors.Methods
Forty-five patients(26 males and 19 females aged 41.1±18.5 years old) with soft tissue tumors(all have been diagnosed as soft tissue tumor according to pathological biopsy) were included in this study. Base on the WHO Classification of Tumors of Soft Tissue and Bone(2013) criteria. All patients were divided into two groups: 22 for benign tumors and 23 for malignant tumors. All patients were scanned by MR T2WI, DWI and delayed T1-enhanced imaging sequence based on a 3T MR scanner (Ingenia, Philips Healthcare, Best, the Netherlands). Three dimensions texture extraction was carried out based on a modified radiomics-master Matlab toolbox for eachT2WI, T1WI-enhanced, B0, B800 and ADC map respectively. Finally 43×5 textures were acquired. Firstly, two sample student’s T test was performed to find the difference of each texture between tumor groups. And then SVM with the textures reordered by fisher score was performed to identify the malignant from the benign soft tissue tumors.Results:
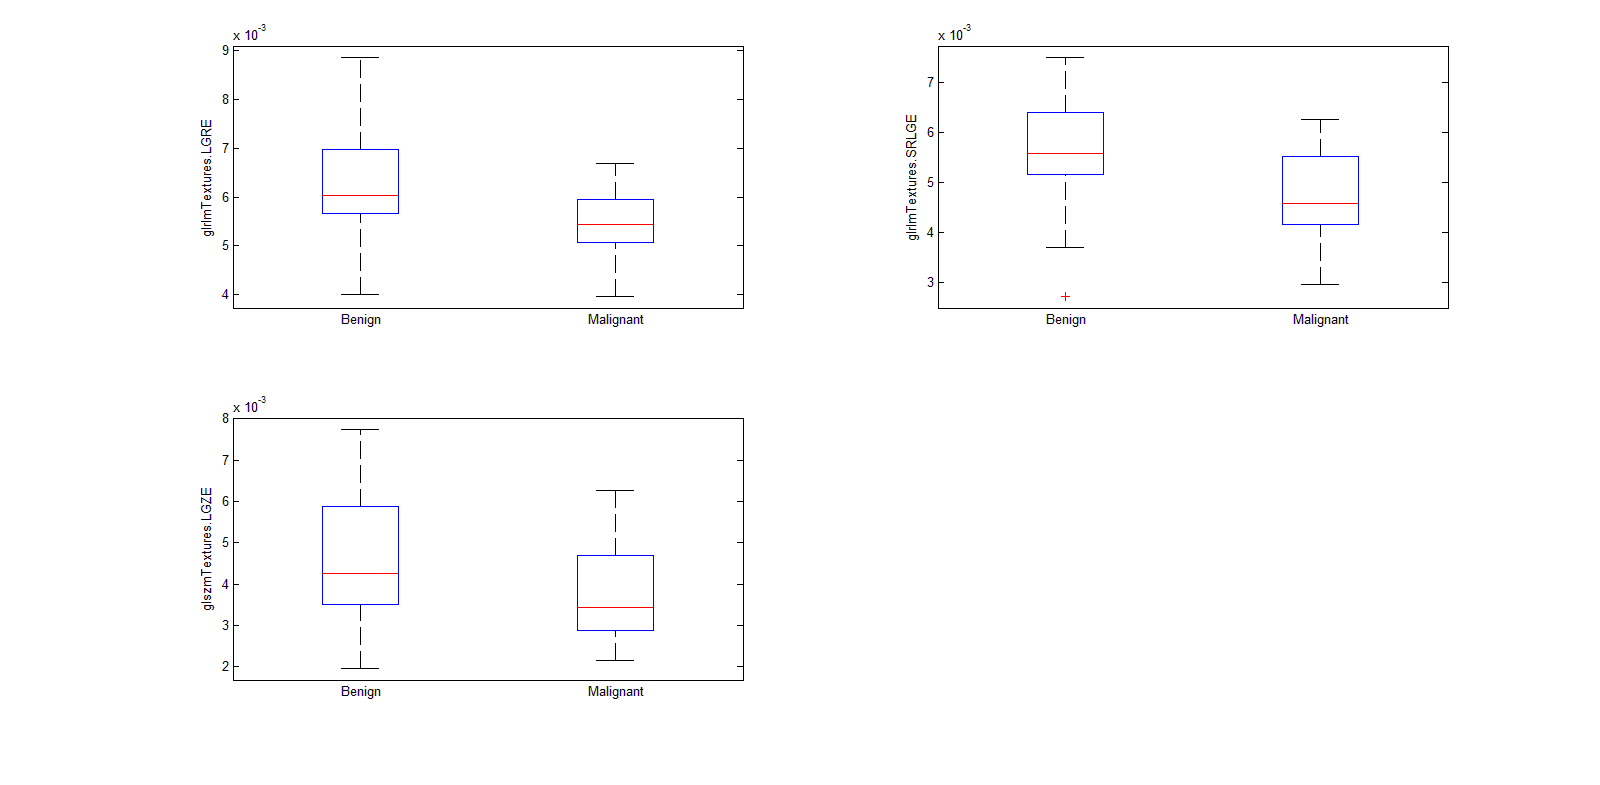
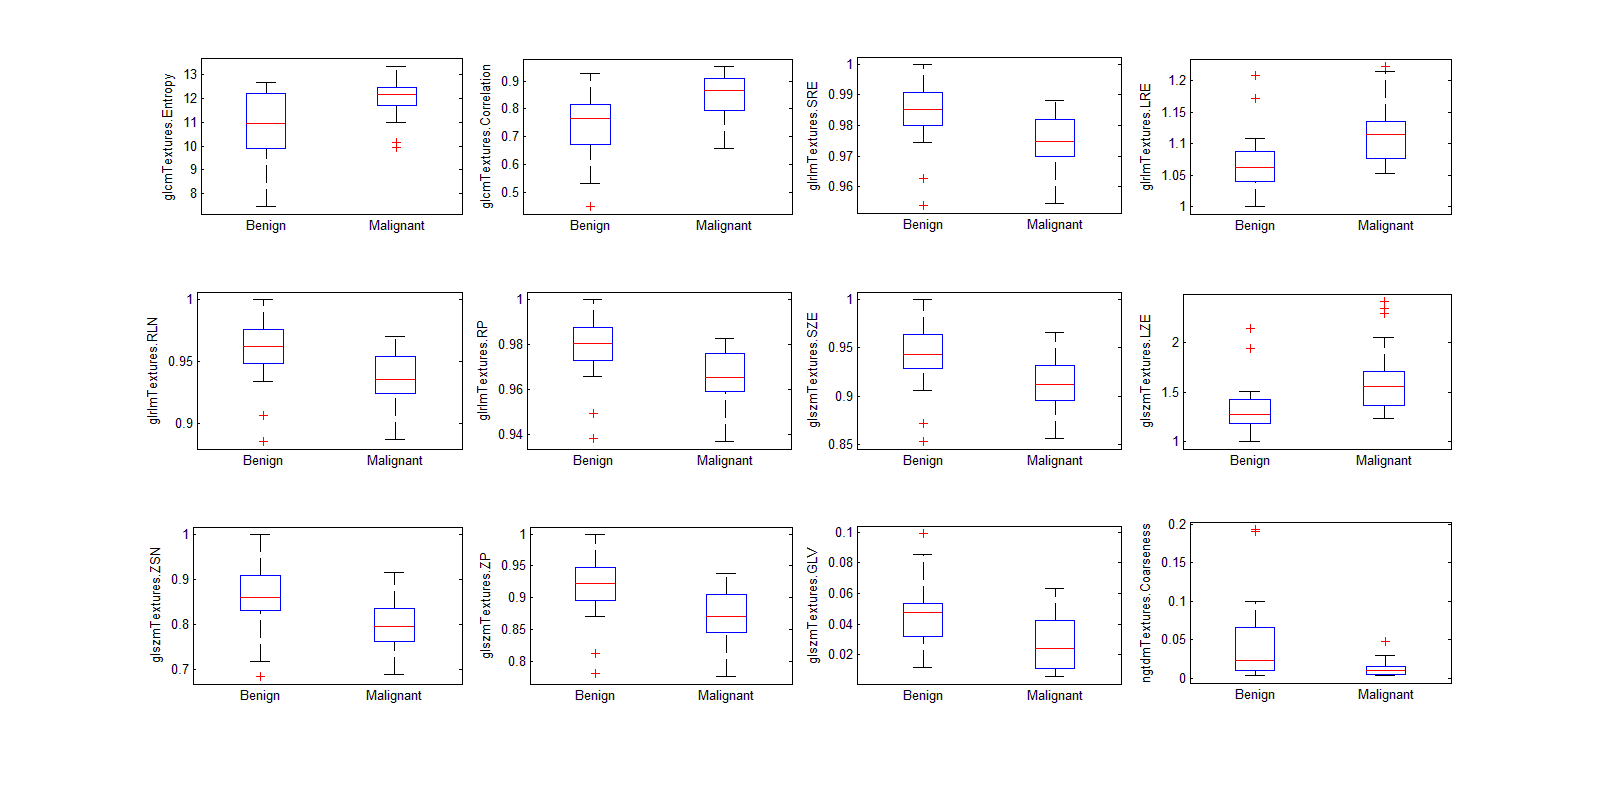
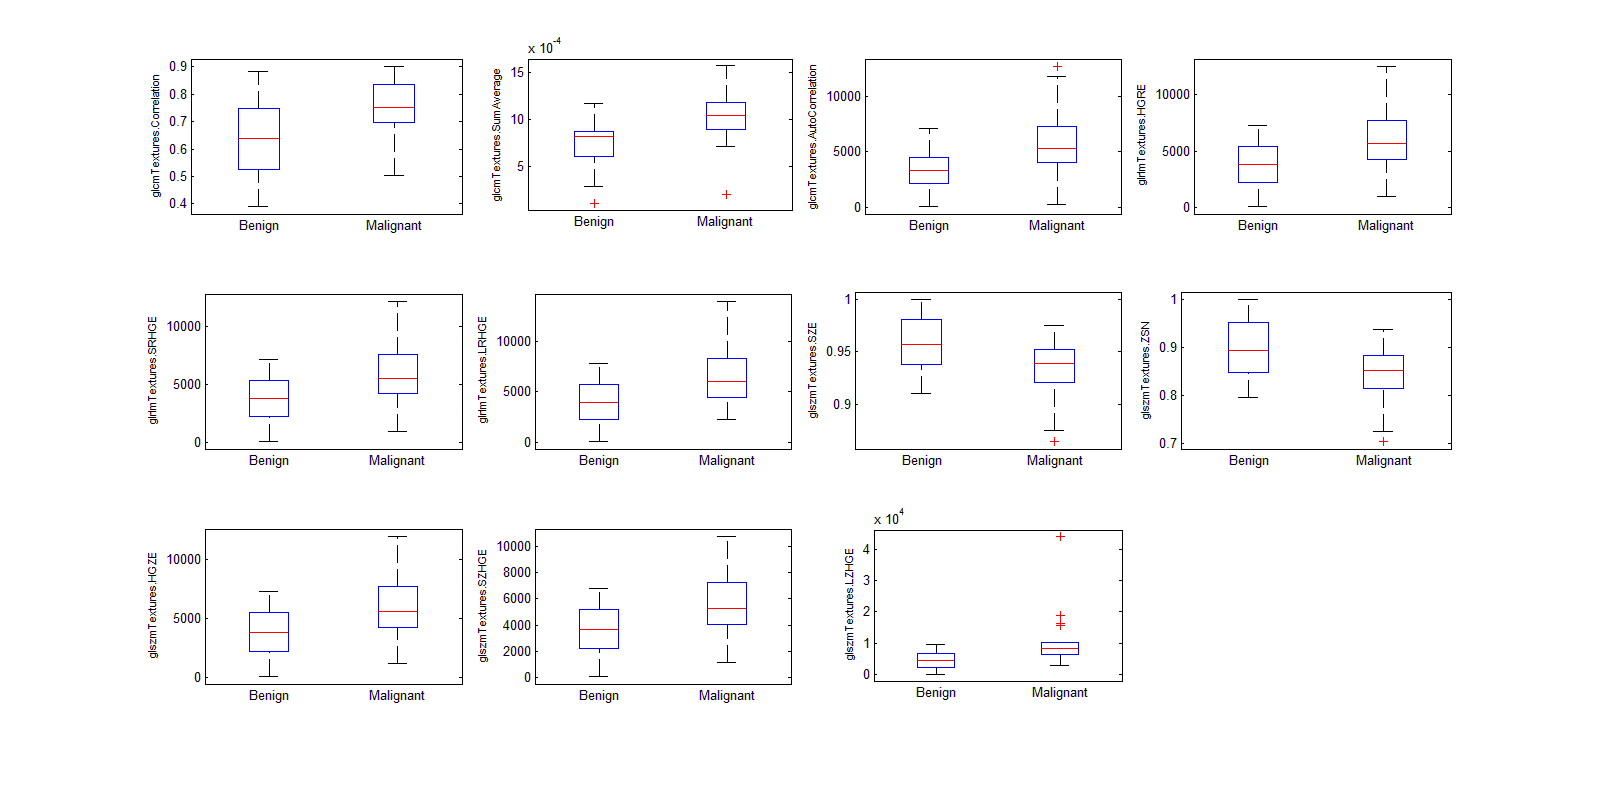
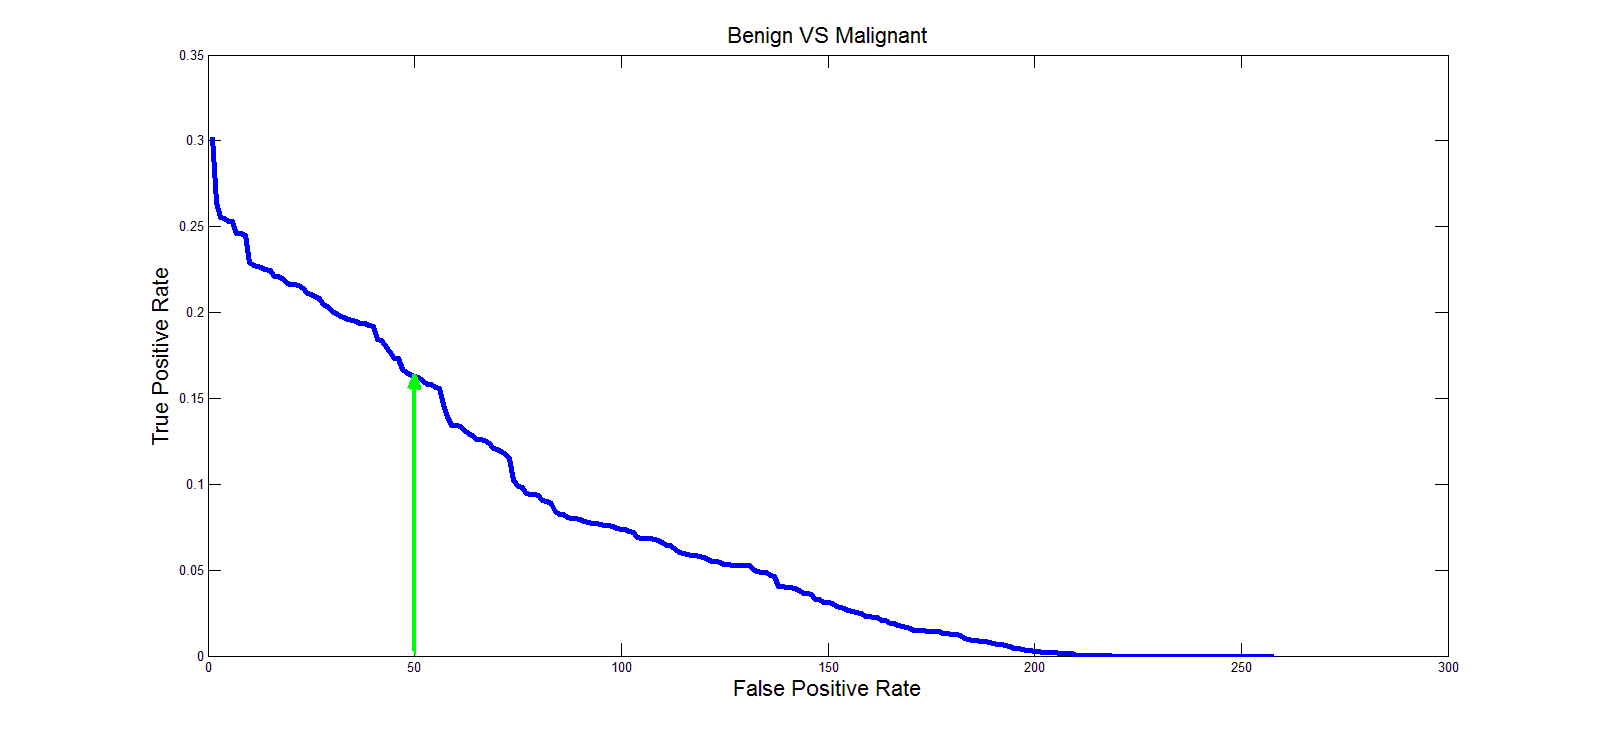
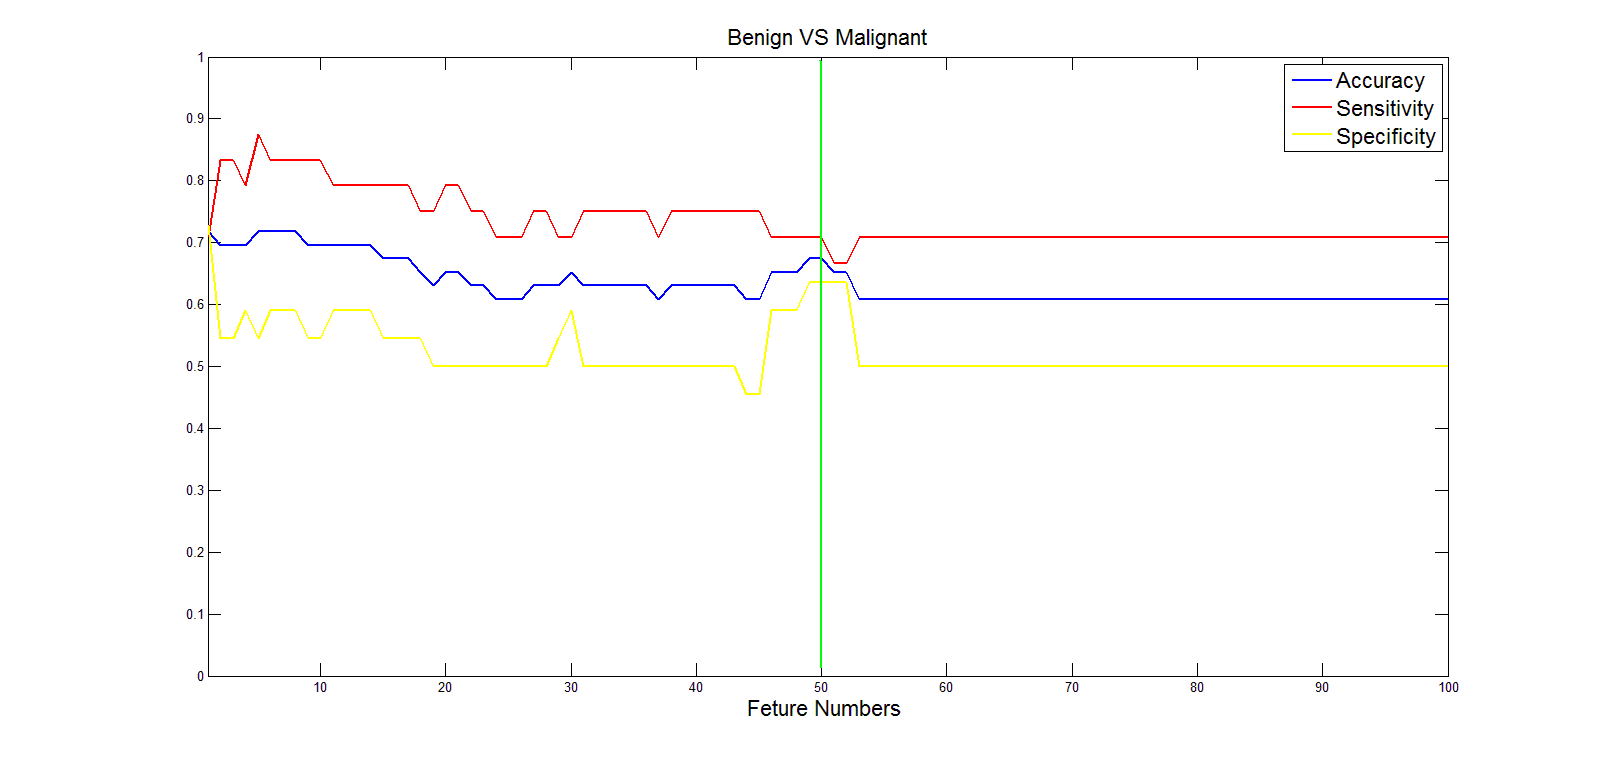
Texture parameters of ADC, delayed T1-enhanced and T2WI images of benign and malignant soft tissue tumor are shown in Figure 1-3 (Only a small portion of the parameters showed significant difference). Accuracy, sensitivity and specificity of SVM classification was shown in Figure 5.Discussion:
The T2WI, DWI and delayed T1-enhanced imaging are conventional imaging techniques for soft tissue tumors. T2WI provide the basic information of the tumor. The information of the water molecular diffusion in the tumor can be reflected in DWI. The delayed T1-enhanced imaging showed the more accurate characteristics of the tumor’s location, size andvascularity. Texture analysis is a method to collect the informations from the intensity distribution in tumor lesions1. And the application of SVM classification help us to distinguish benign and malignant tumor based on some specific texture parameters3. Our study results show the feasibility of using texture analysis in T2WI, DWI and delayed T1-enhanced imaging to differentiate benign from malignant soft tissue tumors. And this work shown high accuracy of SVM classification in the differentiation of benign and malignant soft tissue tumors.Conclusions:
Texture analysis in T2WI, DWI and delayed T1-enhanced images might be a potential method to distinguish the benign and malignant soft tissue tumors.Acknowledgements
No acknowledgement found.References
[1] Brown A M, Nagala S, Mclean M A, et al. Multi‐institutional validation of a novel textural analysis tool for preoperative stratification of suspected thyroid tumors on diffusion‐weighted MRI[J]. Magnetic Resonance in Medicine, 2016, 75(4):1708.
[2] Moraru L, Moldovanu S, Culeaflorescu A L, et al. Texture analysis of parasitological liver fibrosis images.[J]. Microscopy Research & Technique, 2017, 80(8):862-869.
[3] Larroza A, Moratal D, Paredes‐Sánchez A, et al. Support vector machine classification of brain metastasis and radiation necrosis based on texture analysis in MRI[J]. Journal of Magnetic Resonance Imaging, 2015, 42(5):1362-1368.
Figures