1399
Robust multi-atlas MRI segmentation with corrective learning for quantification of local quadriceps muscles inflammation changes during a longitudinal study in athletes1Univ Lyon, UJM-Saint-Etienne, INSA-Lyon, Université Claude Bernard Lyon 1, CNRS, Inserm, CREATIS UMR 5220, U1206, F-42023, Saint-Etienne, France, 2Department of Radiology, Centre Hospitalier Universitaire de Saint-Etienne, Université Jean-Monnet, Saint-Etienne, France, 3Univ Lyon, INSA‐Lyon, Université Claude Bernard Lyon 1, UJM-Saint Etienne, CNRS, Inserm, CREATIS UMR 5220, U1206, F-69621, Villeurbanne, France
Synopsis
This study propose an improved automatic segmentation of longitudinal MRI dataset of mountain ultra-marathon runners’ upper thighs acquired during the Tor des Géants 2014 by using a multi-atlas segmentation strategy with corrective learning with a small number of training set. Our highly accurate and robust segmentations allow us to locally study the inflammation of each quadriceps head induced by the extreme conditions of the race, a method that is of high interest to monitor the impact of eccentric efforts during the race, identify local physiopathology changes in patients, and benefits of eventual therapy or intervention.
INTRODUCTION
Accurate quadriceps muscles segmentation remains challenging in particular when performing longitudinal studies due to several factors including the lack of clear muscle heads boundaries. This becomes particularly critical in subjects with extremely low amount of body and intra-muscle fat while having well developed muscle heads such as with ultra-endurance athletes. A robust segmentation is expected when studying local changes in quadriceps muscles since manual segmentation is very time-consuming and mentally exhausting while observed variations in images are often very subtle. We propose a refined automatic segmentation pipeline combining a multi-atlas strategy and corrective learning to improve segmentation accuracy for subsequent data analysis.METHODS
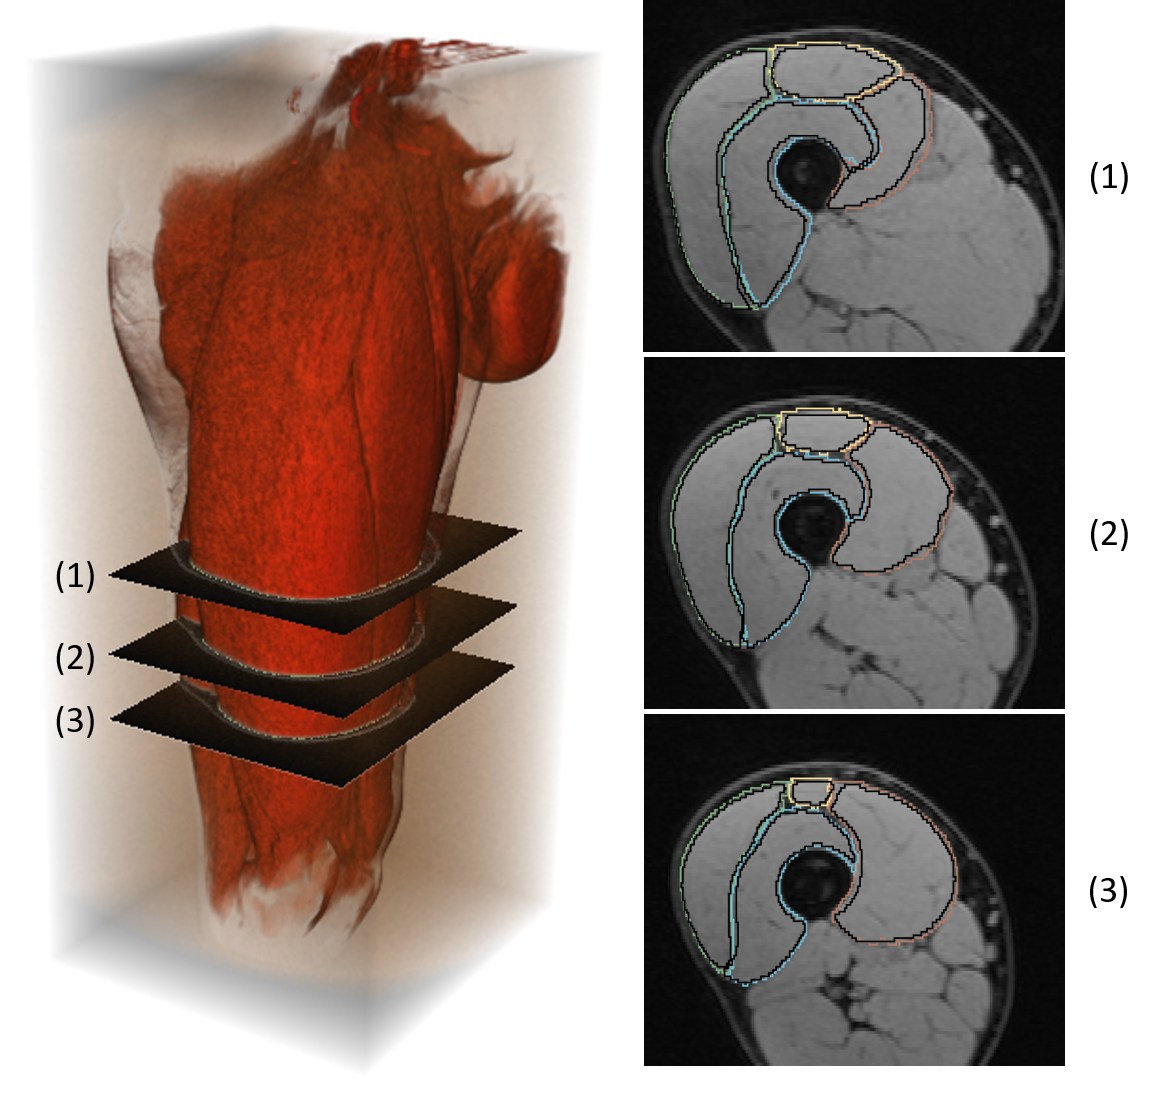
Our data included 3D Water images (2-points Dixon, 640 axial slices) MR images collected from 17 finishers from the Tor Des Géants Mountain-Ultra-Marathon (MUM) (D+24000, 330km), as well as derived parametric T2*, T2 maps1 for all 3 acquisitions time points (A - baseline before the race, B - at the finish line and C - 48h after the race). All MRI acquisitions were performed with a 1.5T mobile scanner (MAGNETOM Avanto, Siemens Healthcare). We adapted and parallelized the multi-atlas with corrective learning method of Wang et al.2 originally proposed for brain segmentation to our thighs segmentation problematics (Figure 1). In order to train and assess our approach, 7 manual segmentations of the right quadriceps heads have been done by medical experts. The Leave-One-Out scheme was adopted for validation with DICE measure3.
Using the 7 available atlas as training data, the automatic segmentation pipeline was applied to all available datasets (17 right thighs x 3 time points). As parametric maps were co-registered, we used our final segmentation templates to extract radiomic data from images in order to monitor the longitudinal inflammation changes in each individual muscles heads. Significant level was set at P ≤ .05 for all the statistical tests. Depend on the normality of the data, we employed either repeated measures ANOVA or Friedman test for global effect test, dependent t-test or Wilcoxon signed-rank test for pairwise tests. The P-values obtained for pairwise tests were adjusted with the Bonferroni adjustment method for multiple comparisons.
RESULTS & DISCUSSIONS
Based on DICE scores3, our approach provided better segmentations comparing to a recent segmentation work4 using the exact same dataset (Table 1). Figure 2 illustrates a typical result obtained when comparing our automatic segmentation (multi-atlas + corrective learning) with reference manual segmentation.
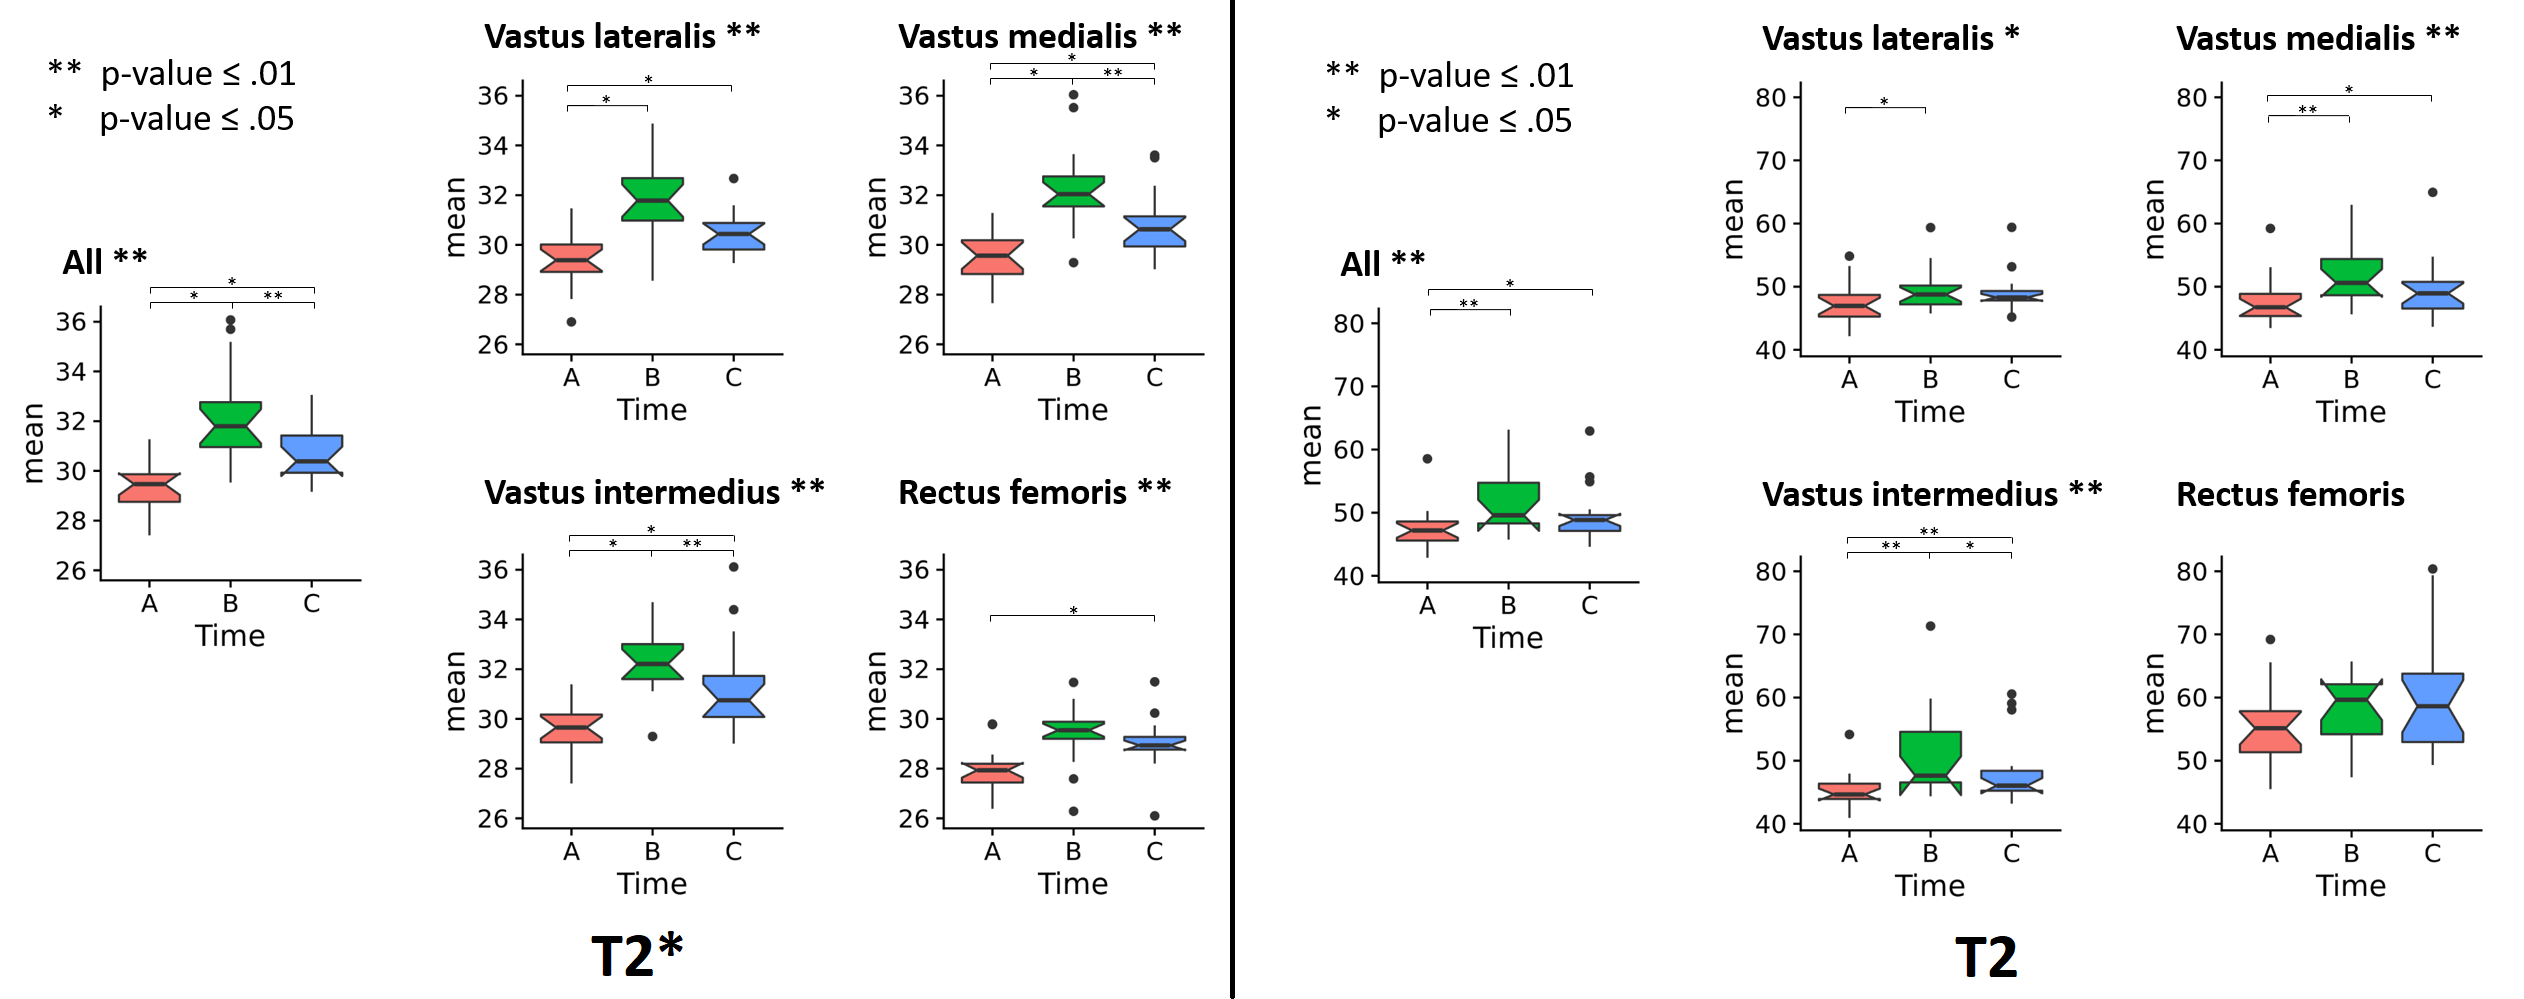
Figure 3 shows the boxplots of temporal changes of T2 and T2* mean values computed based on our segmentation for the entire quadriceps and for each individual muscle head. On overall, repeated measures analysis showed systematic and significant changes over time for both the entire quadriceps and each individual muscle head, with the same trend with an increase of T2* between baseline (A) and the finish line (B) related to inflammation process and a decrease at 48h after arrival (C) compared to (B) expected to be linked to recovery.
We note that the significant difference between A and C suggests that a 2-days recovery period is insufficient to allow a full recovery to baseline state. The amplitude of changes was similar among all muscle heads except for Rectus Femoris where pairwise comparisons did not reach significance. This is in line with findings of Sloniger et al.5 having reported that uphill running requires considerably greater activation of the vastus group but a lesser activation of the rectus femoris, compared to horizontal running. While having less significant P-values, the analysis results of mean T2 demonstrated the same difference between rectus femoris and the vastus group.
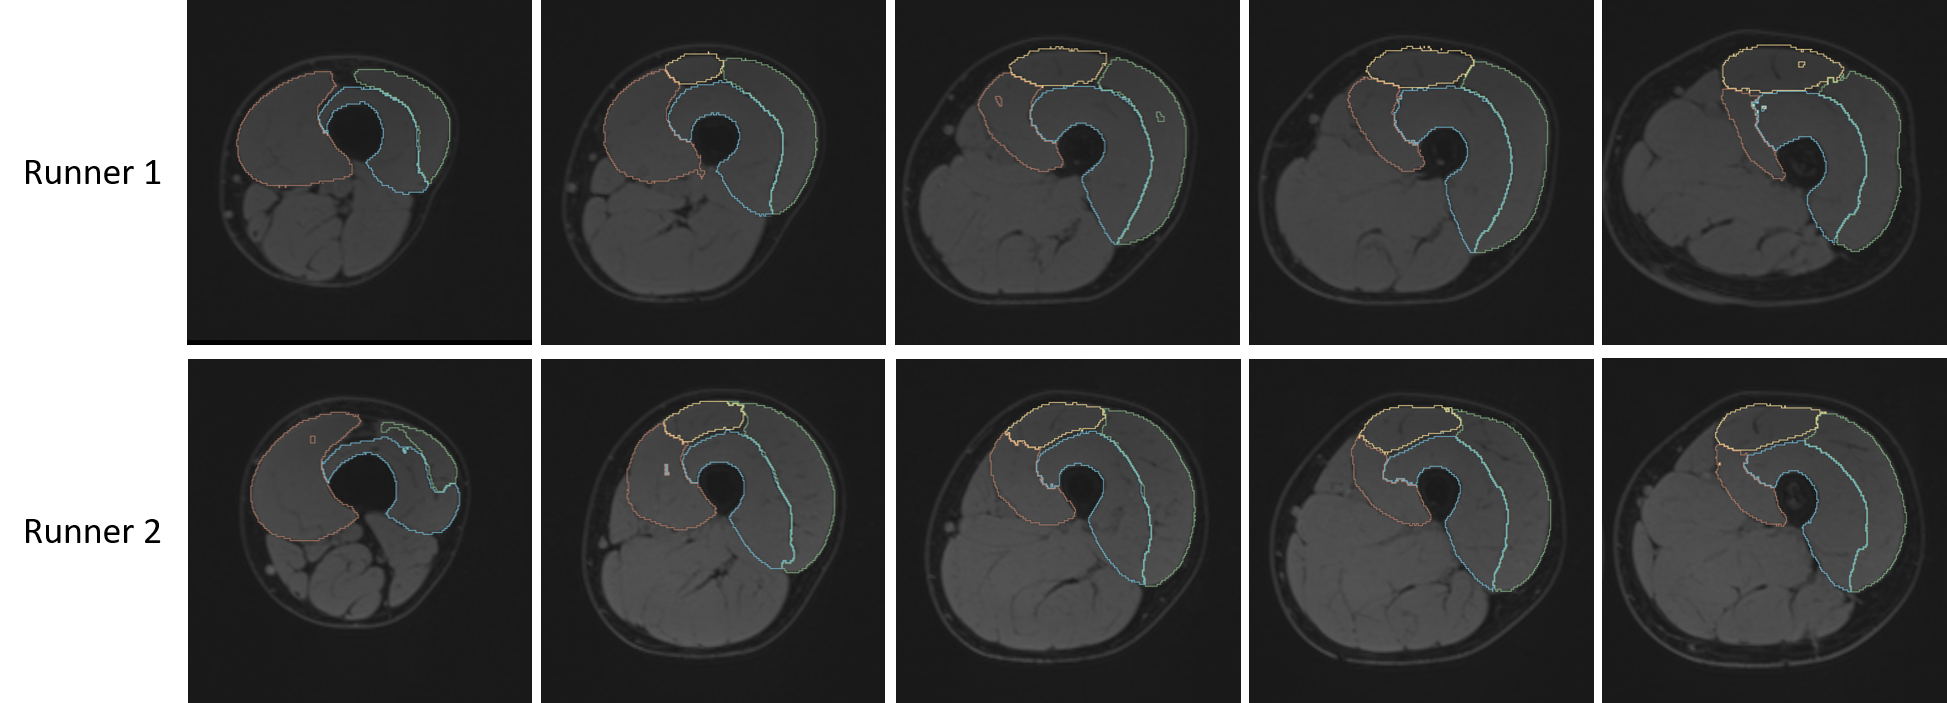
Finally, to test the robustness of our approach, we applied our algorithm based on learning from the 7 right thighs to the left thigh of two random runners (different from the runners in the training dataset). Preliminary results are encouraging as the one displayed in the figure 4.
CONCLUSION
The proposed segmentation based on corrective learning provided unraveled segmentation accuracy while requiring a very small number of training data and allowed us to investigate the local changes in individual quadriceps heads, hence the possibility of monitoring the damages in each individual muscle heads along the MUM. Considering that MRI is a non-invasive technique sensitive enough to detect very mild changes, these automatic procedures can be useful to monitor muscular disorders or potential improvements due to various treatments. Beside average signal intensity, many other image information and descriptors can be explored to identify various image biomarkers of muscle functional variations. Additionally, future work will include algorithm optimization and validation of left thigh segmentation.Acknowledgements
No acknowledgement found.References
1. Leporq B, Le Troter A, Le Fur Y, et al. Combined quantification of fatty infiltration, T 1-relaxation times and T 2*-relaxation times in normal-appearing skeletal muscle of controls and dystrophic patients. Magn Reson Mater Physics, Biol Med. 2017;30(4):407-415. doi:10.1007/s10334-017-0616-1.
2. Wang H, Yushkevich P. Multi-atlas segmentation with joint label fusion and corrective learning—an open source implementation. Front Neuroinform. 2013;7:27. doi:10.3389/fninf.2013.00027.
3. Tustison NJ, Gee JC. Introducing Dice, Jaccard, and Other Label Overlap Measures To ITK. Insight J. 2009;(2). http://hdl.handle.net/10380/3141.
4. Gilles B, de Bourguignon C, Croisille P, Beuf O, Viallon M. Automatic segmentation of quadriceps muscle head and volume quantification. ISMRM 2016, Singapour. 2016;In press.
5. Sloniger MA, Cureton KJ, Prior BM, Evans EM. Lower extremity muscle activation during horizontal and uphill running. J Appl Physiol. 1997;83(6):2073-2079. http://jap.physiology.org/content/83/6/2073.
Figures
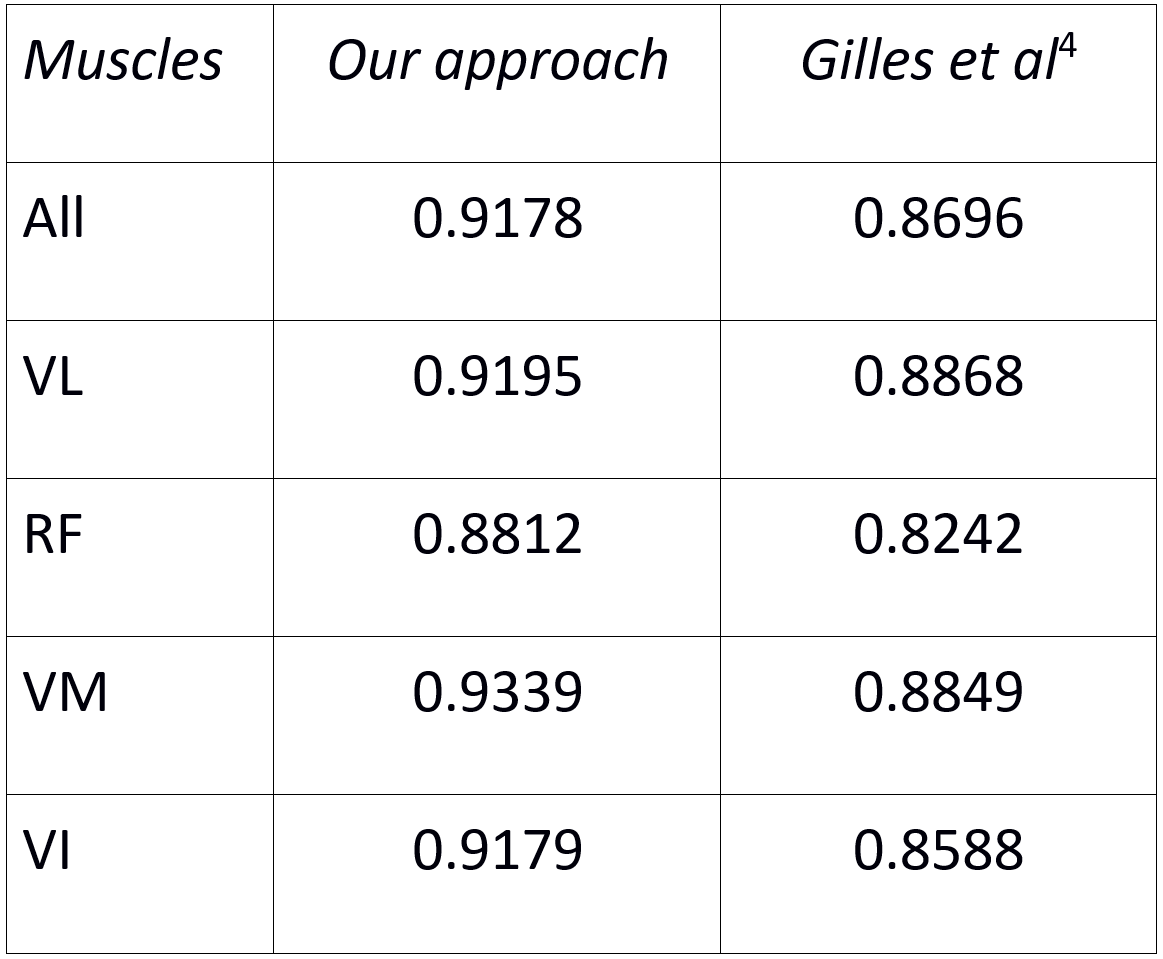
Table 1: DICE scores of the segmentation of each quadriceps head and of the entire quadriceps by our appoach and the approach of Gilles et al4 (higher value means closer segmentation to expert’s).

Figure 1: Visual description of our automated
segmentation pipeline, based on Wang et al.’s2