1397
Exploring the Textural Differences between Diseased and Normal Muscle on T1 Weighted MRIs of the Mid-calf and Mid-thigh1Duke-NUS Medical School, Singapore, Singapore, 2Department of Diagnoistic and Interventional Imaging, KK Women's And Children's Hospital, Singapore, Singapore, 3Paediatric Neurology, KK Women's and Children's Hospital, Singapore, Singapore
Synopsis
Textural analysis is a non-invasive objective method to characterize MRIs of subjects with muscular disorders. It has the potential to characterize muscle abnormalities that are not visible to the human eye. This allows the detection of muscle abnormalities earlier hence aiding early diagnosis and prognostication. This also allows textural analysis to be a potential quantitative outcome measure for clinical trials of drug treatments for muscular disorders. This study shows that the textural parameter entropy remains stable as age increases and can distinguish between diseased and normal muscle tissue.
Introduction
Muscular disorders are inherited progressive diseases that result from genetic defects that are responsible for muscle function. These diseases are often diagnosed only after a protracted period of time. As previously reported1-3, Quantitative MRI has been shown to be valuable in determining the pattern of muscle involvement in muscular disorders. It has also shown promise as an endpoint for clinical trials for treatments for muscular disorders4. The emerging role of MRI in assisting in diagnosis and prognosis for muscular disorders calls for additional methods to objectively characterise diseased muscle tissue. One such method is textural analysis. Textural analysis provides information about gray level pixels by describing their positions, intensities and distributions within an image that are not visible to the human eye5-6. In this study, textural analysis is used to generate textural features that differ between subjects with normal muscle and subjects with a diagnosed muscular disorder with the aim of detecting subtle muscle abnormalities that are not visible to the human eye.Methods
This study seeks to specifically make use of the the statistical filtration-histogram approach to perform textural analysis7 with different specific scale factors (SSF) that filters object radii that ranges from 2-6mm (SSF 0-6). The textural parameters that can be derived are mean, standard deviation (SD), entropy, mean of positive pixels (MPP), skewness and kurtosis.
The sample population consists of 7 subjects with normal muscles and 11 subjects with muscular disorders.
Subjects were scanned with a 3T MRI Sky scanner with similar TR and TE imaging parameters in KK Women's and Children's Hospital.
Textural analysis was performed with TexRAD with regions of interest (ROIs) drawn by a single operator over the anterior and posterior compartments of the mid-thigh and mid-calf in T1 weighted images.
Statistical analyses performed were the Spearmen's Rank Correlation Coefficient and the Mann-Whitney U test for significant difference.
Results
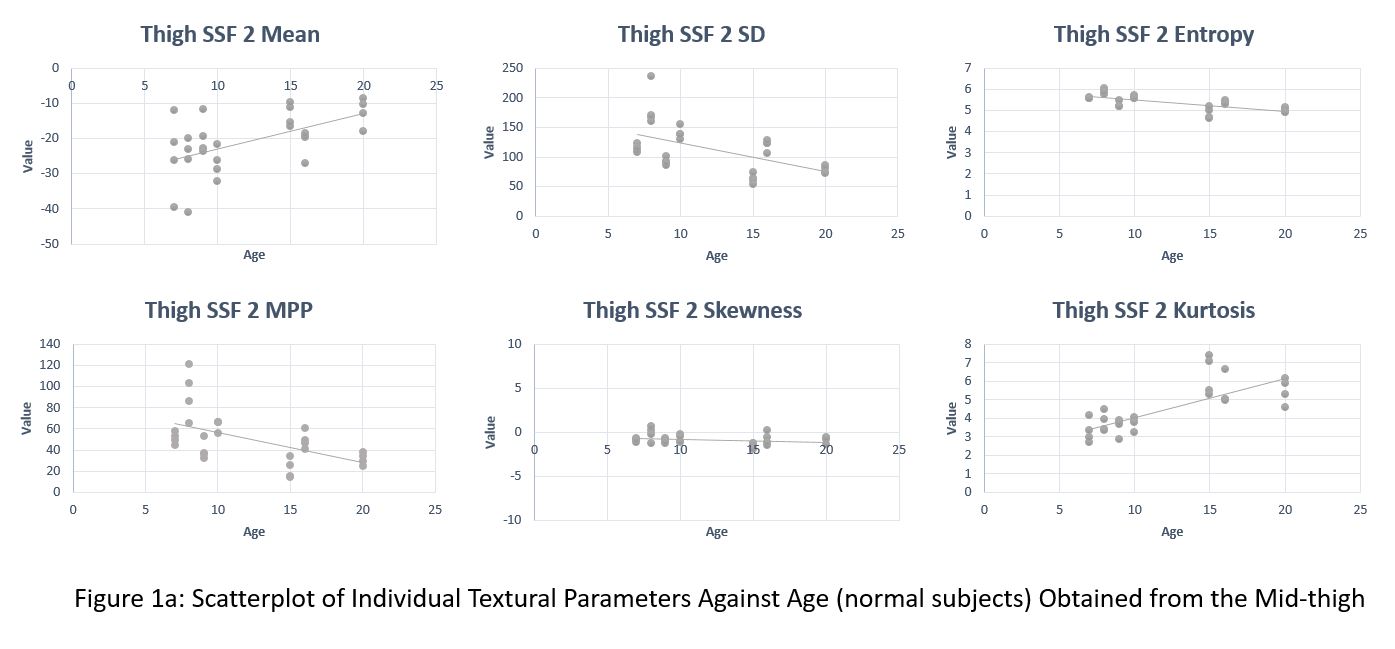
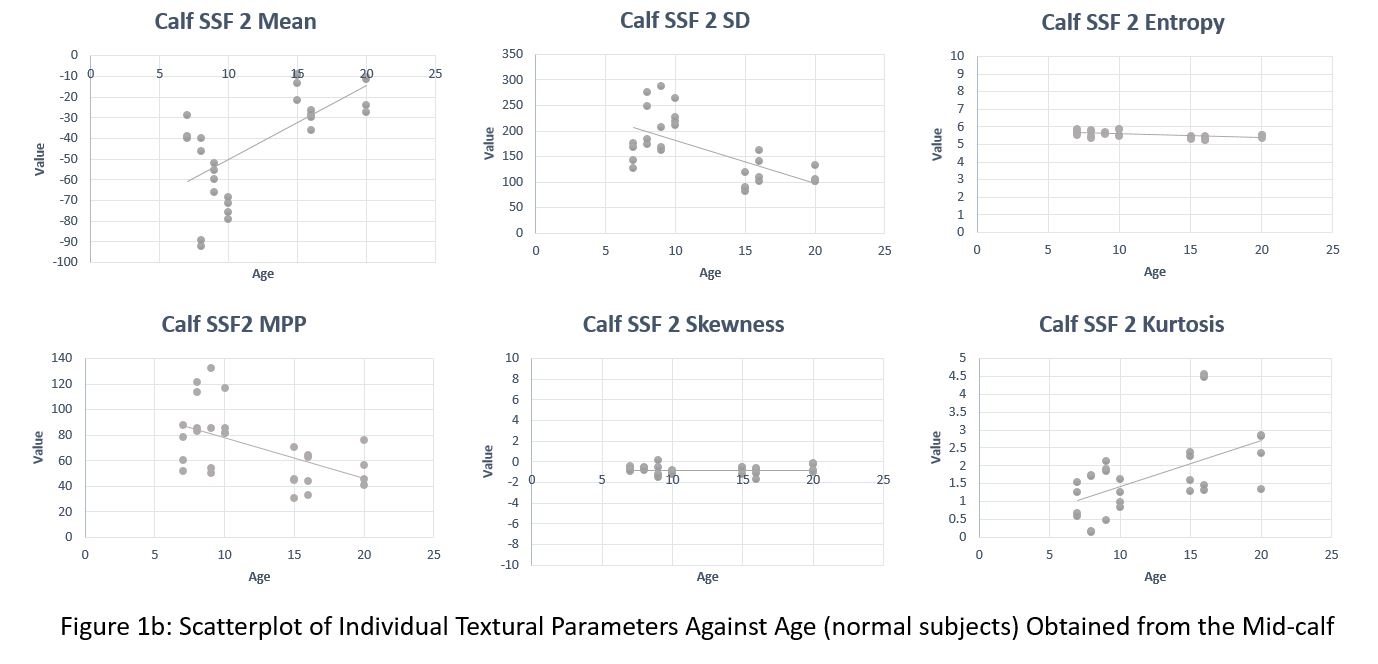
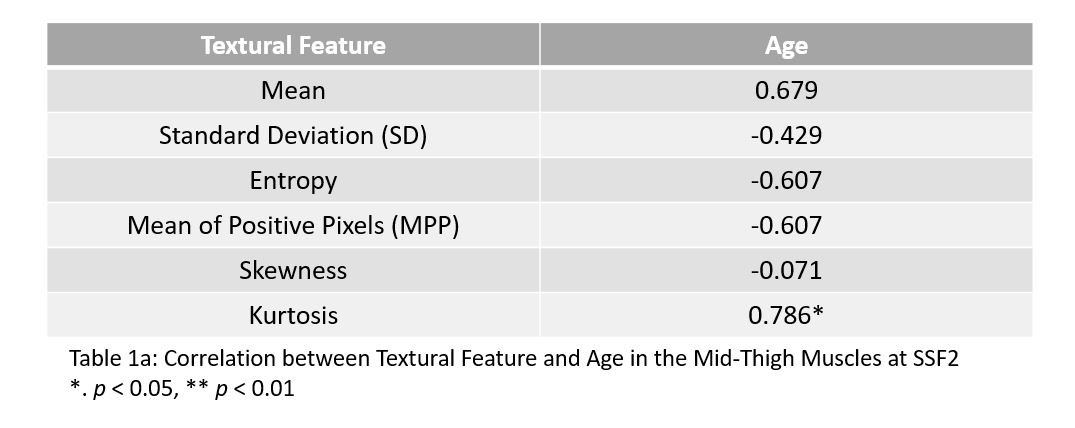
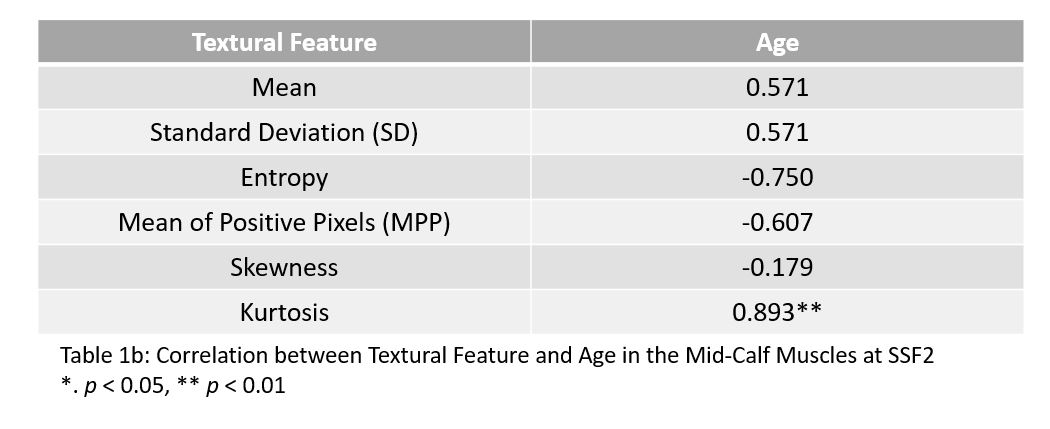
1. Entropy (thigh: cc=-0.607, calf: -0.750) and skewness (thigh: cc=-0.071, calf: -0.179) remain remarkably stable with increasing age of subjects with normal muscles in both the mid-thigh and mid-calf (Figures 1a & 1b). The correlation coefficients for the mean, SD, MPP and kurtosis in the mid-thigh were 0.679, -0.429 , -0.607 and 0.786 respectively (Table 1a). The correlation coefficients for the mean, SD, MPP and kurtosis in the mid-calf were 0.571, 0.57, -0.607 and 0.893 respectively (Table 1b). Only kurtosis was shown to correlate with age.
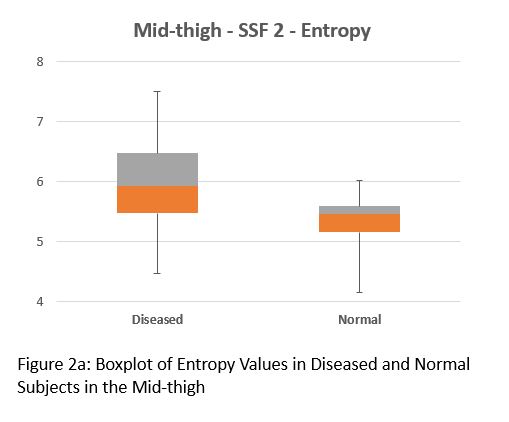
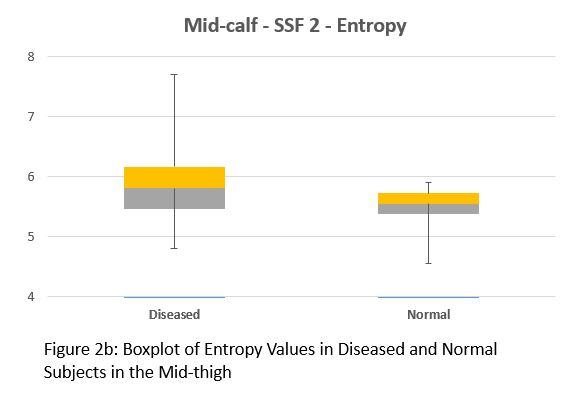
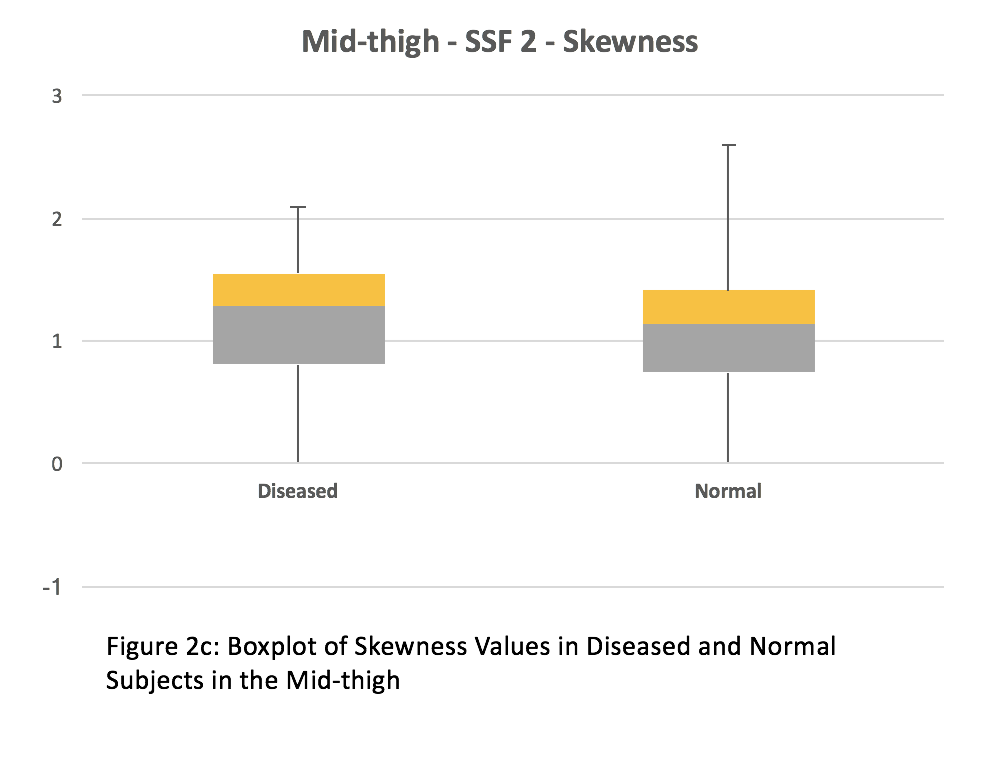
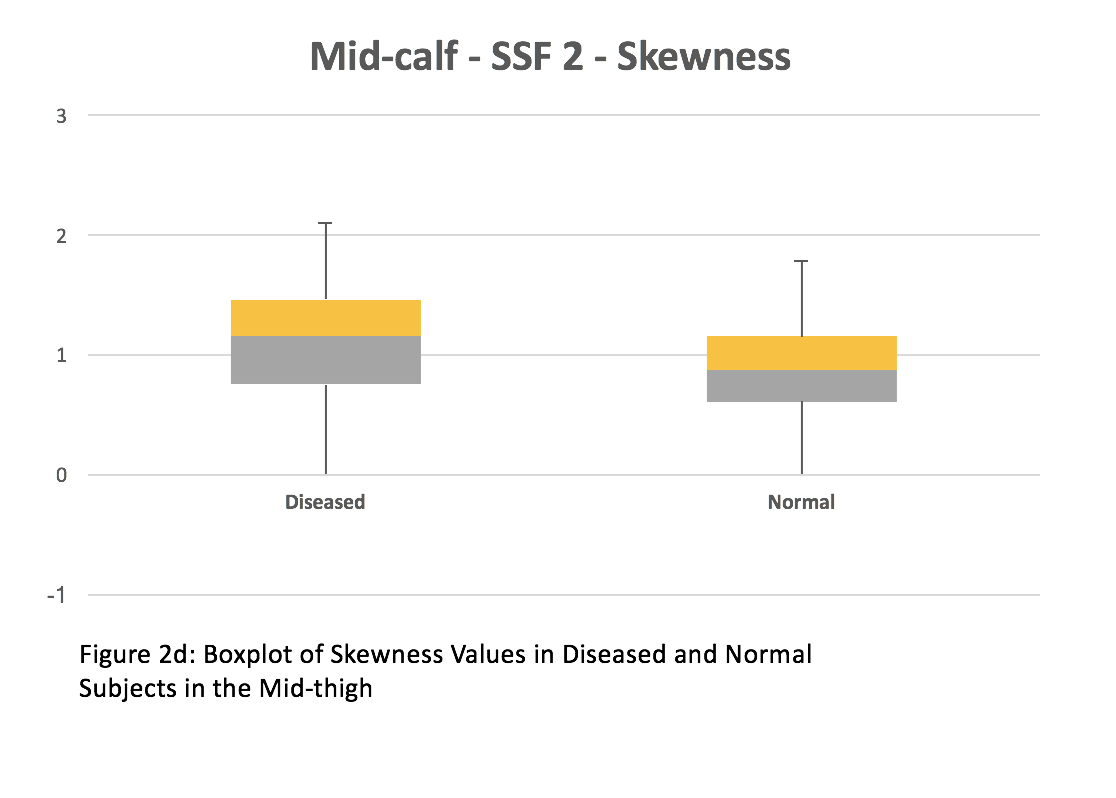
2. Entropy and skewness were chosen for comparison between subjects with muscle disease and subjects with normal muscles. In the mid-thigh of subjects with muscle disease and normal muscles, the median entropy was 5.94 and 5.46 respectively (Figure 2a). The average entropy was 6.07 ± 0.74 and 5.37 ± 0.36 respectively. The median skewness was -0.03 and -0.83 respectively (Figure 2c). The average skewness was -0.13 ± 0.58 and -0.85 ± 0.6 respectively. In the mid-calf of subjects with muscle disease and normal muscles, the median entropy was 5.73 and 5.53 respectively (Figure 2b). The average entropy was 5.89 ± 0.54 and 5.55 ± 0.19 respectively. The median skewness was -0.44 and -0.8 respectively (Figure 2d). The average skewness was -0.49 ± 0.52 and -0.8 ± 0.4 respectively. Both entropy and skewness were greater in both the mid-thigh (p < 0.001) and mid-calf (p < 0.001) of subjects with muscle disease compared to normal muscles.
Discussion
The statistical parameter entropy describes disorder or variability of pixels within the ROI. This is in line with the pathophysiological changes in the muscles of subjects with muscular disorders. Fatty infiltration is the one of the MRI features that is assessed in MRIs of diseased muscle. On T1 weighted images, fatty infiltration results in increased signal intensity hence leading to increased variability of pixels within the muscle. This is hence picked up by the textural feature entropy.
The clinical relevance of textural analysis is its ability to provide objective monitoring of disease progression. This aids prognostication and patient communication about what to expect as the disease progresses. As clinical trials mostly make use of scoring systems based on visual inspection as outcome measures, textural analysis can potentially be an objective outcome measure of clincal trials for treatments.
There are a number of limitations to this study. The ROIs drawn are subject to inter-operator variability as they are drawn manually. The ROIs were also drawn in a 2D space which makes the analysis less informative compared to a volumetric analysis. The sample size in this study is also small. These study methods may also not be applicable to other studies where MRI parameters differ.
Conclusion
The textural features entropy and skewness were significantly greater in subjects with disease muscle compared to normal subjects.Acknowledgements
This study was supported by the Department of Diagnostic and Interventional Imaging in KK Women's and Children's Hospital and Duke-NUS Medical School.References
1. Mercuri, E., Pichiecchio, A., Counsell, S., Allsop, J., Cini, C., Jungbluth, H., … Bydder, G. (2002). A short protocol for muscle MRI in children with muscular dystrophies. European Journal of Paediatric Neurology, 6(6), 305–307. https://doi.org/10.1016/S1090-3798(02)90617-3
2. Mercuri, E., Pichiecchio, A., Allsop, J., Messina, S., Pane, M., & Muntoni, F. (2007). Muscle MRI in inherited neuromuscular disorders: Past, present, and future. Journal of Magnetic Resonance Imaging, 25(2), 433–440. https://doi.org/10.1002/jmri.20804
3. Jungbluth, H., Davis, M. R., Müller, C., Counsell, S., Allsop, J., Chattopadhyay, A., … Muntoni, F. (2004). Magnetic resonance imaging of muscle in congenital myopathies associated with RYR1 mutations. Neuromuscular Disorders, 14(12), 785–790. https://doi.org/10.1016/j.nmd.2004.08.006
4. Fischmann, A., Hafner, P., Gloor, M., Schmid, M., Klein, A., Pohlman, U., … Fischer, D. (2013). Quantitative MRI and loss of free ambulation in Duchenne muscular dystrophy. Journal of Neurology, 260(4), 969–974. https://doi.org/10.1007/s00415-012-6733-x
5 Kjær, L., Ring, P., Thomsen, C., & Henriksen, O. (1995). Texture Analysis in Quantitative MR Imaging. Acta Radiologica, 36(2), 127–135. https://doi.org/10.1080/02841859509173364
6 Castellano, G., Bonilha, L., Li, L. M., & Cendes, F. (2004). Texture analysis of medical images. Clinical Radiology, 59(12), 1061–1069. https://doi.org/10.1016/j.crad.2004.07.008
7 Miles, K. A., Ganeshan, B., & Hayball, M. P. (2013). CT texture analysis using the filtration-histogram method: What do the measurements mean? Cancer Imaging, 13(3), 400–406. https://doi.org/10.1102/1470-7330.2013.9045
Figures