1394
Impact of Rate of Cuff Inflation on the Post-Ischemia Hyperemic Response1Department of Bioengineering, University of Pennsylvania, Philadelphia, PA, United States, 2Department of Radiology, University of Pennsylvania, Philadelphia, PA, United States
Synopsis
The ischemia-reperfusion paradigm can be used to evaluate skeletal muscle and peripheral vascular function. To induce ischemia, a cuff is inflated to a suprasystolic pressure, which leads to occlusion of the blood vessels, and reactive hyperemia results upon cuff deflation. This study was done to determine whether the rate at which the cuff inflates affects the hyperemic response. MRI data were acquired using the ischemia-reperfusion paradigm under slow and fast cuff inflation rates with PIVOT and projection velocity mapping in eight healthy subjects. The results suggest that there were no significant differences between hyperemic responses from slow and fast inflations.
Introduction
The ischemia-reperfusion paradigm is a useful tool to assess skeletal muscle and peripheral vascular function. In such a protocol, ischemia is induced by inflating a cuff secured around the arm or thigh to a suprasystolic pressure. Following a period of occlusion, deflating the cuff results in reactive hyperemia. MRI can be used to examine the response during the ischemia and reactive hyperemia phases by measuring parameters such as perfusion, venous oxygen saturation (SvO2), T2*, and blood velocity. A previous study reported that perfusion and T2* measurements in skeletal muscle during hyperemia can be influenced by the degree of vascular filling prior to the onset of ischemia1. In addition to specific vascular filling protocols as used in 1, vascular filling will also occur while the pressure of the cuff exceeds venous pressure but remains subsystolic. Therefore, the degree of vascular filling may differ in studies that induce ischemia by manual cuff inflation compared to those that use an automatic pneumatic tourniquet. As such, the purpose of this study was to determine whether the rate of cuff inflation impacts the post-ischemia hyperemic response.Methods
This study’s procedures were approved by the University of Pennsylvania’s Institutional Review Board. To evaluate the impact of cuff inflation rate, eight healthy subjects (age 30.1±7.9 years, 5 males) underwent a repeated induced ischemia protocol with varied speed of cuff inflation. For each subject, data were collected during four ischemia-reperfusion paradigms, each with 1 minute of baseline, 3 minutes of occlusion, and 5 minutes of recovery. To induce ischemia, a cuff was placed around the thigh and inflated to 225 mmHg using a rapid cuff inflation system (D.E. Hokanson Inc; Bellevue, WA). The cuff was either inflated slowly (slow), or automatically (fast), with average cuff inflation times of 11.6±1.9, and 1.2±1.3 seconds, respectively. Each subject’s blood pressure was recorded after the scan, and venous pressure was assumed to be 10 mmHg. Vascular filling time was defined as the duration during which the cuff pressure was between venous and systolic pressures.
The MRI protocol comprised a projection velocity mapping technique to measure arterial velocity2, and PIVOT3, which simultaneously measures perfusion, SvO2, and T2*. An 8-channel transmit/receive knee coil was used for acquisition at 3T with the following parameters: Perfusion – partial Fourier GRE-EPI: FOV=250×250mm2, matrix=80×50 (reconstructed to 80×80), slice thickness=1cm, slice location=isocenter, TR/TE=1s/8.05ms, PLD=952ms; SvO2 and T2* – multi-echo GRE: FOV=96×96mm2, acquisition matrix=96×24 (SvO2 reconstructed to 96×96 using keyhole4 and a fully phase-encoded reference), slice thickness=1cm, slice location=30mm inferior to isocenter, TR/TE1/TE2/TE3/TE4/TE5=38.12/3.78/6.99/12.32/19.32/26.32ms; and projection velocity – TE/TR=5.23/10ms, flip angle=15°, FOV=128×128mm2, slice thickness=5mm, matrix=128×1, VENC=120cm/s.
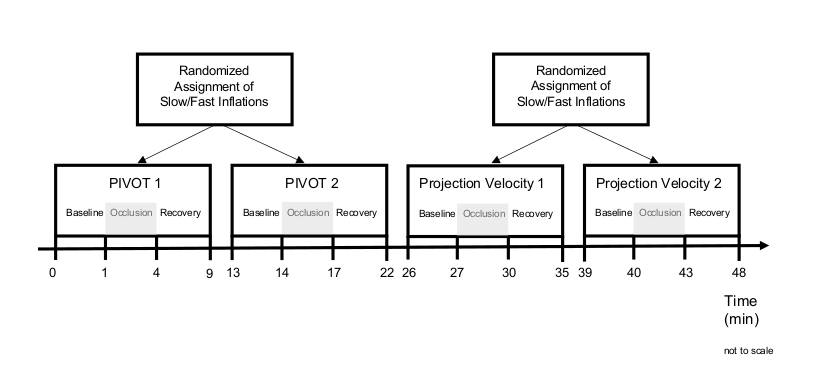
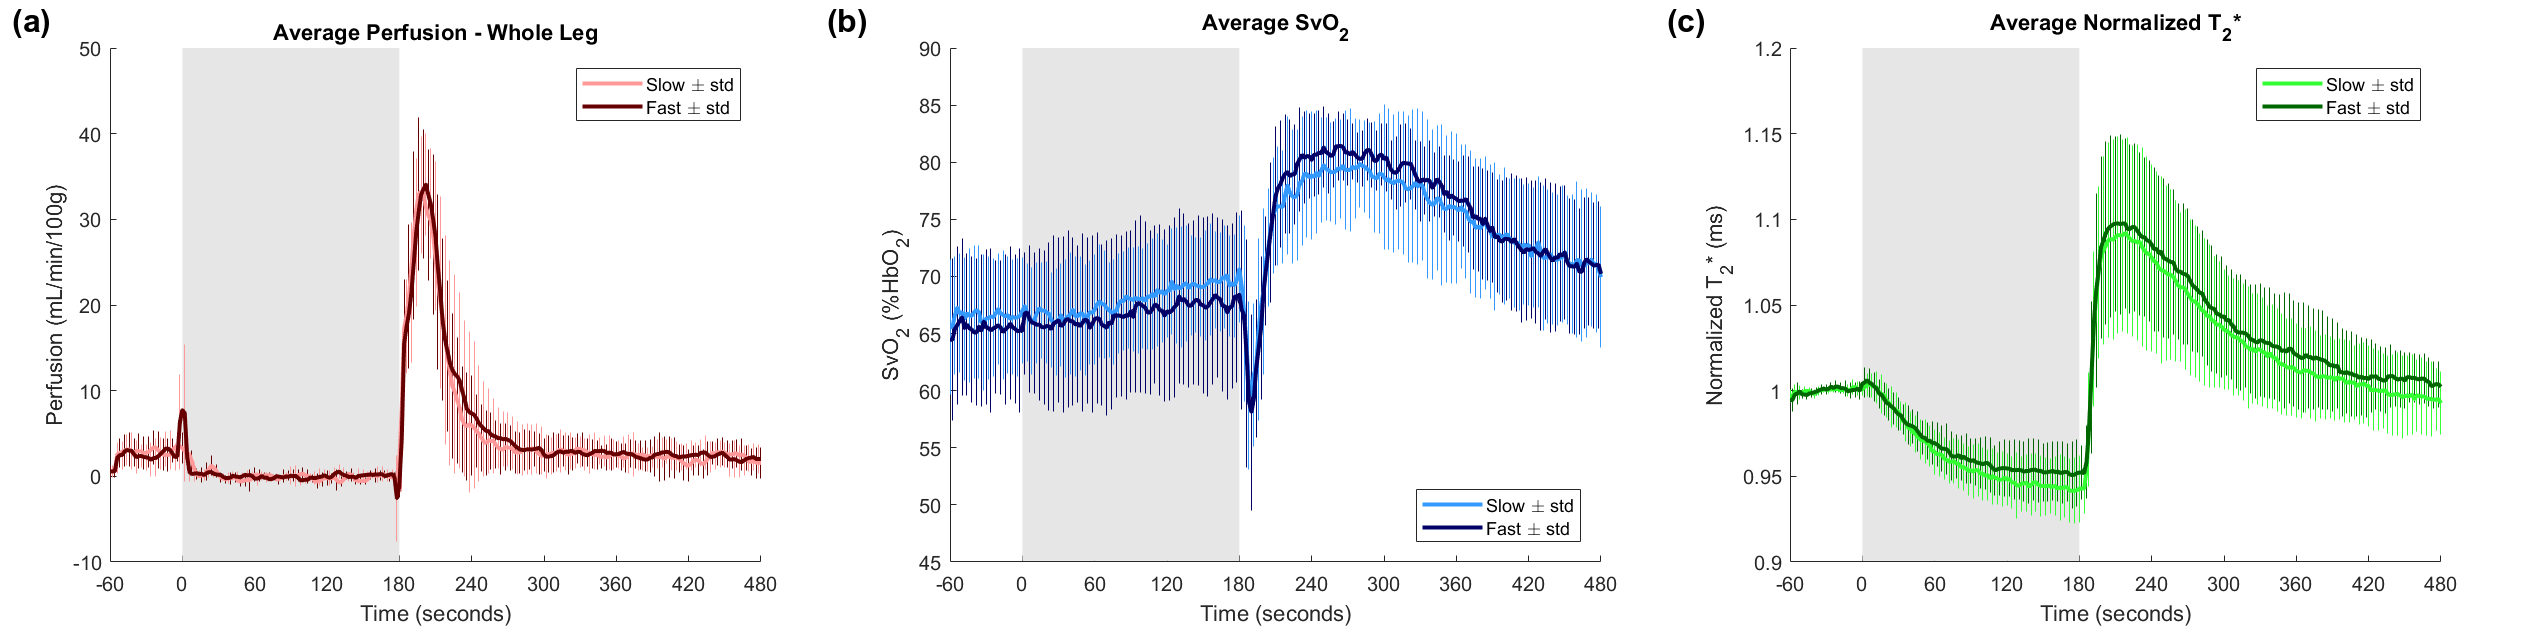
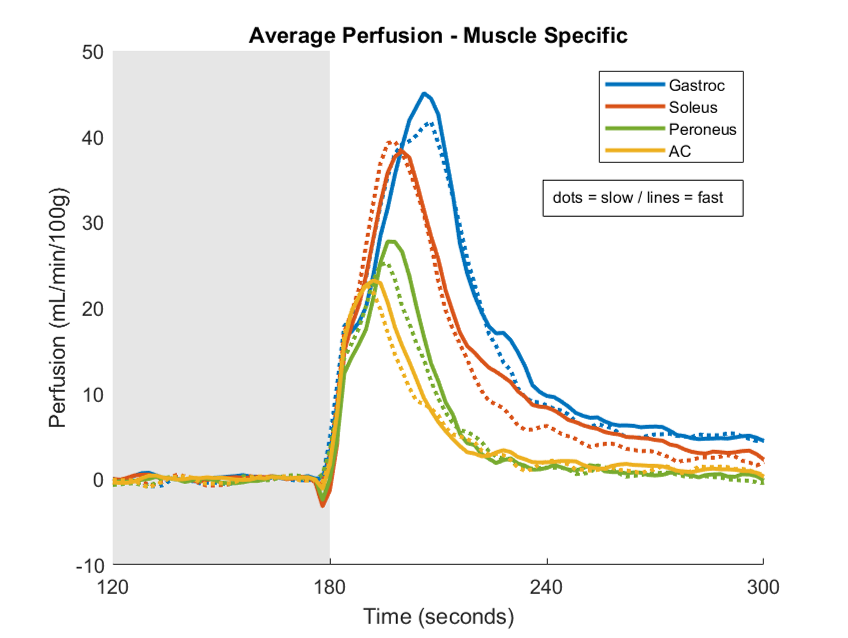
Each subject was imaged with PIVOT and projection velocity with slow and fast inflation rates. The sequence of slow or fast inflations for each scan was randomized. Figure 1 illustrates the experimental protocol. Perfusion was computed via the model in Raynaud, et al5 in the cross-section of the leg and in muscle-specific regions of interest (gastrocnemius, soleus, and peroneus muscles, and in the anterior compartment). SvO2 was calculated via susceptometry-based oximetry6 in the larger of the peroneal or posterior tibial veins, with the same vein chosen in both conditions for each subject. T2* was calculated in the soleus muscle, and was normalized by the average baseline. Velocity was calculated in the popliteal artery as described in 3. The Wilcoxon signed-rank tests were used to test for differences in the time-course parameters of perfusion, SvO2, T2*, and arterial velocity between slow and fast occlusions.
Results
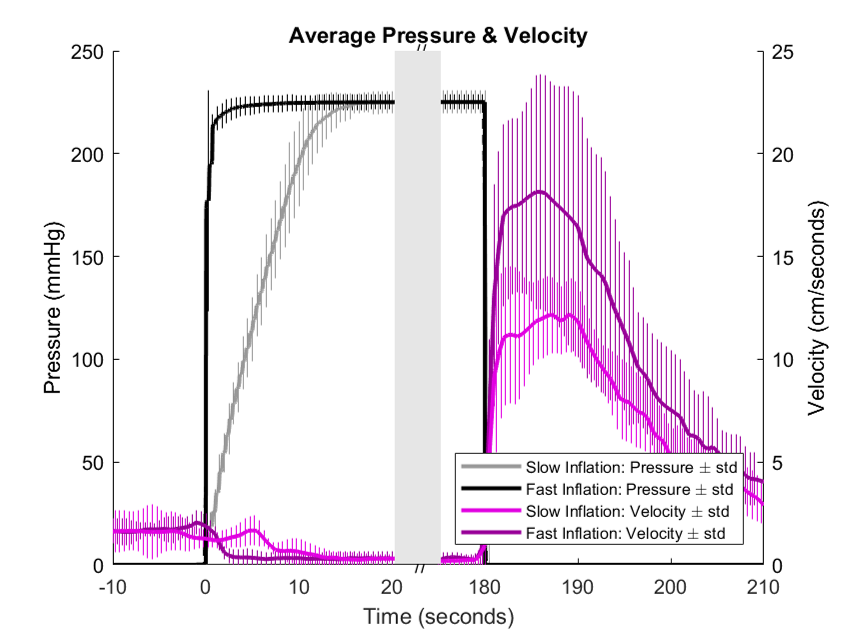
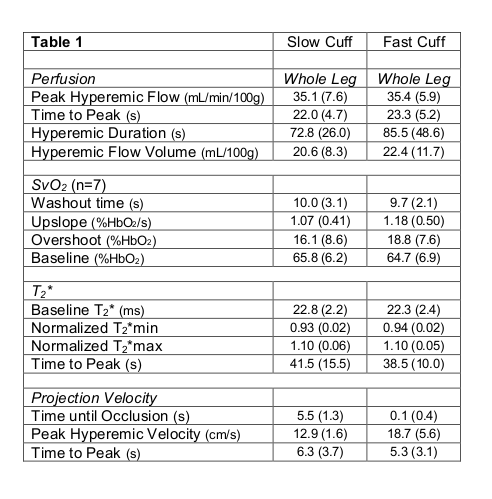
Figure 2 shows the average pressure and velocity time-courses for slow and fast conditions. The average pressure-based vascular filling times for the slow and fast conditions were 5.46±0.92 and 0.03±0.00 seconds, respectively. The average systolic blood pressure was 123.7±8.8 mmHg. Figures 3a, 3b, and 3c show the whole leg average perfusion, SvO2, and normalized T2* time-courses, respectively. Figure 4 shows the muscle specific perfusion response. The measured time-course parameters are shown in Table 1. There were no statistically significant differences between the slow and fast conditions after correction for multiple comparisons7.Discussion & Conclusion
The results overall suggest that there were no significant differences in the post-ischemic reactive hyperemia response between the slow and fast occlusion conditions. It is possible that there may be differences between the two conditions that our study is underpowered to detect. However, if present, the differences would probably be minor, and therefore are unlikely to be clinically significant. In future work, we will explore changing the rate of inflation in the slow condition to determine a threshold rate at which the measured parameters change in a clinically meaningful way.Acknowledgements
This work was supported by NIH Grants T32GM007170 and T32HL007954.References
1. Duteil S, Wary C, Raynaud JS, et al. Influence of vascular filling and perfusion on BOLD contrast during reactive hyperemia in human skeletal muscle. Magn Reson Med. 2006;55(2):450-454.
2. Langham MC, Jain V, Magland JF, et al. Time-resolved absolute velocity quantification with projections. Magn Reson Med. 2010;64(6):1599-1606.
3. Englund EK, Langham MC, Li C, et al. Combined measurement of perfusion, venous oxygen saturation, and skeletal muscle T2* during reactive hyperemia in the leg. J Cardiovasc Magn Reson. 2013;15:70.
4. van Vaals JJ, Brummer ME, Dixon WT, et al. "Keyhole" method for accelerating imaging of contrast agent uptake. J Magn Reson Imaging. 1993;3(4):671-675.
5. Raynaud JS, Duteil S, Vaughan JT, et al. Determination of skeletal muscle perfusion using arterial spin labeling NMRI: Validation by comparison with venous occlusion plethysmography. Magn Reson Med. 2001;46(2):305-311.
6. Langham MC, Floyd TF, Mohler ER 3rd, et al. Evaluation of cuff-induced ischemia in the lower extremity by magnetic resonance oximetry. J Am Coll Cardiol. 2010;55(6):598-606.
7. Holm S. A Simple Sequentially Rejective Multiple Test Procedure. Scand J Stat. 1979;6(2):65-70.
Figures