1391
Macromolecular fraction from magnetization transfer ultrashort echo time (MT-UTE) modeling proportionally correlates with applied mechanical load on the cadaveric knee joint1Radiology, University of California, San Diego, San Diego, CA, United States, 2GE Healthcare, San Diego, CA, United States, 3Radiology Service, VA San Diego Healthcare System, San Diego, CA, United States
Synopsis
Ultrashort echo time (UTE) MRI is able to assess long T2 tissues such as articular cartilage (AC) and short T2 tissues such as meniscus. Early stage of osteoarthritis is hypothesized to affect the mechanical properties of AC, sooner and quicker than its morphology. This study focused on the application of UTE imaging, including UTE magnetization transfer (UTE-MT) modelling, adiabatic T1r, T1 and T2* measurements in cadaveric human knee joints subject to sequential mechanical loading. Compression load application resulted in significant increases in macromolecular fraction estimated in AC and meniscus, obtained by two-pool MT modeling. T1, T1ρ and T2* biomarkers did not show consistent trends.
Introduction
Femorotibial articular cartilage (AC)
and meniscus are key elements of knee joint and always under compressive
mechanical loads 1. When the
knee is under the mechanical load, free water redistributes within the AC and
meniscus and eventually flows towards the intraarticular synovial fluid 1.
Noninvasive assessment of AC and
meniscus has been of great interests to musculoskeletal researchers. Mechanical properties of the musculoskeletal tissues may
vary at early stage of diseases, sooner and quicker than their morphological changes. Thus, quantitative MRI properties of cartilage and meniscus
under mechanical loading have been studied by different research groups 2–5. T2 and adiabatic
T1ρ are among most common studied MRI properties in loaded knee joints. Ultrashort
echo time (UTE) MRI sequences have been developed to image the short T2 tissues
and were used in few studies to investigate AC and meniscus 6–8. However,
UTE-MRI knee properties under mechanical loading is not well
studied.
Among all UTE sequences, the magnetization
transfer (UTE-MT) modelling has shown its low sensitivity to the magic angle
effect 9. UTE-MT is
an MR imaging technique exploring the exchange of magnetizations between macromolecular
and water components 9,10.
This study was aimed to investigate
the MMF variation, obtained from UTE-MT modelling, in AC and meniscus of human
cadaveric knee joints under mechanical loading. The UTE-MT variation were
compared with UTE-T1, UTE AdiabT1ρ11,
and UTE-T2*.Methods
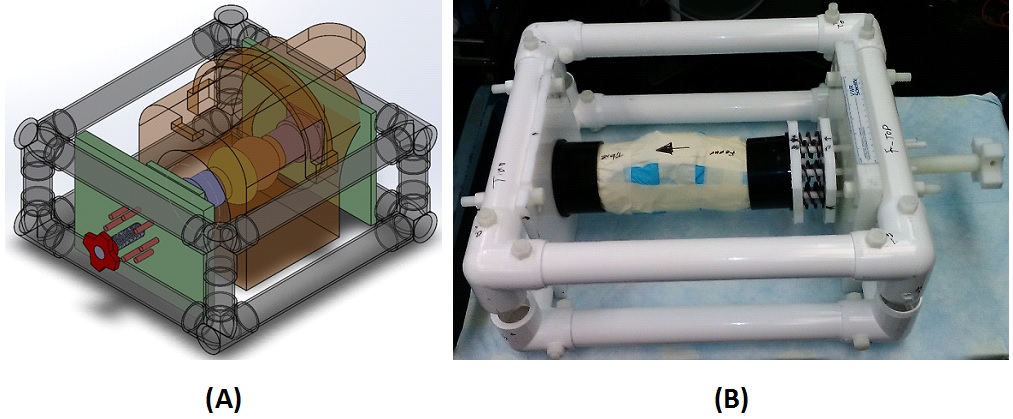
Sample preparation: A human knee joint (31-years donor), was used in this study. The femur and tibia were cut, approximately six inches from the joint center (joint was intact), being able to fit in the clamps of an in-house designed loading device (Fig.1).
Mechanical loading device: An MRI compatible loading device (Fig.1) employed eight sets of plastic springs (LL100125U40G, Lee Spring, NY, USA). The compression load was adjustable manually using a 1-inch Nylon screw and measured using the length of the spring (stiffness≈0.32 Kg/mm). The knee was scanned at three steps of loading; 1) zero, 2) 30 (half of the donor’s weight) and 2) 50 Kgf.
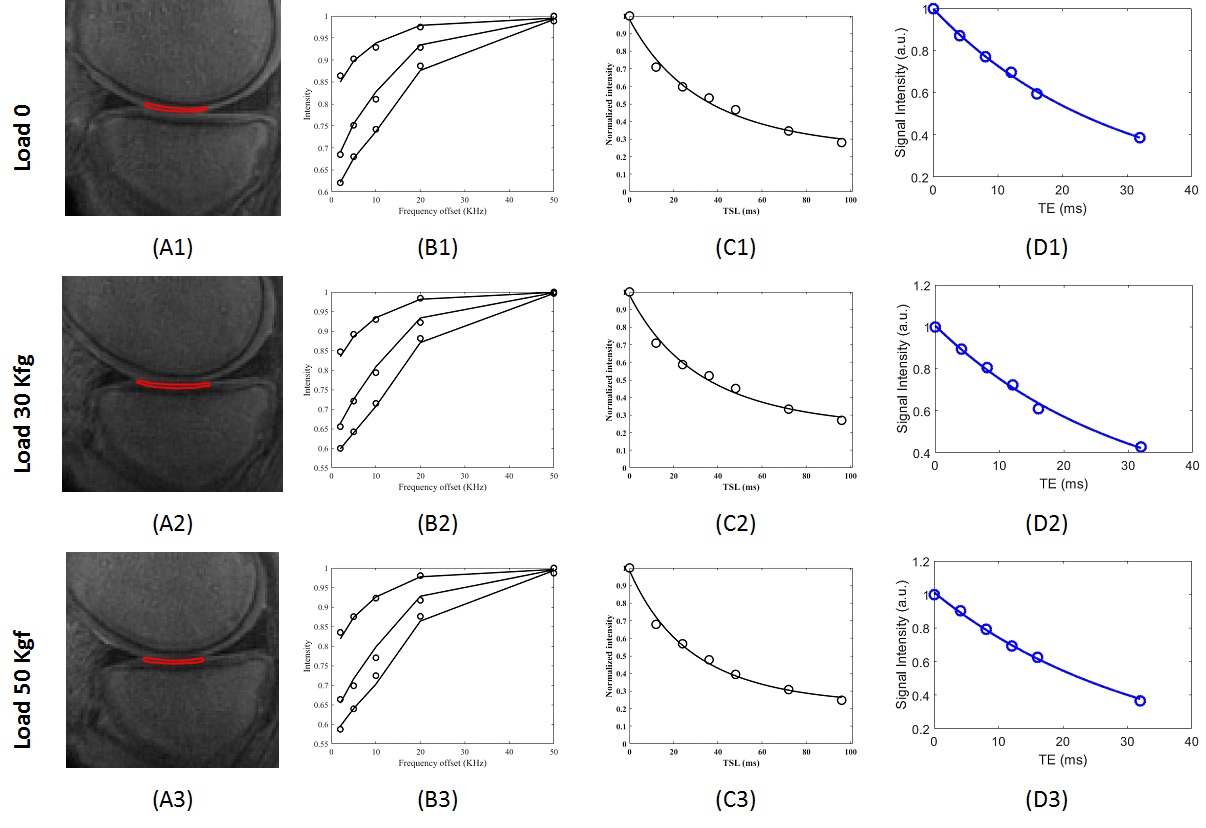
UTE sequences: The knee joint imaged in the sagittal plane on a clinical 3T MR scanner (MR750, GE Healthcare Technologies, Milwaukee, WI) and an eight-channel knee coil. For each loading, the following four imaging protocols were performed; A) 3D-UTE-MT-cones with three saturation pulse powers (θ=500°,1000°, and 1500°) and five frequency offsets (Δf=2 , 5, 10, 20 and 50 kHz) 10, B) 3D-UTE-cones with variable flip angles (FA = 5, 10, 20 and 30, TR=20 ms), C) 3D-UTE-Cones AdiabT1ρ: spin-locking time (TSL)=6,12, 24, 36, 48, 72 and 96 ms, D) 3D-UTE-T2* (TE=0.032, 4.1, 8.1, 12.1, 16.1, and 32 ms). Other imaging parameters included: FOV=14cm, matrix=256×256, slice thickness=2mm, 48 slices. The total scan time was 148 min.
Data analysis: For each set of images, femoral and tibial AC in the medial knee joint in addition to meniscus (ACF, ACT, and M) were defined for further analyses. The MMF, T1, T2* and adiabT1ρ were calculated in selected ROIs and compared between different loading conditions.
Results
Figure 2 shows the selected ROIs in tibial AC (ACT) at the three loading
conditions. The two-pool MT modeling, adiabT1ρ and
T2* results of the selected ROIs are shown in Figure 2 B-D, respectively. The
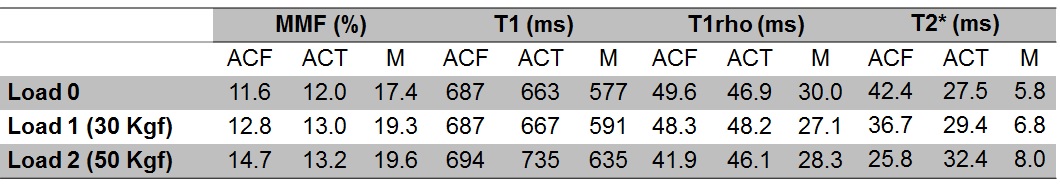
estimated MMF, T1, AdiabT1ρ
and T2* for all ROIs are presented in Table 1
at the three loading conditions. MMF fractions increased in all selected ROIs, under
both mechanical loads. The higher the mechanical loads, the
higher the MMF. T1 value was increased clearly only in meniscus for both
loading steps. AdiabT1ρ
values decreased in ACF under both loading steps. For other ROIs, no obvious trend
was observed. T2* was decreased in ACF yet increased in other ROIs, for both loading steps.
Discussion
The designed loading device provided measurable,
consistent, and reproducible mechanical loads on the knee joint.
Compression loading resulted in a consistent increase in MMF at both loadings
steps and all selected ROIs. The MMF increase was proportionally correlated
with the magnitude of the applied loads. Other investigated MRI properties did not show
consistent and clear trends for both loading steps in this particular knee
joint. might be a result of the interplay between
the magic angle effect and the water redistribution in loaded knee joint.Conclusion
This study highlighted the feasibility of UTE-MT modelling technique to assess the AC and meniscus under loading. UTE-MT modelling as a method insensitive to the magic angle effect can be used for further mechanical MRI-based assessment of the AC and meniscus, as well as other knee joint tissues such as ligaments and tendons. In future steps, nine more cadaveric specimens will be investigated with the same protocol to further validate those findings.Acknowledgements
The authors acknowledge grant support from NIH (1R01 AR062581-01A1, 1 R01 AR068987-01) and the VA Clinical Science R&D Service (Merit Award I01CX001388).References
1.Mansour, J. M. Biomechanics of Cartilage. Kinesiol. Mech. pathomechanics Hum. Mov. 66–79 (2009). doi:10.1002/art.23548
2.Nishii, T., Kuroda, K., Matsuoka, Y., Sahara, T. & Yoshikawa, H. Change in knee cartilage T2 in response to mechanical loading. J. Magn. Reson. Imaging 28, 175–180 (2008).
3.Mayerhoefer, M. E. et al. The in vivo effects of unloading and compression on T1-Gd (dGEMRIC) relaxation times in healthy articular knee cartilage at 3.0 Tesla. Eur. Radiol. 20, 443–449 (2010).
4.Souza, R. B. et al. Response of knee cartilage T1rho and T2 relaxation times to in vivo mechanical loading in individuals with and without knee osteoarthritis. Osteoarthritis Cartilage 22, 1367–76 (2014).
5.Cotofana, S. et al. In vivo measures of cartilage deformation: Patterns in healthy and osteoarthritic female knees using 3T MR imaging. Eur. Radiol. 21, 1127–1135 (2011). 6. Shao, H. et al. UTE bi-component analysis of T2* relaxation in articular cartilage. Osteoarthr. Cartil. 24, 364–373 (2016).
7.Qian, Y., Williams, A. A., Chu, C. R. & Boada, F. E. Multicomponent T2* mapping of knee cartilage: Technical feasibility ex vivo. Magn. Reson. Med. 64, 1427–1432 (2010).
8.Williams, A., Qian, Y. & Chu, C. R. UTE-T2* mapping of human articular cartilage in vivo: A repeatability assessment. Osteoarthr. Cartil. 19, 84–88 (2011).
9.Ma, Y.-J. J., Shao, H., Du, J. & Chang, E. Y. Ultrashort echo time magnetization transfer (UTE-MT) imaging and modeling: magic angle independent biomarkers of tissue properties. NMR Biomed. 29, 1546–1552 (2016).
10.Ma, Y.-J., Chang, E. Y., Carl, M. & Du, J. Quantitative magnetization transfer ultrashort echo time imaging using a time-efficient 3D multispoke Cones sequence. Magn. Reson. Med. 0, 1–9 (2017). 11.Casula, V. et al. Validation and optimization of adiabatic T1ρ and T2ρ for quantitative imaging of articular cartilage at 3 T. Magn. Reson. Med. 77, 1265–1275 (2017).
Figures