1390
Effect of spin-lock field direction on chemical exchange spin-lock (CESL) and evaluate its feasibility of glycosaminoglycan (GAG) detection at 3.0T1Imaging and Interventional Radiology, The Chinese University of Hong Kong, Shatin, Hong Kong
Synopsis
Chemical exchange spin-lock (CESL) is sensitive to fast exchange metabolites. CESL is performed across a range of resonance frequency offsets. At any frequency offset, either
Introduction
Chemical exchange spin-lock (CESL)1 has been exploited as a new approach to detect chemical exchange effect in metabolites in addition to the chemical exchange saturation transfer (CEST) technologies. It is reported that CESL may be more sensitive to probe intermediate to fast chemical exchange process compared to CEST.1, 2 CESL is performed with spin-lock RF pulses at a range of resonance frequency offsets. During the spin-lock process, the spins are locked along the effective spin-lock field. The spins can be locked either parallel or anti-parallel to the effective spin-lock field, which may result in different measurement of chemical exchange contrast. Therefore, it is important to understand the effect of spin-lock direction on CESL. In this work, we report our investigation of CESL technologies and the preliminary results of in vivo CESL imaging of human knee cartilage at 3.0T.Methods
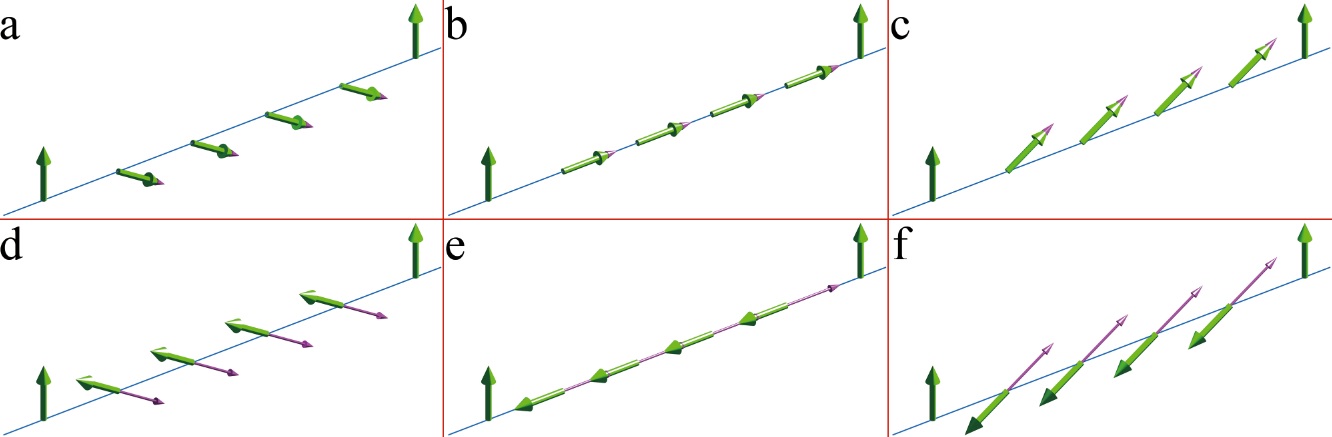
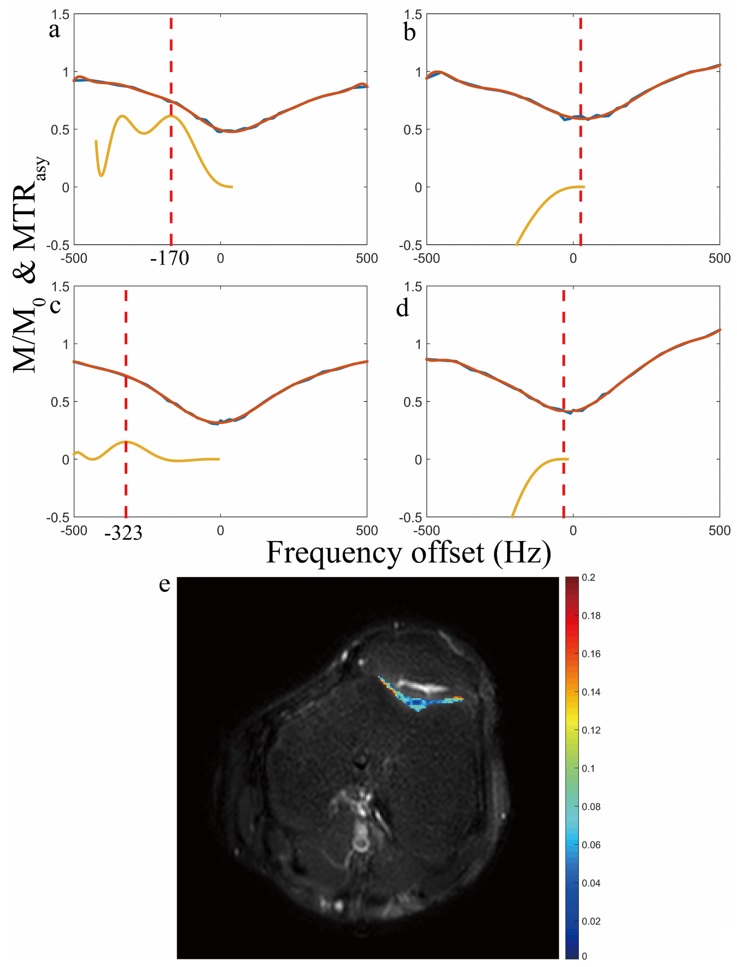
Conventionally, the pulse clusters of CESL consist of a hard pulse to flip magnetization along the effective spin-lock field, followed by a constant amplitude spin-lock RF pulse, and then a hard pulse to flip magnetization back to longitudinal direction. The hard excitation pulse flips the magnetization to the following orientation with the presence of frequency offset (FO) $$$\triangle\omega\left(r\right)$$$:$$\theta(r)=\begin{cases}\arctan(\frac{\omega sl(r)}{\triangle\omega(r)}), & \triangle\omega(r) \geq 0,parallel\\\arctan(\frac{\omega sl(r)}{\triangle\omega(r)})-\pi, & \triangle\omega(r) \geq 0,anti-parallel \\\arctan(\frac{\omega sl(r)}{\triangle\omega(r)})+\pi, & \triangle\omega(r)<0,parallel\\\arctan(\frac{\omega sl(r)}{\triangle\omega(r)}), & \triangle\omega(r)<0,anti-parallel\end{cases}$$where $$$\omega sl(r)$$$ is the frequency of spin-lock (FSL). Figure 1 illustrates the orientation of spins and the effective spin-lock field during the spin-lock for parallel and anti-parallel scenarios. It has been observed that the spin-lock direction can affect T1rho quantification in in vivo experiments.3 In this work, we used simulation and experimental studies to understand the effect of spin-lock direction on quantification of chemical exchange using CESL. Simulations were performed using cartilage parameters. The magnetization transfer ratio (MTR) asymmetry (MTRasym) was calculated and displayed after being enlarged 40 times. Imaging data were acquired from a Philips Achieva TX 3.0T system. Phantom scan was performed to compare the image quality and artifact level of images acquired using anti-parallel and parallel spin-lock alignment at -300 Hz frequency offset. A 32-channel cardiac coil was used as the receiver for phantom scan. In vivo knee data sets were acquired using an eight-channel T/R knee coil (Invivo Corp, Gainesville, USA). 2D Fast Spin Echo is used for imaging data acquisition. The acquisition parameters include: resolution 1mm x 1mm, slice thickness 5mm, TR/TE 2000/16ms, and spin-lock frequency 200Hz. CESL was performed at resonance offsets same as the simulation. For negative frequency offsets, parallel (P) and anti-parallel (A) spin-lock were performed, respectively. For positive frequency offsets, only parallel spin-lock was performed. The region of interest (ROI) was drawn on patella cartilage and muscle. For both simulation and in vivo data, an order of 12 polynomial fitting was used to fit the z-spectrum and the MTRasym corresponds to the chemical shift of –OH group of glycosaminoglycan (GAG) was calculated, and displayed after being enlarged 10 times.
Results
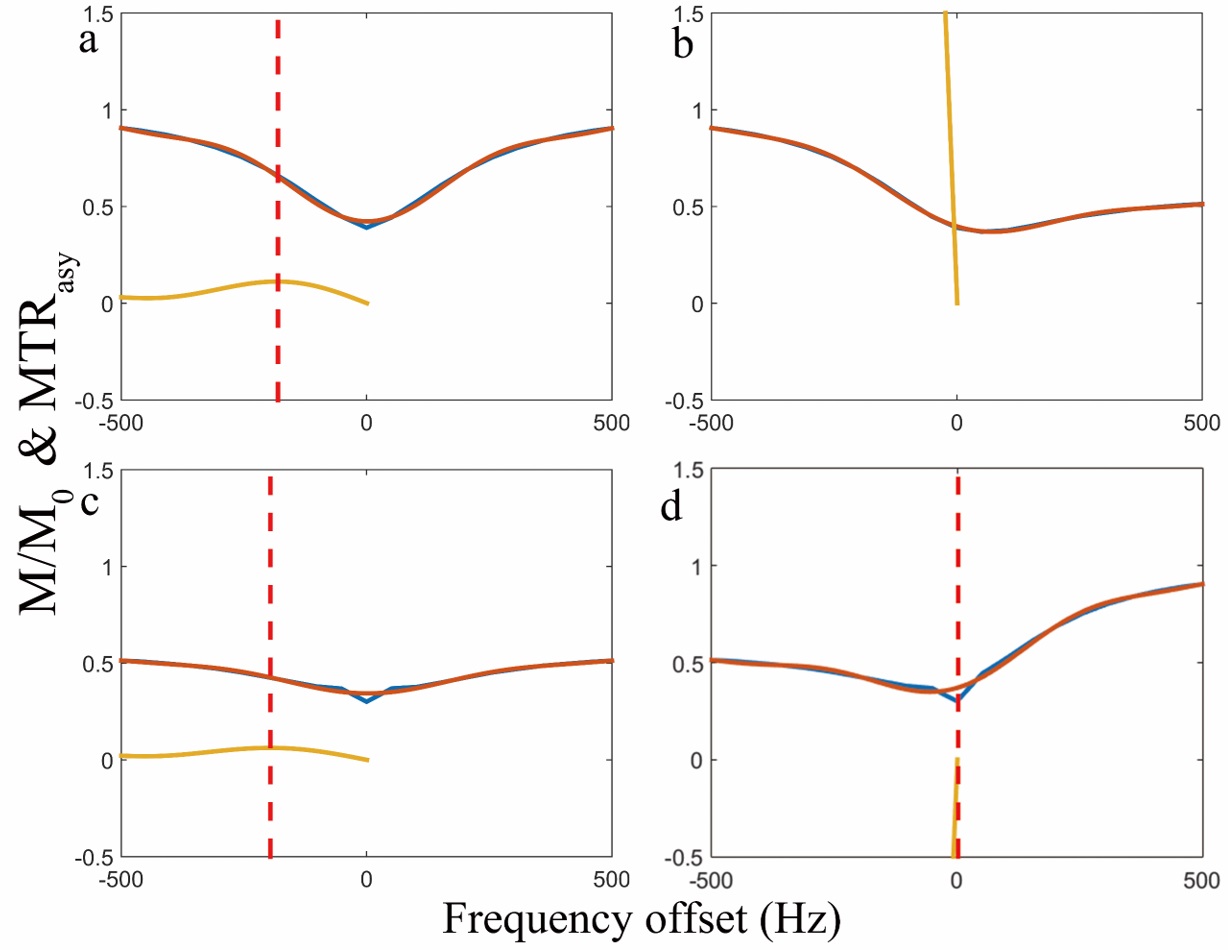
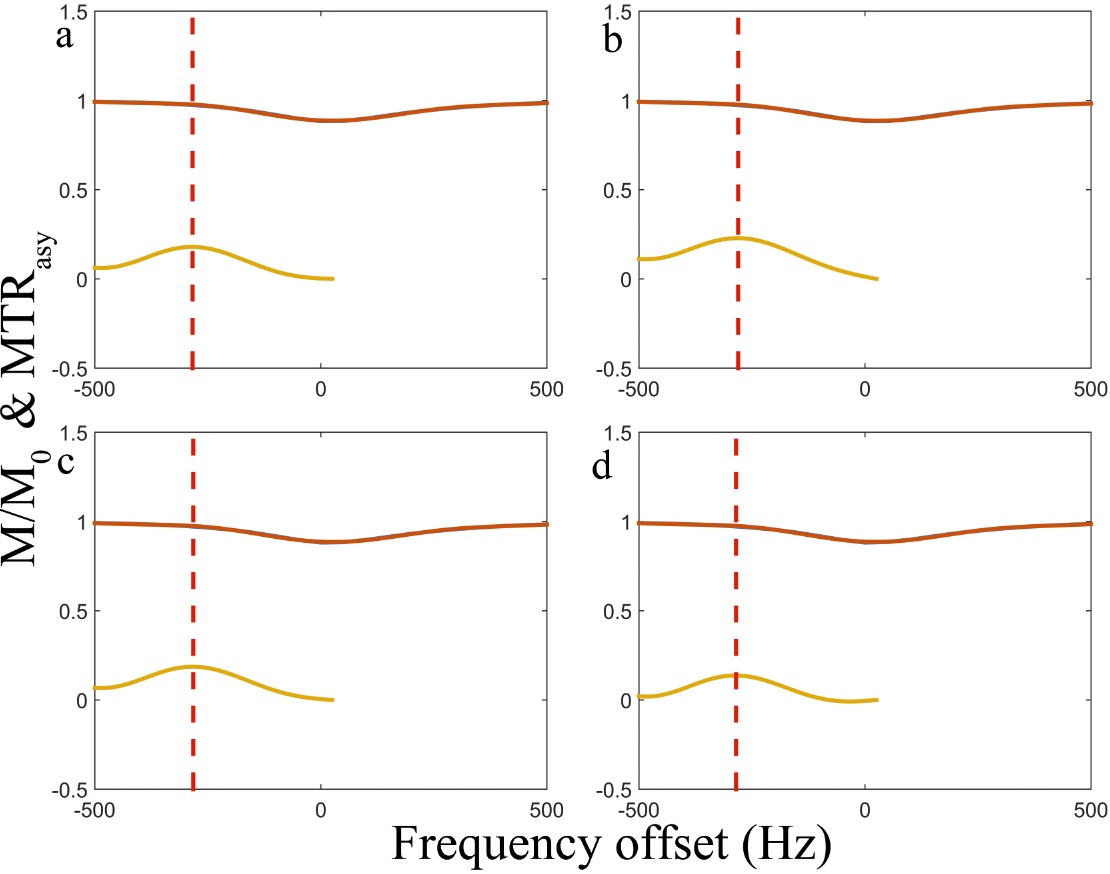
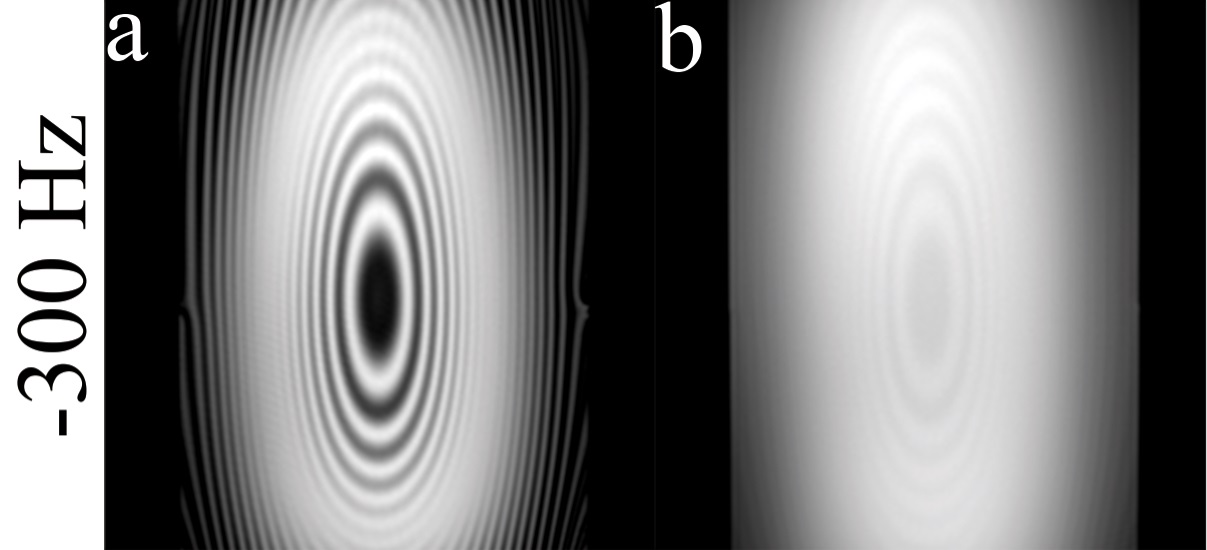
Figure 2 shows the simulation results. Note that the spin-lock direction indeed affects the CESL z-spectrum. Only AP and PA spin-lock are able to detect chemical exchange signal. Figure 3 shows the repeated simulation results of figure 2, but T1 and T2 were set to a very large value. Note all four different spin-lock directions give similar z-spectrum and MTRasym, indicating the noticed errors when using PP or AA spin-lock is likely due to relaxation effect. Figure 4 shows the phantom results. Note anti-parallel spin-lock results in lesser image artifact compared to parallel spin-lock. Figure 5 shows the in vivo results. Both cartilage and muscle result in reasonable MTRasym under AP spin-lock. However, MTRasym with PP spin-lock failed in both regions.Discussion and Conclusion
MTR asymmetry requires the non-chemical exchange related signal to be symmetrical at the reference water point. However, RF pulse which flips magnetization into parallel or anti-parallel spin-lock can have different pulse duration, which may introduce adversary relaxation effect to distort the z-spectrum and cause errors in MTRasym analysis. Since hydroxyl-water exchange of GAG falls into the intermediate to fast exchange regime at 3.0T, higher field strength is preferred when using CEST to detect GAG. In this work, we provided preliminary in vivo results of CESL to detect hydroxyl-water exchange of GAG in knee cartilage at 3.0T. Reliable detection of GAG at 3.0T has important clinical applications. Further investigation is necessary to understand the clinical potential of CESL for these applications.Acknowledgements
This study is supported by the grant from the Research Grants Council of the Hong Kong SAR (Project No. SEG CUHK02).References
1. Jin T, Autio J, Obata T, Kim S-G. Spin-locking versus chemical exchange saturation transfer MRI for investigating chemical exchange process between water and labile metabolite protons. Magnetic Resonance in Medicine. 2010;65(5):1448-1460. doi:10.1002/mrm.22721.
2. Jin T, Kim S-G. Advantages of chemical exchange-sensitive spin-lock (CESL) over chemical exchange saturation transfer (CEST) for hydroxyl- and amine-water proton exchange studies. NMR in Biomedicine. 2014;27(11):1313-1324. doi:10.1002/nbm.3191.
3. Yee S, Gao J-H. Effects of spin-lock field direction on the quantitative measurement of spin-lattice relaxation time constant in the rotating frame (T1ρ) in a clinical MRI system. Medical Physics. 2014;41(12):122301. doi:10.1118/1.4900607.
Figures