1389
T1-T2 correlation of site-specific changes and zone-dependent anisotropy of osteoarthritic cartilage using multi-resolution MRI1Physics, Oakland University, Rochester Hills, MI, United States
Synopsis
Topographical and zonal based studies of healthy and OA canine tibial cartilage are shown to be essential for the early detection of osteoarthritis. A high-resolution T1-T2 correlation with the low-resolution imaging of depth-dependent T2 profiles shows a more detailed and sensitive method of measuring the early sign of cartilage degradation, beneficial to human OA MRI.
Introduction
Osteoarthritis (OA) is a debilitating disease, which alters the macromolecular composition (glycosaminoglycan) and structural integrity (collagen) of articular cartilage, together with the swelling (influx of water) in the joint. These disease changes are detectable by MRI relaxometry1 (T2, T1), which are site (i.e., location) and zonal specific2. By implementing a histological based method of zonal analysis on a low-resolution T2 map, we show the ability to quantify the complex site-specific depth-dependent relationships between healthy to OA cartilage, using high- and low-resolution relaxation images. We aim to study the topographical and zonal changes from healthy to mild (contralateral) and severe (ACL transected) cartilage joints in canines using microscopic and low-resolution MRI.Methods
Twelve intact normal (N) canine knee joints were compared to contralateral (C) and osteoarthritis (OA) (six each). Using a 7 Tesla/20cm MRI system, T2 Maps of the intact joint were constructed at 100µm/pixel. From the medial tibia, T2 profiles of five topographical locations (Anterior – AMT, Exterior – EMT, Posterior – PMT, Central – CMT and Internal – IMT; i.e. sites) were subdivided into three histological zones (3); superficial zone (SZ), transitional zone (TZ) and radial zone (RZ), with the radial zone further divided into two equal halves (RZ-I, RZ-II). After harvesting the individual cartilage-bone blocks from the five topographical sites, T2 (at 0º and 55º from B0) and T1 (55º) images (soaked in gadolinium, Gd) were constructed for each specimen at ~ 20 µm/pixel using a 7 Tesla/9 cm µMRI Bruker system.Results
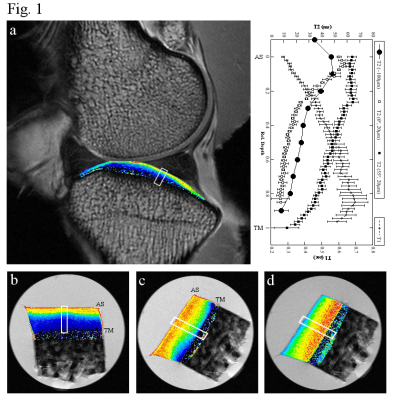
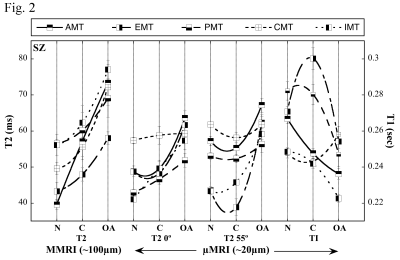
The low-resolution (100 µm/pixel) MRI T2 map (Fig.1a) of a healthy tibia is compared with the microscopic resolution (20µm/pixel) µMRI T2 (0º (b) and 55º (c)) and µMRI T1 (d) of cartilage from the nearly identical tibial location. The depth-dependent profiles, from the selected ROI (Fig.1a - d), showed the resolution differences between the macroscopic and microscopic MRI of cartilage due to tissue heterogeneity and magic angle effect. By comparing the topographical and zonal changes from healthy to OA, a statistical difference is found in the disease progression from site to site. The T2 profiles are shown to follow an inverse trend to the T1 profile, confirming that the decrease in GAG (T1-Gd) can result in an increase of T2. The T2-T1 correlation plots (Fig. 2) showed that SZ of the AMT site had a linear decrease in T1 from healthy (N) to OA cartilage, signifying the loss of GAG, and correlated well with the increasing T2 data in both Macro-MRI and µMRI (0º and 55º). This analysis is also zonal specific (not shown), with each of the five topographical sites showing different OA progression with respect to the tissue thickness. The SZ of the CMT site showed minimal changes in T1 from healthy to OA, which is also confirmed with the equivalent µMRI T2 data, but was different from the low-resolution T2 data where there is clearly a T2 increase from healthy to OA.Discussion
The µMRI T1-T2 correlation together with the low-resolution T2 data provides a better understanding of the site- and zone-based changes in cartilage due to mild and severe OA. The T1 decrease and the T2 increase correlate well with the GAG loss and the reduction of the collagen integrity, which are also influenced by the joints topographical inhomogeneity and tissue heterogeneity.Conclusion
Most clinical MRI studies of OA have an averaged and unspecified orientational measure between healthy and OA cartilage2 due to the lack of sufficient resolution, which consequently reduces the sensitivity of clinical MRI in OA diagnosis. A comparative study of high-resolution T2 and T1 correlation can further justify the low-resolution T2 changes from healthy to OA cartilage only when a site-specific histological zonal division of the tissue is implemented3. Since the goal of OA study is to determine the earliest stage of degradation, a topographical and histological zonal division of cartilage would be beneficial to any clinical based study.Acknowledgements
The authors are grateful to Dr. James R Ewing and Dr. Gary Ding (Henry Ford Hospital, Detroit) for their assistance and access to the 7T/20 cm MRI system. The authors thank NIH for the R01 grants (AR052353, AR069047).References
1. Mailhiot SE, Williamson NH ,Brown JR, et al. T1–T2 Correlation and Biopolymer Diffusion Within Human Osteoarthritic Cartilage Measured with Nuclear Magnetic Resonance. App Magn Reson 2017;48(4):407.
2. Kurkijarvi JE, Nissi MJ, Kiviranta I, et al. Delayed Gadolinium-Enhanced MRI of Cartilage (dGEMRIC) and T2 Characteristics of Human Knee Articular Cartilage: Topographical Variation and Relationships to Mechanical Properties. Magn Reson Med 2004;52(1):41-6.
3. Badar F, Xia Y. Image interpolation improves the zonal analysis of cartilage T2 relaxation in MRI. Quant Imaging Med Surg 2017;7(2):227-37.
Figures

