1388
Analysis of Knee Cartilage using Magnetization Transfer and Multi-exponential T2* Fitting1Department of Electrical and Computer Engineering, Seoul National University, Seoul, Republic of Korea, 2Department of Biomedical Engineering, Hankuk University of Foreign Studies, Seoul, Republic of Korea, 3Department of Radiology, Research Institute of Radiological Science, Yonsei University College of Medicine, Seoul, Republic of Korea
Synopsis
In this study, we explored the combined use of magnetization transfer (MT) weighting and bi-exponential T2* fitting as a potential tool to analyze the composition and microscopic geometry of the knee cartilage. The analysis results of deep cartilage areas showed that the MT ratio of the short T2* component had significantly larger values than that of the long T2* component. This observation may be explained by the geometry of collagen fibrils and proteoglycans.
Purpose
Knee cartilage composition changes in early stage osteoarthritis before apparent morphologic changes occur. Thus, many approaches have been explored to estimate the composition and structure of knee cartilage noninvasively using MRI. In particular, multi-exponential fitting of T2 using mcDESPOT and T2-prep sequences 1,2, bi-exponential fitting of T2* using an UTE sequence 3, and MT-weighted imaging 4 have been applied to explore the structure and composition of the knee cartilage. These works have reported depth and regional-dependent variations in the multi-component parameters, which corresponded well with the microstructure of the knee cartilage. So far, however, no study has explored the effects of MT weighting in bi-exponential fitting. In this study, we developed an approach of the combined use of MT and bi-exponential fitting of T2* as a tool to explore the composition and microscopic geometry of the knee cartilage.Methods
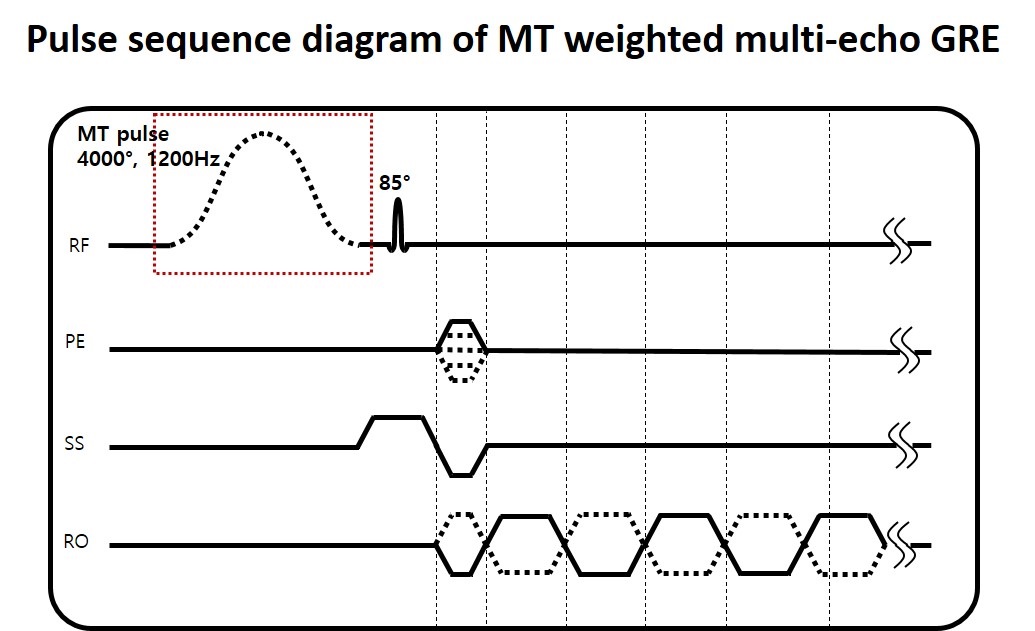
A multi-echo GRE sequence was modified to acquire data with and without MT weighting (Figure 1). The scan parameters were FOV = 90×150 mm2, voxel size = 0.4×0.8 mm2, slice thickness = 2 mm, TR = 3000 ms, TE = 3.2:2.5:80.7 ms, bipolar readout gradient, MT pulse duration = 50 ms, MT pulse flip angle = 4000°, and MT offset = 1200 Hz. The data acquisition was repeated with and without MT pulses. For each condition, data were acquired twice with the opposite polarity readout gradient. This approach of acquiring and averaging the opposite polarity readout gradients cancels out eddy current artifacts in the bipolar readout while keeping the benefit of the short echo spacing5. Three healthy subjects were scanned at 3T.
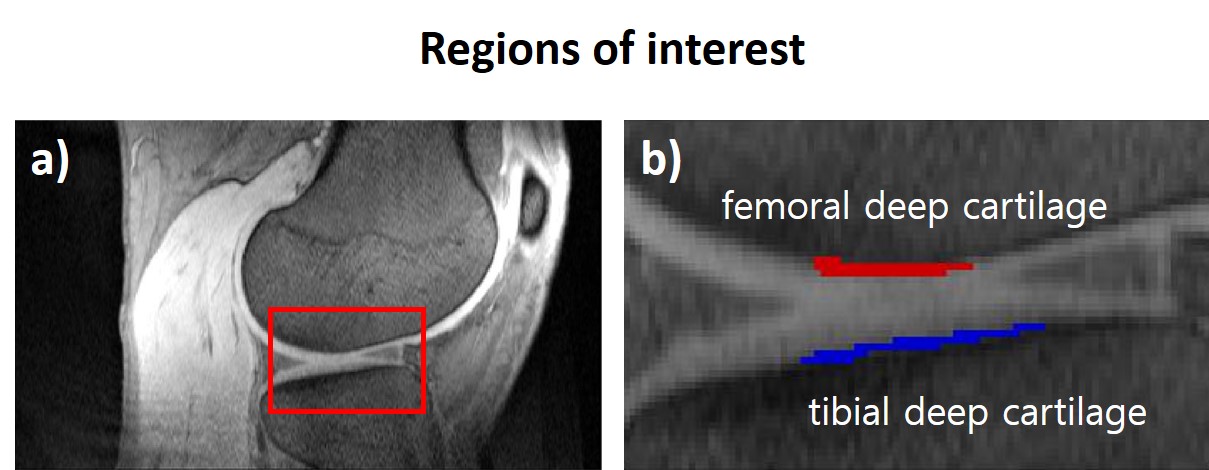
Tibial and femoral deep cartilage regions that are known to have high percentage of short T2* component 3 were selected as ROIs (Figure 2). The ROI-averaged signals were fitted to a mono-exponential model and a bi-exponential model. To improve the exponential fitting, SQEXP fitting method 6 was employed.
The MT ratio of each ROI-averaged signal was calculated for the short T2* signal and the long T2* signal, and averaged over the three subjects.
Results
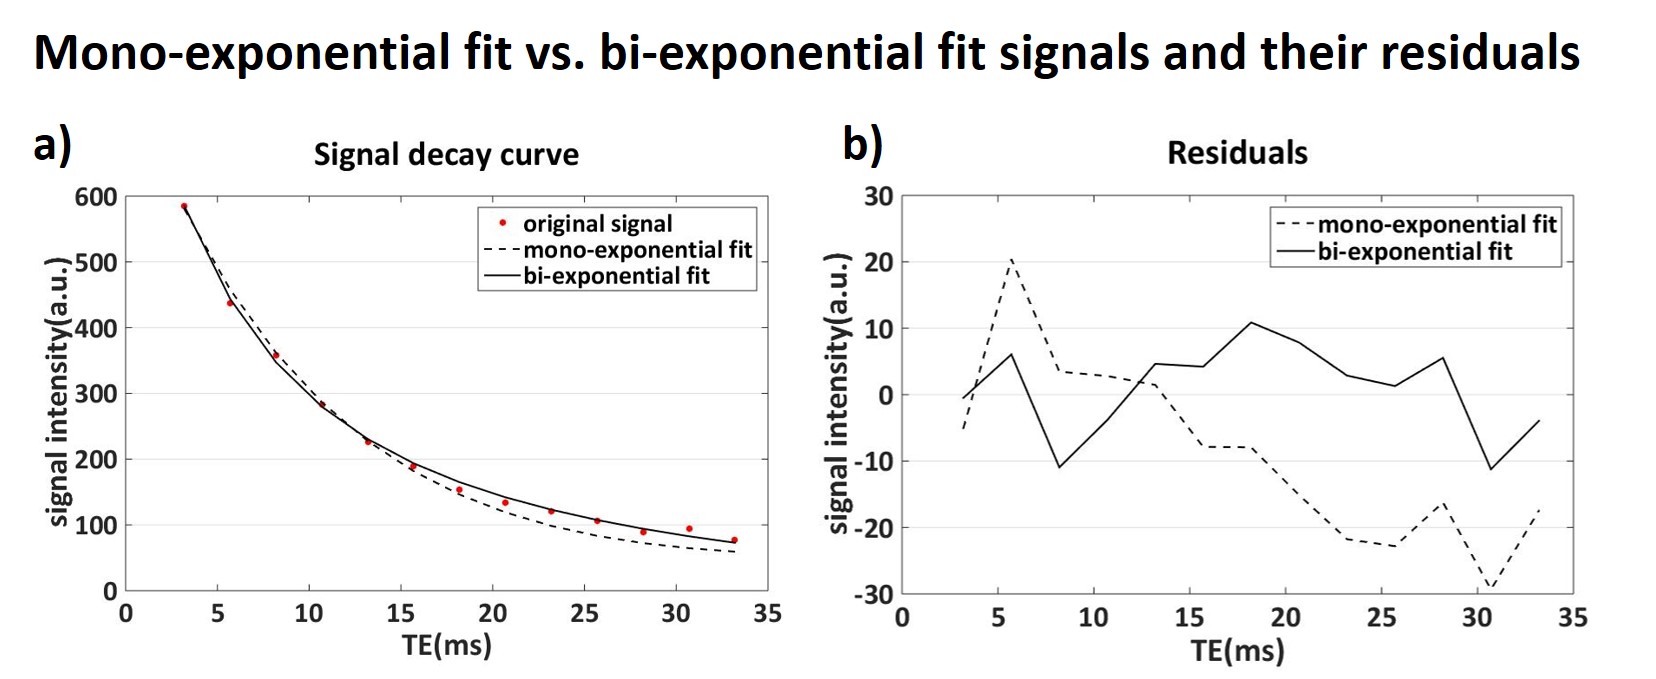
The measured GRE signal, mono-exponential fitted curve, and bi-exponential fitted curve from the tibial deep cartilage ROI are shown in Figure 3a and the residuals are shown in Figure 3b. The mean squared error of the bi-exponential fit was 44.1 (adjusted R2 = 0.999), while that of the mono-exponential fit was 249 (adjusted R2 = 0.996). These results suggest that the signal decay in the ROI is explained better with the bi-exponential model than the mono-exponential model, agreeing with the previous studies 1-3.
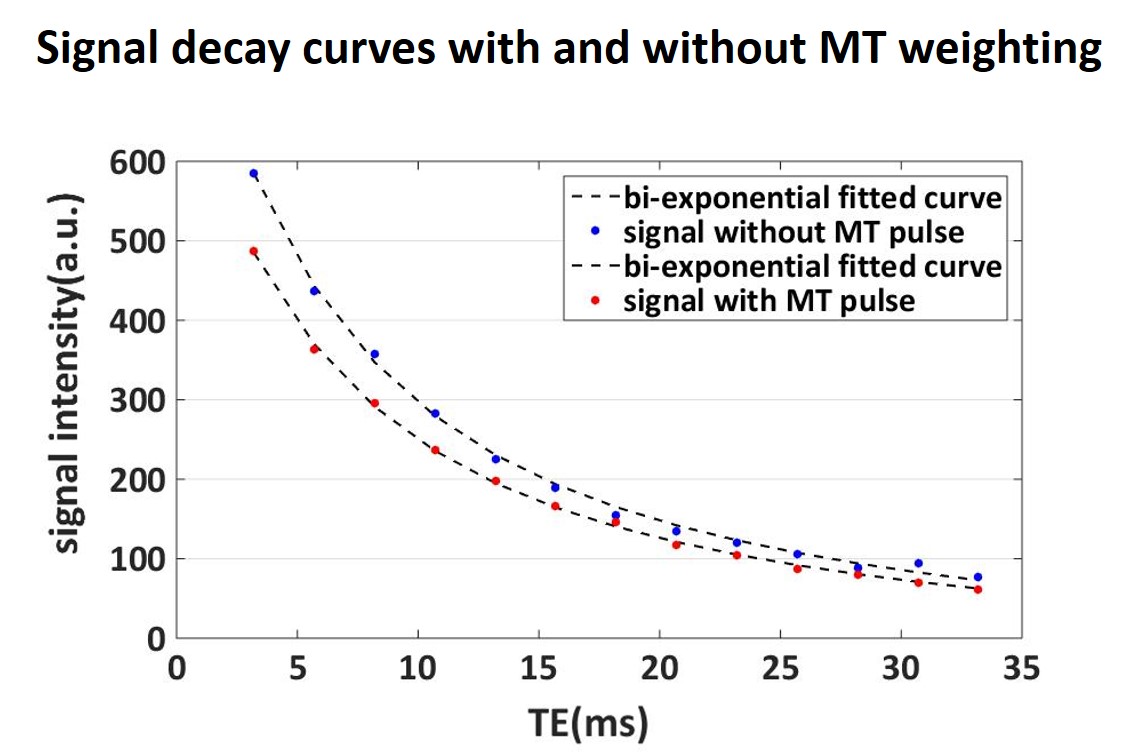
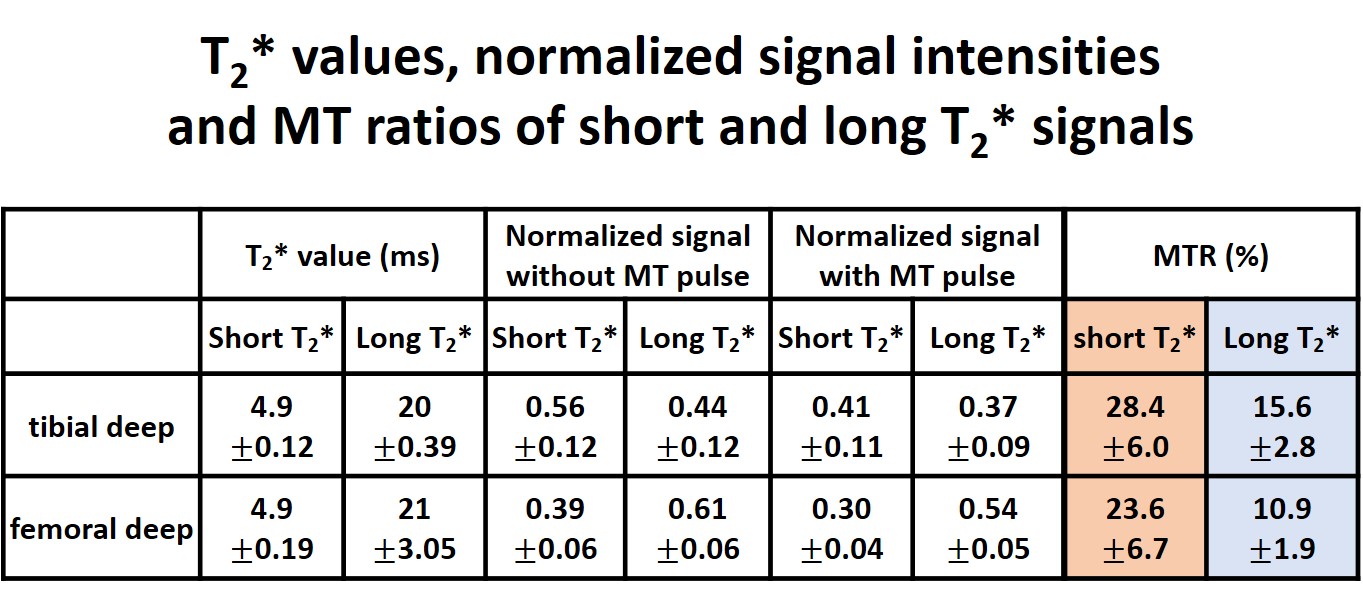
Figure 4 shows the measured signals and bi-exponential fitted curves of the same ROI with and without MT weighting. The MT pulse induced sufficient reduction in the signal. The T2* values, normalized signal intensities (normalized to total signal without MT pulse), and MT ratios of the short and long T2* signals are summarized in Table 1 (averaged over all subjects). The T2* values of short T2* component was substantially shorter than that of the long T2* component (Table 1). The signal fraction of the short T2* component was similar to that of the long T2* component (Table 1). The MT ratios of the short T2* signals were 28.4% for tibial deep ROI and 23.6% for femoral deep ROI. These values are significantly higher than those of the long T2* signals, which were 15.6% and 10.9%.
Conclusion and Discussion
In this work, we developed an approach of the combined use of MT weighting and bi-exponential T2* mapping as a tool to explore the composition and microscopic geometry of the knee cartilage. Bi-exponential signal decay was detected using the short echo spacing GRE sequence. This result corresponds well with the microscopic geometry of the deep cartilage, which is known to have abundant proteoglycan 7. Proteoglycan bound water is the source of the short T2* signal, suggesting that proteoglycan, which undergoes depletion in early OA, is a sensitive and specific biomarker for cartilage in early OA.
The MT ratio of the short T2* signal component was significantly higher than that of the long T2* component signal in both ROIs. This result may be explained by the geometry of knee cartilage extracellular matrix. Previous studies suggested that MT effect in cartilage is primarily caused by collagen fibers 8,9. Because proteoglycans are electrostatically bound to the collagen fibrils by the chondroitin sulfate side chains 7, proteoglycan bound water is closer to the collagen fibrils than bulk water. Thus, bounded water in proteoglycan, which is the source of short T2* signal, may experience larger MT effect than bulk water.
Acknowledgements
“This work was supported by the Brain Korea 21 Plus Project in 2017.”References
1. Liu F, Choi KW, Samsonov A, Spencer RG, Wilson JJ, Block WF, Kijowski R. Articular Cartilage of the Human Knee Joint: In Vivo Multicomponent T2 Analysis at 3.0 T. Radiology 2015;277(2):477-488.
2. Sharafi A, Chang G, Regatte RR. Biexponential T2 relaxation estimation of human knee cartilage in vivo at 3T. J Magn Reson Imaging 2017.
3. Qian Y, Williams AA, Chu CR, Boada FE. Repeatability of ultrashort echo time-based two-component T2* measurements on cartilages in human knee at 3 T. Magn Reson Med 2013;69(6):1564-1572.
4. Wolff SD, Chesnick S, Frank JA, Lim KO, Balaban RS. Magnetization transfer contrast: MR imaging of the knee. Radiology 1991;179(3):623-628.
5. Yu H, Shimakawa A, McKenzie CA, Lu W, Reeder SB, Hinks RS, Brittain JH. Phase and amplitude correction for multi-echo water-fat separation with bipolar acquisitions. J Magn Reson Imaging 2010;31(5):1264-1271.
6. Raya JG, Dietrich O, Horng A, Weber J, Reiser MF, Glaser C. T2 measurement in articular cartilage: impact of the fitting method on accuracy and precision at low SNR. Magn Reson Med 2010;63(1):181-193.
7. An YH, Martin KL. Handbook of histology methods for bone and cartilage. Totowa, NJ: Humana Press; 2003. xviii, 587 p. p.
8. Kim DK, Ceckler TL, Hascall VC, Calabro A, Balaban RS. Analysis of water-macromolecule proton magnetization transfer in articular cartilage. Magn Reson Med 1993;29(2):211-215.
9. Gray ML, Burstein D, Lesperance LM, Gehrke L. Magnetization transfer in cartilage and its constituent macromolecules. Magn Reson Med 1995;34(3):319-325.
Figures