1387
T1 Relaxation Time Mapping of Articular Cartilage for Femoroacetabular Impingement (FAI) - A Clinical Pilot StudyJutta Ellermann1, Douglas Martin2, Casey P Johnson3, Robert Gao4, Luning Wang1, and Patrick Morgan5
1Radiology, CMRR, University of Minnesota, Minneapolis, MN, United States, 2Radiology, Stanford University, Palo Alto, CA, United States, 3Radiology, University of Minnesota, Minneapolis, MN, United States, 4University of Minnesota, Minneapolis, MN, United States, 5Orthopaedics, University of Minnesota, Minneapolis, MN, United States
Synopsis
In this pilot study we demonstrate the clinical utility of quantitative T1 relaxation time mapping to assess acetabular cartilage damage in patients with Femoroacetabular Impingement (FAI).
INTRODUCTION:
Femoroacetabular impingement (FAI) is a common cause of hip pain in young adult patients and a cause of premature osteoarthritis 1-2. In FAI, abnormal joint morphology leads to recurrent pathologic abutment that results in a known pattern of cartilage wear in the anterosuperior acetabulum3 where the abnormal contact takes place during motion. Using Gold Standard Arthroscopic correlation it was previously confirmed in two independent patient cohorts that T2* relaxation maps accurately identified and graded cartilage damage 4-5 in the anterosuperior aspect of the acetabulum when compared to arthroscopically proven normal cartilage in the posterior control area. With the clinical availability of new T1 mapping techniques that are significantly faster 6-7, we hypothesize in this pilot study that T1 relaxation time mapping could serve as a viable alternative or complement to T2* mapping for noninvasive and quantitative assessment of acetabular cartilage damage in young patients with the clinical diagnosis of FAI.METHODS:
Subjects: The institutional review board approved this study, HIPAA compliance was maintained throughout. We identified consecutive patients with a clinical and radiographic diagnosis of femoroacetabular impingement (FAI) who had undergone clinical 3T MRA utilizing commercially available quantitative T1 and T2* mapping sequences. A total of 28 patients with 31 hip MRIs met the inclusion criteria, 21 women and 7 men, with an average age of 31.2 years. Imaging Parameters: The FAI patients were scanned using a 3T MRI system (Magnetom Skyra; Siemens Medical Solutions; Erlangen, Germany). A 3D variable flip angle FLASH sequence was used for T1 mapping: FOV = 14 x 16 cm; in-plane sampling matrix = 384x307; 3 mm slice thickness; TR/TE = 15/2.47 ms; and flip angles = 5 and 26 degrees. T2* was quantified using a multi-echo FLASH sequence: slice thickness = 3 mm; resolution = 0.52 x 0.52 mm2, interpolated to 0.26 x 0.26 mm; TR/TE = 1040/4.2, 11.3, 18.4, 25.6, 32.74. T1 and T2* maps were generated inline using vendor-provided MapIt software. Data and Statistical Analysis: The T1 and T2* maps were analyzed using the image processing software Osirix (Osirix v.4.1.1; 32 bit; http://www.osirix-viewer.com) 4,8. In keeping with previously arthroscopically verified locations of damaged anterosuperior (Fig. 1) and normal control posterior acetabular cartilage, 4-5 ROIs were defined for these two regions. For both the T1 and T2* maps, the differences between patients’ damaged and control cartilage ROI relaxation times were compared using paired t-tests, with p<0.05 considered significant. The primary analysis was to compare cartilage damage and control ROIs. A secondary analysis was then performed by comparing ROIs on a slice-by-slice basis to test if there were any significant differences based on the location of the chosen slice (medial or lateral).RESULTS:
There was a statistically significant decrease in the T1 value between the anterosuperior (damaged) and posterior (control) areas of cartilage (p=1.02*10-6) with an average decrease in T1 of 8.9% for the cohort, Figures 2,3. There was no significant inter-slice difference in the control or pathologic T1 groups (comparing medial to lateral). Consistent with previous work, there was a significant decrease in the T2* value between the anterior (damaged) and posterior (control) acetabular cartilage ROIs (p=1.8*10-10) with an average decrease of 9.5% for the cohort. Among the controls, there was no significant inter-slice difference in the T2* values.DISCUSSION:
With the advent of rapid quantitative T1 protocols, there is renewed interest in T1 mapping of articular cartilage. In the currently accepted theory, repetitive trauma by the impinging bony prominence at the femoral head neck junction leads to repetitive cycles of cartilage injury and repair2. Histologically, these damaged areas of hyaline articular cartilage do transform into fibrocartilage in a manner akin to the recovery of cartilage following microfracture procedures9-10. This would result in an overall decrease in the water content and a corresponding decrease in T1 signal intensity due to the structural differences between hyaline and fibrocartilage. Histology also shows that the fibrocartilage demonstrates mineralization10. These effects could explain the observed changes in the T1 relaxation and can serve as a basis for future work. In agreement with prior studies, we observed a consistent decrease in the T2* values in areas of acetabular cartilage subject to early degeneration in FAI patients compared to unaffected areas4-5. In conclusion, T1 mapping provides another noninvasive tool to probe the health of articular cartilage and may provide complementary information in the pre-surgical assessment of acetabular cartilage damage in FAI. Continued development and validation of T1 mapping is imperative given their potential prognostic and diagnostic value.Acknowledgements
This study was supported in part by institutional funds of the Department of Radiology, University of Minnesota.References
1. Ganz R, Parvizi J, Beck M, Leunig M, Nötzli H, Siebenrock KA. Femoroacetabular impingement: A cause for osteoarthritis of the hip. Clin Orthop Relat Res 2003;417:112-20. 2. Ganz R, Leunig M, Leunig-Ganz K, Harris WH. The etiology of osteoarthritis of the hip: An integrated mechanical concept. Clin Orthop Relat Res 2008, Feb;466(2):264-72. 3. Beck M, Kalhor M, Leunig M, Ganz R. Hip morphology influences the pattern of damage to the acetabular cartilage: Femoroacetabular impingement as a cause of early osteoarthritis of the hip. J Bone Joint Surg Br 2005, Jul;87(7):1012-8. 4. Ellermann J, Ziegler C, Nissi MJ, Goebel R, Hughes J, Benson M, et al. Acetabular cartilage assessment in patients with femoroacetabular impingement by using T2* mapping with arthroscopic verification. Radiology 2014, May;271(2):512-23. 5. Morgan P, Nissi MJ, Hughes J, Mortazavi S, Ellerman J. T2* Mapping Provides Information That Is Statistically Comparable to an Arthroscopic Evaluation of Acetabular Cartilage. Cartilage. 2017:1947603517719316. 6. Andreisek G, White LM, Yang Y, Robinson E, Cheng HL, Sussman MS. Delayed gadolinium-enhanced MR imaging of articular cartilage: Three-dimensional T1 mapping with variable flip angles and B1 correction. Radiology 2009, Sep;252(3):865-73. 7. Wang L, Schweitzer ME, Padua A, Regatte RR. Rapid 3D-T(1) mapping of cartilage with variable flip angle and parallel imaging at 3.0T. J Magn Reson Imaging 2008, Jan;27(1):154-61. 8. Rosset A, Spadola L, Ratib O. OsiriX: An open-source software for navigating in multidimensional DICOM images. J Digit Imaging 2004, Sep;17(3):205-16. 9. Bittersohl B, Miese FR, Hosalkar HS, Herten M, Antoch G, Krauspe R, Zilkens C. T2* mapping of hip joint cartilage in various histological grades of degeneration. Osteoarthritis Cartilage 2012, Jul;20(7):653-60. 10. Kohl S, Hosalkar HS, Mainil-Varlet P, Krueger A, Buechler L, Siebenrock K. Histology of damaged acetabular cartilage in symptomatic femoroacetabular impingement: An observational analysis. Hip Int 2011;21(2):154-62.Figures
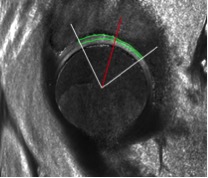
Region of interest (ROI): The
red line defines the 12 o’clock position, with the acetabular cartilage ROI
(green) anterior to this mark (12 o’clock to approximately 2 o’clock) defining
the area of damaged cartilage and the acetabular cartilage ROI (green)
posterior to this mark (approximately 10 o’clock to 12 o’clock) defining the
area of normal control cartilage.
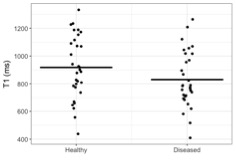
Figure 2 compares each T1
value obtained from the damaged and normal control ROIs of acetabular cartilage,
with the black bar representing the average for the cohort.
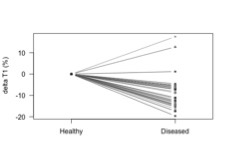
Figure 3 depicts the percent change in T1 (delta
T1) for each individual patient.