1386
Effect of Fat-contamination and Fat-suppression on T2 Quantitation of Knee Articular Cartilage In Vivo1Research Unit of Medical Imaging, Physics and Technology, University of Oulu, Oulu, Finland, 2Medical Research Center, University of Oulu and Oulu University Hospital, Oulu, Finland, 3Department of Applied Physics, University of Eastern Finland, Kuopio, Finland, 4Department of Diagnostic Radiology, Oulu University Hospital, Oulu, Finland
Synopsis
This study aims to investigate the effect of fat contamination and fat suppression (FS) on in vivo T2 mapping of knee cartilage. Four volunteers were imaged on a 3T MRI scanner and T2 values were calculated in several regions of tibiofemoral cartilage using
Introduction
T2 relaxation time mapping is a well establish technique to assess collagen structure and water content in articular cartilage.1-4 The presence of fat signal in knee MRI results in chemical shift (CS) artifacts affecting the accuracy of T2 quantitation in cartilage. The aim of the study was to investigate the effect of fat suppression on in vivo T2 mapping of knee articular cartilage.Methods
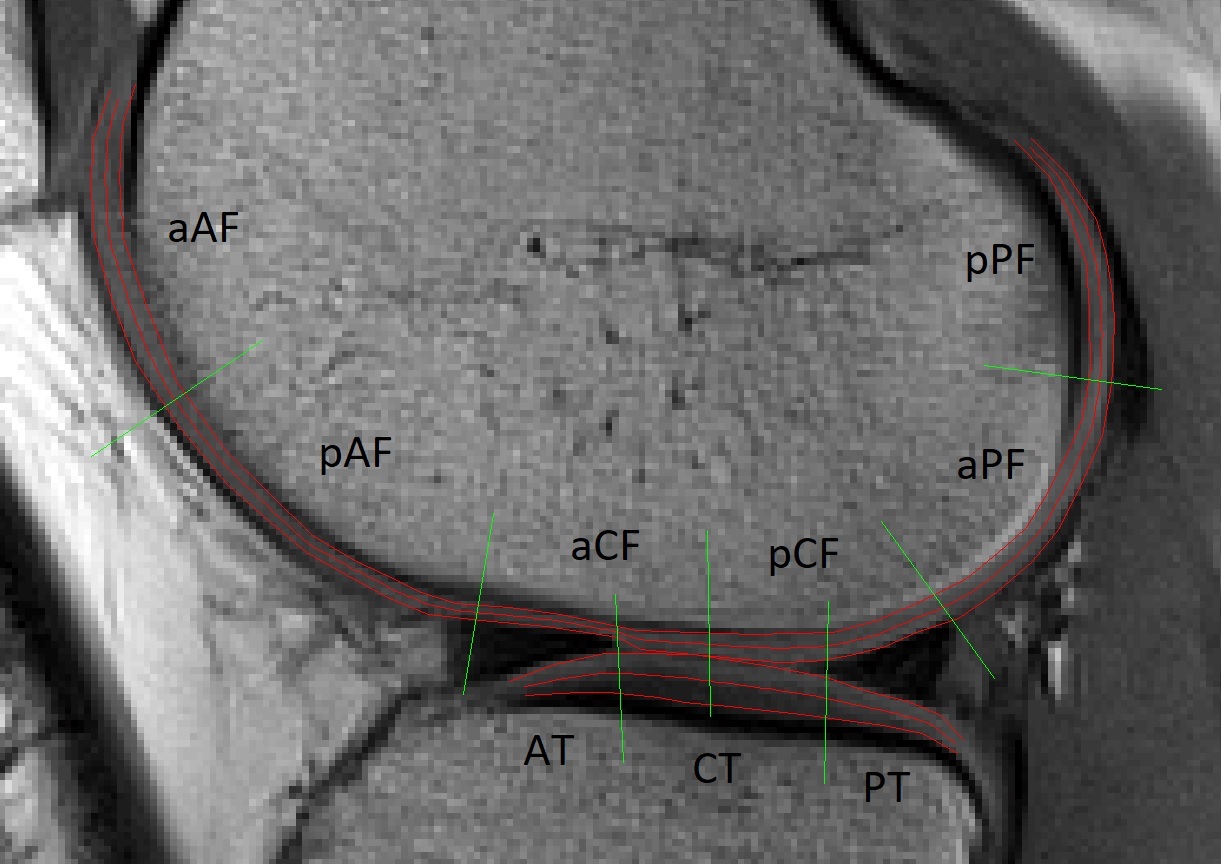
Four young asymptomatic volunteers underwent 3T MRI (Siemens Skyra) with a 15-channel knee coil. T2 mapping was performed using a multiecho spin-echo sequence (TR= 1680 ms, TE= 13.8, 27.6, 41.4, 55.2, 69 ms, ETL= 5, FOV= 160x160 mm2, matrix= 384x384, bandwidth= 200 Hz/pixel (fat-water shift = 2 pixel)). The T2 mapping was performed with fat suppression (FS) (CHESS5) and without FS (NoFS), using two frequency encoding directions: superior-inferior (SI) and inferior-superior (IS). Tibiofemoral cartilage from single sagittal slice (slice thickness = 3 mm) positioned in the lateral condyle was manually segmented. T2 values were computed offline by fitting a two-parameter mono-exponential function to T2 data pixel-by-pixel using in-house written Matlab scripts. Cartilage in femur and tibia was segmented into nine different regions of interest (ROIs), which were further split into two halves, superficial and deep layers (Fig. 1). Root-mean-square coefficients of variation (CVRMS) between the different measurements were calculated for each ROI. Segmentation repeatability of cartilage NoFS T2 and FS T2 was evaluated by determining the CVRMS of three separate segmentations in each evaluated subject.Results
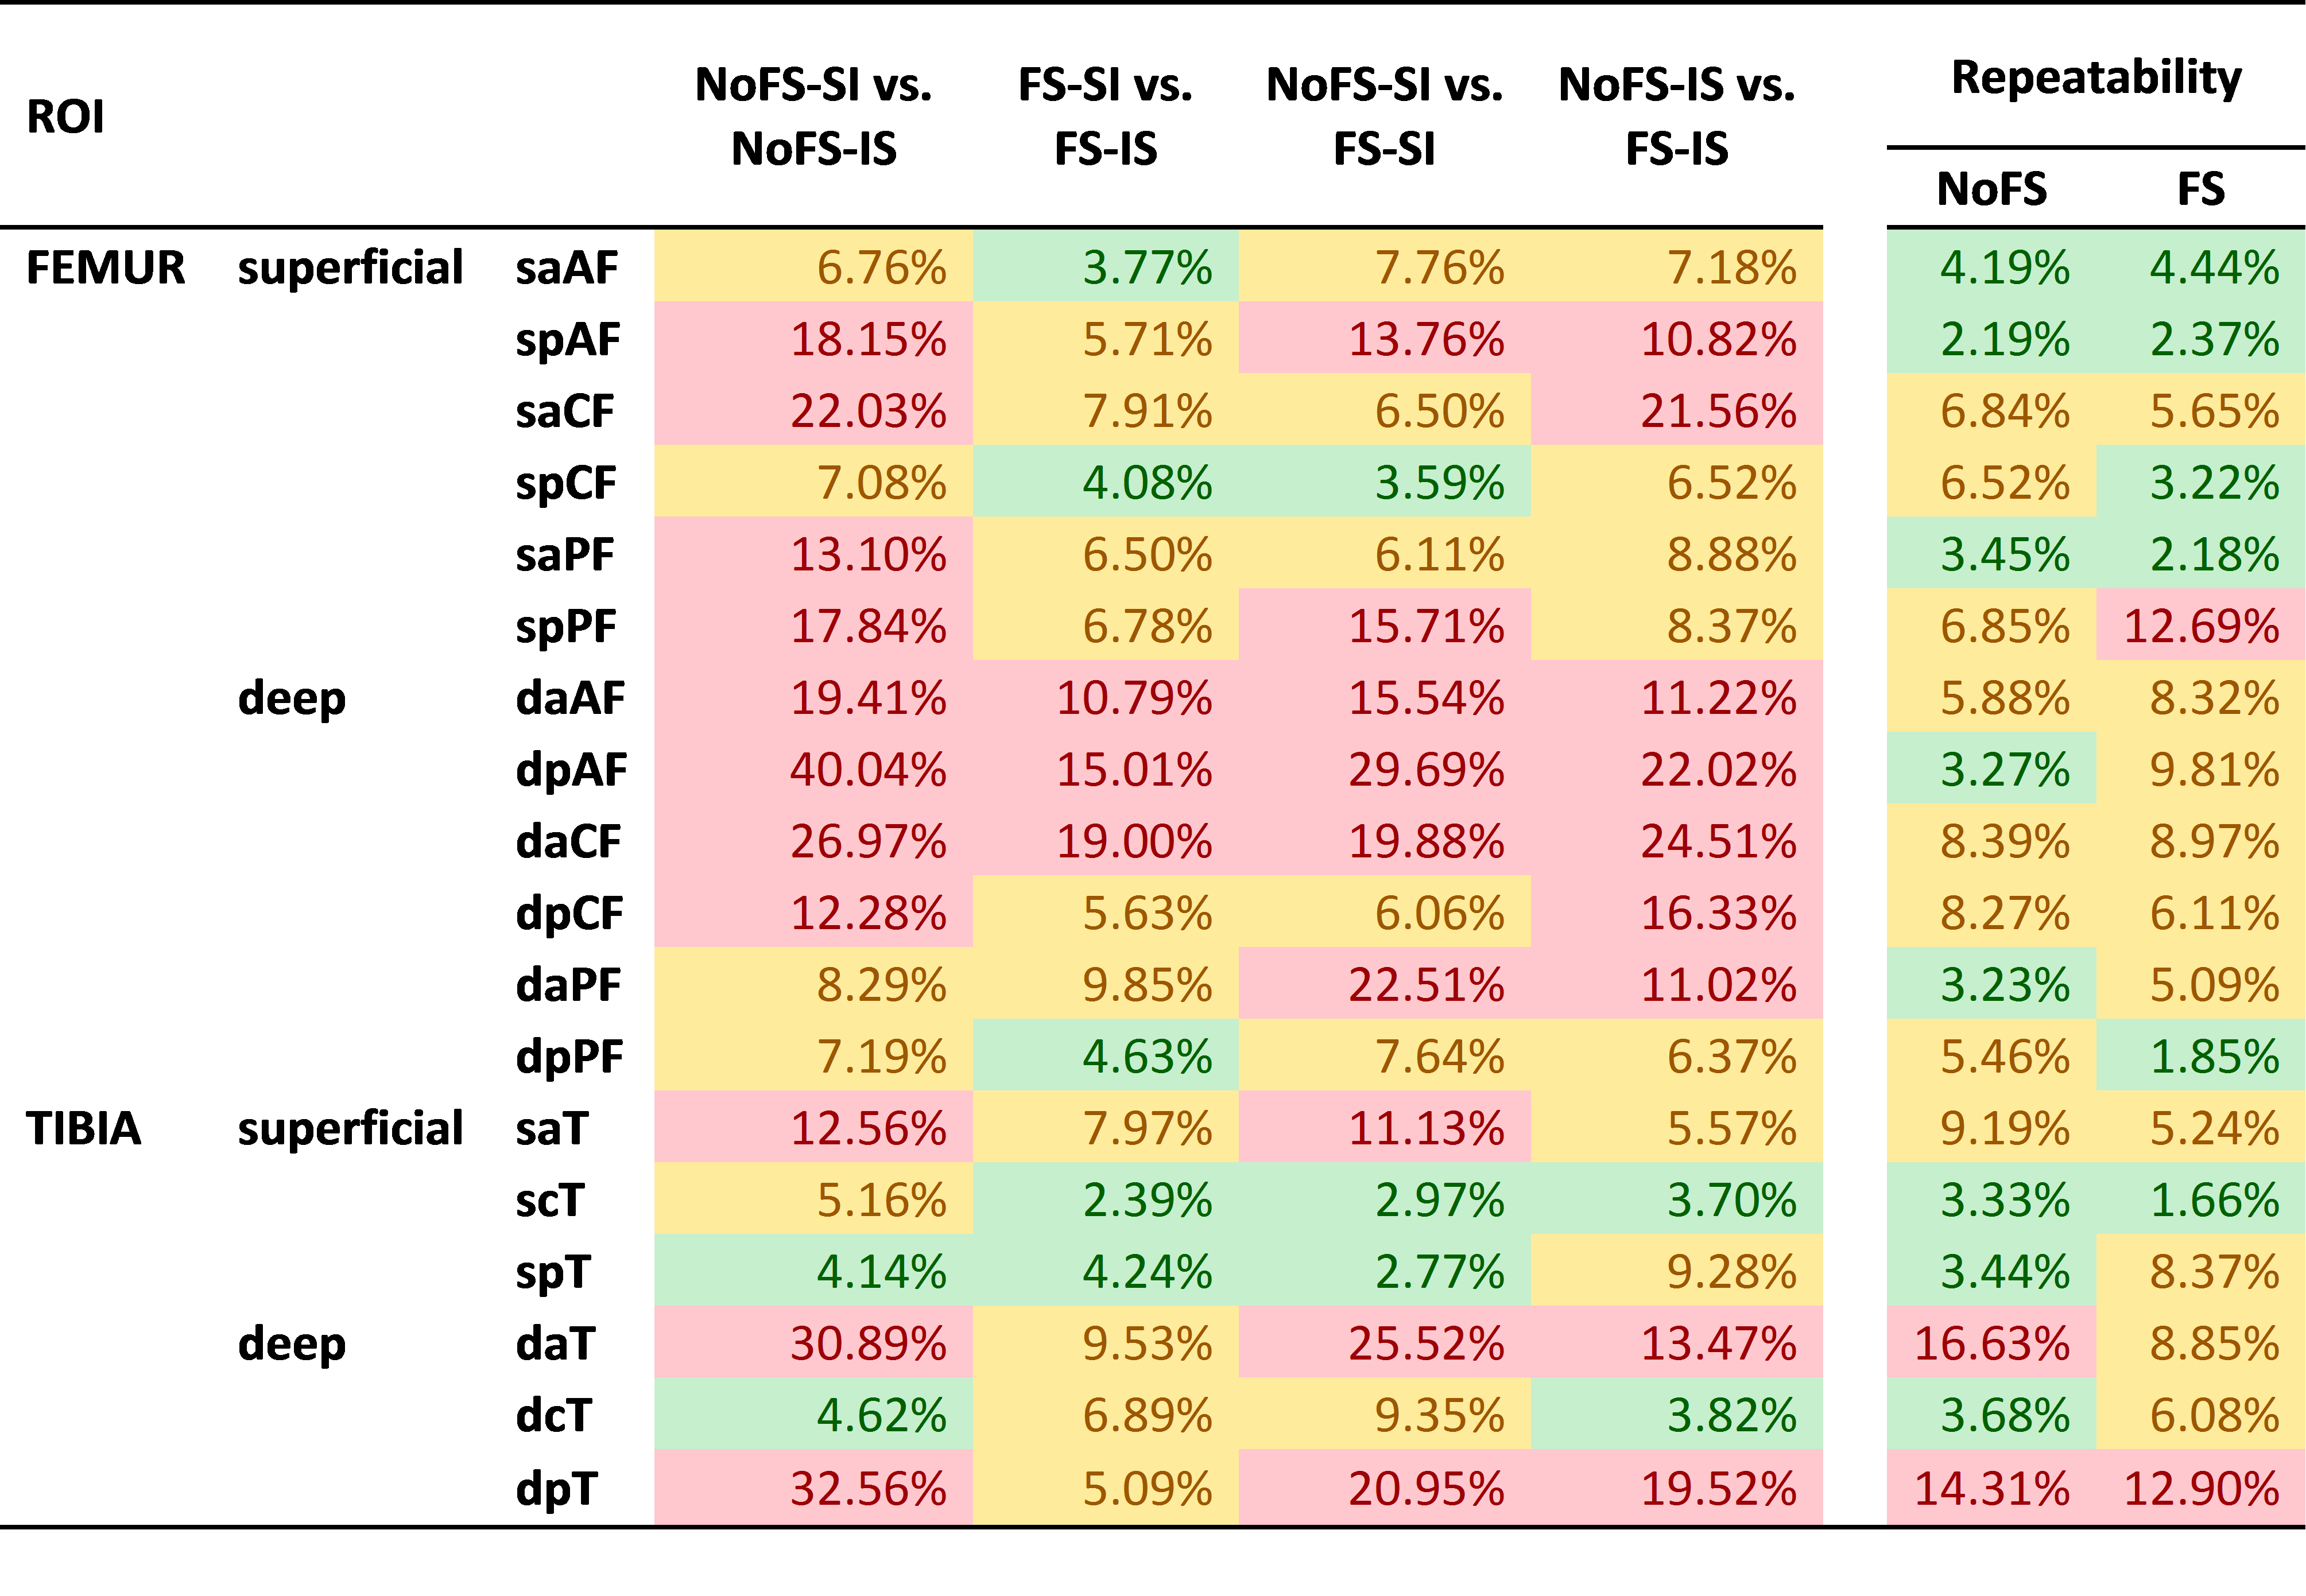
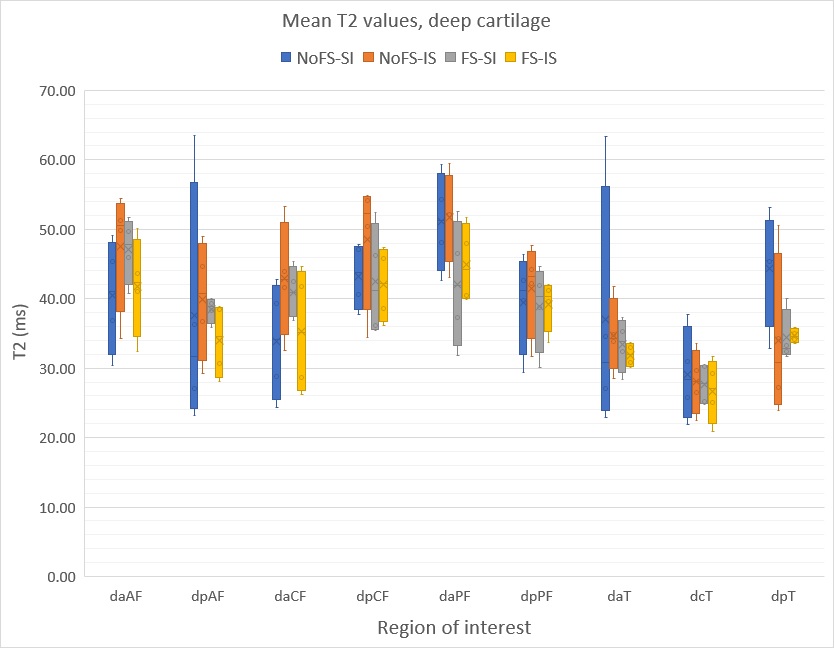
Differences between NoFS T2-SI and NoFS T2-IS ranged from 4-40%, and exceeded 10% in 11 out of 18 ROIs, suggesting that the CS artifact affects most of the cartilage regions (Table 1). Particularly affected were the superficial and deep femoral cartilage (CVRMS> 40% in dpAF) and deep tibia (CVRMS> 30% in daT and dpT). Differences between FS T2-SI and FS T2-IS values were below 10% in most of the ROIs, with the highest CVRMS observed in dpAF and daCF. Comparing NoFS T2 and FS T2 values with the same frequency encoding direction, differences were on average higher using SI direction and the deep ROIs were the most affected. Repeatability of segmentation was very good (CVRMS< 5%) in eight ROIs without FS and six ROIs with FS and with average CVRMS of 6% for both NoFS and FS T2 mapping. For NoFS T2 mapping, segmentation repeatability exceeded 10% in deep tibial cartilage (daT and dpT). On the contrary, FS T2 mapping showed segmentation repeatability lower than 10% in spPF and dPT.Discussion
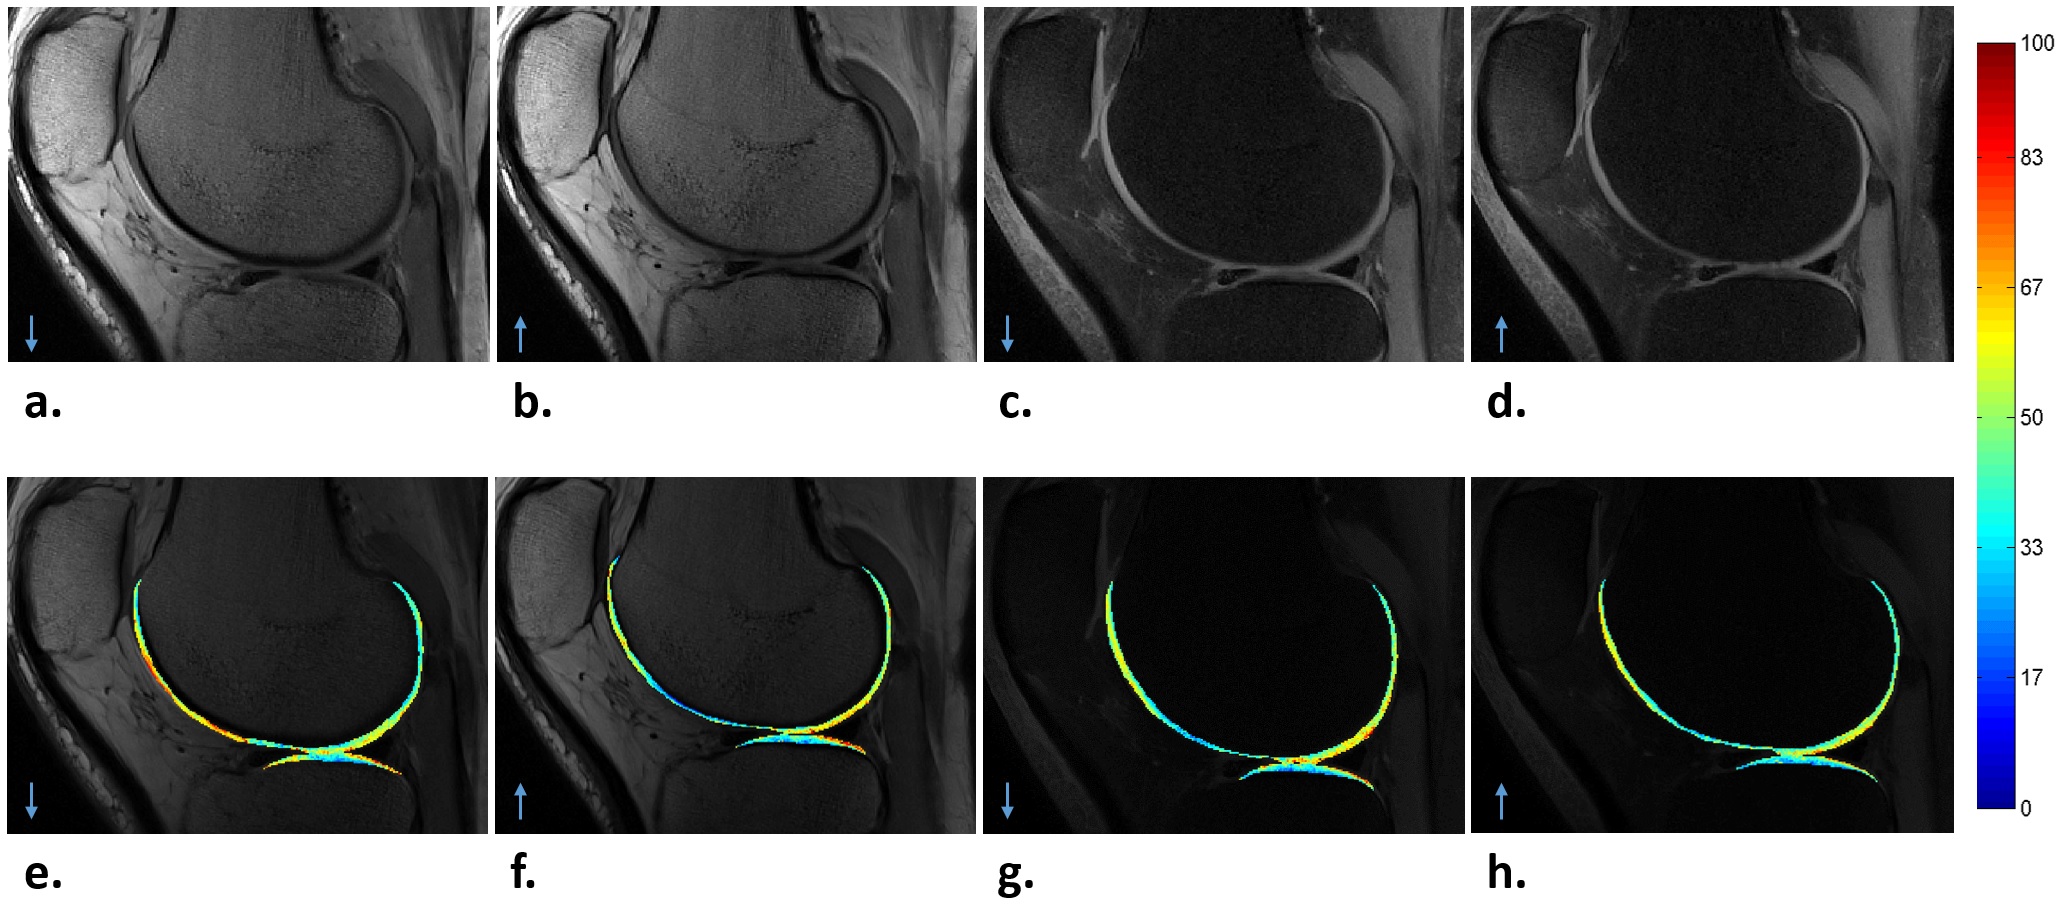
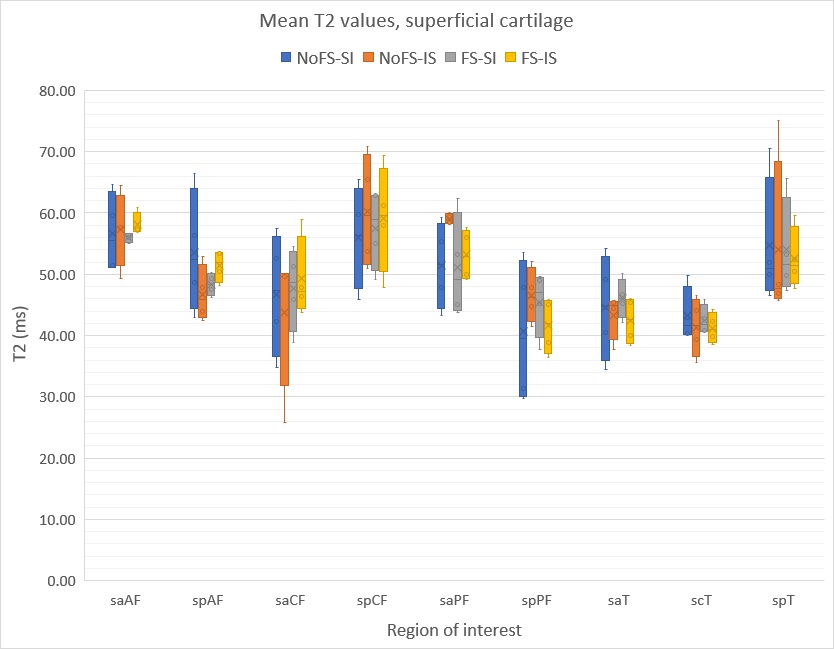
The effect of FS in knee cartilage T2 mapping has been previously investigated in vitro.6 In present study, the effect of FS on cartilage T2 mapping was evaluated in vivo (Fig. 2). The highest differences between T2 values measured with and without FS were observed in the ROIs which have most of the cartilage surface perpendicular to direction of the CS artifacts, i.e. the frequency encoding direction, such as pAF, CF and CT regions. Variations in the changes were dependent on orientation and shape of the ROIs. Deep layers were the most affected, probably due to the fat-contamination from bone marrow via the CS artifact. Among superficial layers, the ROIs adjacent to fatty tissues were the most affected. The differences in FS T2 values acquired with opposite frequency encoding directions demonstrated the contribution of fat-contamination in different regions (Fig. 3-4). Using FS resulted, in most of the cases, in shorter T2 values. This is probably due to the reduction of contamination from long T2 relaxation times of fat. However, in some cases, FS produced longer T2 values as compared to NoFS T2 mapping and differences were higher than those attributable to segmentation errors. A possible explanation may be the apparent relaxation caused by partial saturation of the water signal by the fat saturation pulse. FS improved the repeatability of segmentation in half of the ROIs, however in some sites the repeatability was lower compared to No-FS T2. Future studies will investigate different methods to reduce CS artifact, including increasing the readout bandwidth or using alternative techniques for achieving FS.Conclusions
The findings of this study suggest significant contamination from fat signal on in vivo T2 mapping of knee cartilage, which could be reduced using fat saturation. Nonetheless, FS appears to decrease the segmentation repeatability in some cartilage regions and to introduce additional variability into T2 quantitation which should be considered when estimating effect sizes.
Acknowledgements
Support from the Jane and Aatos Erkko Foundation Academy of Finland (grants #285909 and #293970) is gratefully acknowledged.References
- Kretzschmar M, Bieri O, Miska M, et al. Characterization of the collagen component of cartilage repair tissue of the talus with quantitative MRI: Comparison of T2 relaxation time measurements with a diffusion-weighted double-echo steady-state sequence (dwDESS). Eur Radiol. 2015;25(4):980-986.
- Lammentausta E, Kiviranta P, Nissi MJ, et al. T2 relaxation time and delayed gadolinium-enhanced MRI of cartilage (dGEMRIC) of human patellar cartilage at 1.5 T and 9.4 T: Relationships with tissue mechanical properties. J Orthop Res. 2006;24(3):366-374.
- Ronga M, Angeretti G, Ferraro S, DE Falco G, Genovese EA, Cherubino P. Imaging of articular cartilage: Current concepts. Joints. 2014;2(3):137-140.
- Wirth W, Maschek S, Roemer FW, Eckstein F. Layer-specific femorotibial cartilage T2 relaxation time in knees with and without early knee osteoarthritis: Data from the osteoarthritis initiative (OAI). Sci Rep. 2016;6:34202.
- Del Grande F, Santini F, Herzka DA, et al. Fat-suppression techniques for 3-T MR imaging of the musculoskeletal system. Radiographics. 2014;34(1):217-233.
- Ryu YJ, Hong SH, Kim H, et al. Fat-suppressed T2 mapping of femoral cartilage in the porcine knee joint: A comparison with conventional T2 mapping. J Magn Reson Imaging. 2017;45(4):1076-1081.
Figures