1385
The novel and quantitative MRI technique: Q-space imaging for evaluating intervertebral disc degeneration: basic and clinical study.1Department of Orthopaedic Surgery, Keio University School of Medicine, Tokyo, Japan, 2Keio University School of Medicine, Tokyo, Japan, 3Central Institute for Experimental Animals, Kawasaki, Japan, 4Department of Physiology, Keio University School of Medicine, Tokyo, Japan, 5Murayama Medical Center, Tokyo, Japan
Synopsis
The conventional qualitative classification of intervertebral disc (IVD) degeneration: Pfirrmann classification on T2 weighted imaging does not have the enough sensitivity for the evaluation of IVD degeneration. In the present study, probability at zero displacement obtained from Q-space imaging (QSI) has a high sensitivity of IVD degeneration in both basic and clinical study compared with the conventional method: T2 mapping. In particular, probability at zero displacement made it possible to observe the effect of the regenerative drug: N-Acetyl Cystaine on IVD degeneration which could not be observed by using T2 mapping. Probability at zero displacement obtained from QSI has the possibility to be a novel biomarker of IVD degeneration.
INTRODUCTION
The grading of intervertebral disc (IVD) degeneration has been evaluated with Pfirrmann classification on T2-weighted MRI imaging(T2WI)1. However, it is still difficult to classify slight changes of degeneration using this method, which is qualitative and based on morphological changes induced by the progression of degeneration. For this reason, a quantitative and more sensitive classification system has been required. Q-space imaging (QSI) is a quantitative diffusion-weighted MRI procedure that makes it possible to detect delicate changes in the microstructure of environments in which free water movement is restricted2. We have previously verified the efficacy of antioxidant N-acetyl cysteine (NAC) on rat IVD degeneration using a quantitative molecular techinque3. The first purpose of this study was to explore the possibility of QSI to detect delicate changes of IVD degeneration and the changes induced by the IVD regeneration therapy by using the rat model. In addition, we explored the possibility of QSI for evaluating human IVD degeneration for future clinical research of regenerative medicine (e.g. NAC).METHODS
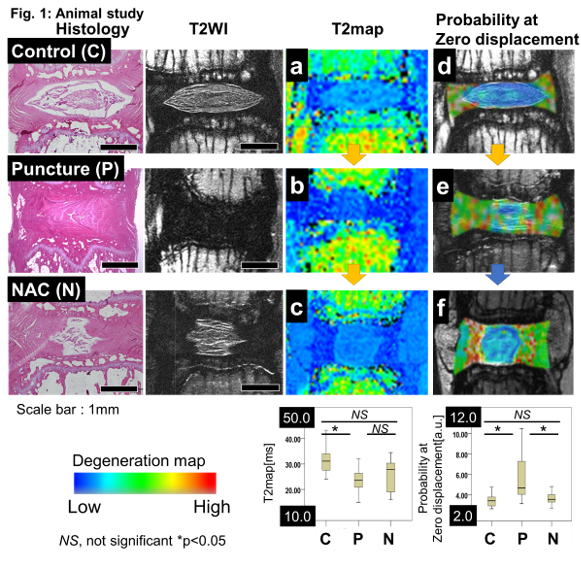
Animal study: A rat degenerative model was generated in which the IVD was punctured using a needle on the coccygeal vertebral levels. NAC (1000mg/mL) was given orally to degenerative model rats 1 week before puncture. We designated rats without IVD puncture as the control group, punctured rats without oral administration of NAC as the puncture group, and rats punctured with NAC as the NAC group (n=5 IVDs in each group). Sagittal MRI was performed using a 7T MRI scanner BioSpec70/16; Bruker BioSpin AG, Fallanden, Switzlan) with a Cryogenic 2ch surface probe (Bruker BioSpin AG, Fallanden, Switzlan) (repetition time (TR)/echo time (TE), 4000/T2WI: 35 T2map: 6 steps from 9 to 72 QSI: 35 [ms]; Δ/δ, 16/10 [ms]; b-value, 6 steps from 0 to 8000 [s/mm2]; pixel resolution 100*100 [um], MPG moment, three axes (x, y, and z)). After MRI, histological examination was performed by Hematoxylin-Eosin staining.
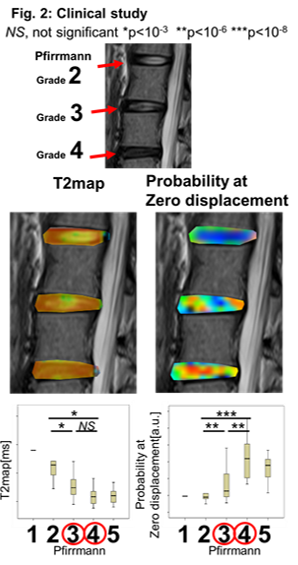
Clinical study: 45 adults (26 males, 19 females, mean [SD] age of 62.1 [8.5] years) diagnosed with nonspecific low back pain were included. Sagittal MRI was performed using a 3T MRI scanner (Magnetom Skyra fit 3T Siemens Healthineers, Erlangen, Germany) with 30ch Body Coil + 30ch Spine Coil (Siemens Healthineers) (TR/TE, 4000/T2WI: 96, T2map 6 steps from 11 to 66, QSI: 89 [ms]; Δ/δ, 43.1/31.7 [ms]; b-value, 9steps from 0 to 4000 [s/mm2]; pixel resolution 1.5*1.5 [mm] MPG moment, six axes (x, y,z and invert x,y,z )).
Imaging parameters: IVD areas were measured by in-house software. IVD degeneration grading was evaluated by T2 mapping values (T2map) [ms] and QSI parameters both in rat and human studies. QSI parameters included probability at zero displacement (arbitrary unit [a.u.]), kurtosis [a.u.], and full width at half maximum (FWHM) [µm]. These were obtained by averaging the data from the multiple directions. Pfirrmann classification onT2WI was used only in human study. These studies were approved by institutional review board of Keio University.
RESULTS
Animal study: There were significant differences in T2 map and all QSI parameters between the control and puncture groups (p<0.05). However, T2 map was not significantly different between the puncture and NAC groups. On the other hand, there were significant differences in all QSI parameters between the puncture and NAC groups (p<0.05). Interestingly, probability at zero displacement of the control and NAC groups showed little variance compared to the other parameters (Figure 1).
Clinical study: We focused on the difference between Pfirrmann grade III and IV because it would be important to distinguish Pfirrmann grade III form IV in the future research of IVD regenerative medicine. There was no significant difference between Pfirrmann grade III and IV on T2 map. On the other hand, we succeeded clearly in distinguishing Pfirrmann grade III and IV to use probability at zero displacement (p<10-6) (Figure 2).
DISCUSSION
An established method for evaluation of the grading of IVD degeneration is necessary, along with the progression of basic research for IVD. In this study, using QSI, we succeeded in evaluating IVD degeneration grading, which was otherwise not distinguished by T2 values. Kurtosis and FWHM had been widely used independently as QSI parameters for the evaluation of demyelination4 and historical characters of malignant tumors5. Meanwhile, probability at zero displacement has been used in combination with other parameters. However, in this study, probability at zero displacement was a useful parameter that worked well alone from the basic to clinical study. Our findings lend strong support to the hypothesis that probability at zero displacement obtained from QSI is a novel method for evaluating IVD degeneration and the result of regeneration therapy.CONCLUSION
Probability at zero displacement obtained from QSI is a novel biomarker of IVD degeneration from basic to clinical.Acknowledgements
We are grateful to Yoshibumi Sone and Jun Kasahara (Medical Scanning) for technical assistance of Q-space imaging and taking an clinical MRI .References
1 Pfirrmann, C. W., Metzdorf, A., Zanetti, M., Hodler, J. & Boos, N. Magnetic resonance classification of lumbar intervertebral disc degeneration. Spine (Phila Pa 1976) 26, 1873-1878 (2001).
2 Callaghan, P. T., Coy, A., MacGowan, D., Packer, K. J. & Zelaya, F. O. Diffraction-like effects in NMR diffusion studies of fluids in porous solids. Nature 351, 467-469 (1991).
3 Suzuki, S. et al. Excessive reactive oxygen species are therapeutic targets for intervertebral disc degeneration. Arthritis Res. Ther. 17, 316, doi:10.1186/s13075-015-0834-8 (2015).
4 Fujiyoshi, K. et al. In vivo tracing of neural tracts in the intact and injured spinal cord of marmosets by diffusion tensor tractography. J. Neurosci. 27, 11991-11998, doi:10.1523/jneurosci.3354-07.2007 (2007).
5 Yamada, I. et al. q-space MR imaging of gastric carcinoma ex vivo: Correlation with histopathologic findings. Magnetic resonance in medicine 76, 602-612, doi:10.1002/mrm.25905 (2016).
Figures