1383
Quantitative GagCEST MRI in Juvenile Bovine Articular Cartilage Exhibit Correlations between 3T and 7T1Bioengineering, Stanford University, Stanford, CA, United States, 2Radiology, Stanford University, Stanford, CA, United States, 3Mechanical Engineering, Stanford University, Stanford, CA, United States
Synopsis
GagCEST is a quantitative MR technique that shows promise at 7T to specifically detect cartilage glycosaminoglycan content; however, its potential at 3T is still uncertain. This study utilizes a new optimized 3D GagCEST sequence to maximize SNR and GagCEST contrast at 3T. Comparison of GagCEST asymmetry maps obtained at 3T and 7T suggest that GagCEST can be used to distinguish zonal differences in cartilage composition at both 3T and 7T. This work demonstrates potential for whole joint GagCEST knee imaging at 3T with improved dynamic range.
Introduction
Osteoarthritis is a progressive and debilitating disease whose early stages are marked by cartilage degradation1. At this phase, enzymatic degradation of cartilage results in glycosaminoglycan (GAG) depletion. While many quantitative MR imaging techniques have been developed to detect GAG content in articular cartilage, their application has been limited by long scan times, the need for specialized hardware, or lack of specificity to GAG1. Chemical exchange saturation transfer of GAG (GagCEST) is a recently-developed quantitative MR technique that uses chemical exchange of specifically saturated exchangeable protons on the hydroxyl groups of GAG molecules and bulk water protons to provide contrast and monitor cartilage GAG content in vivo2. GagCEST has been validated against sodium MR at 7T2,3; however, its potential at 3T is still uncertain. While previous studies have shown that the dynamic range of GagCEST asymmetry in healthy volunteers is low at 3T4, studies that assess its specificity to GAG distribution are limited. In this work, we utilize a new optimized 3D GagCEST sequence to maximize SNR and GagCEST contrast and assess the relationship between GagCEST effects at 3T and 7T using immature bovine articular cartilage.Methods
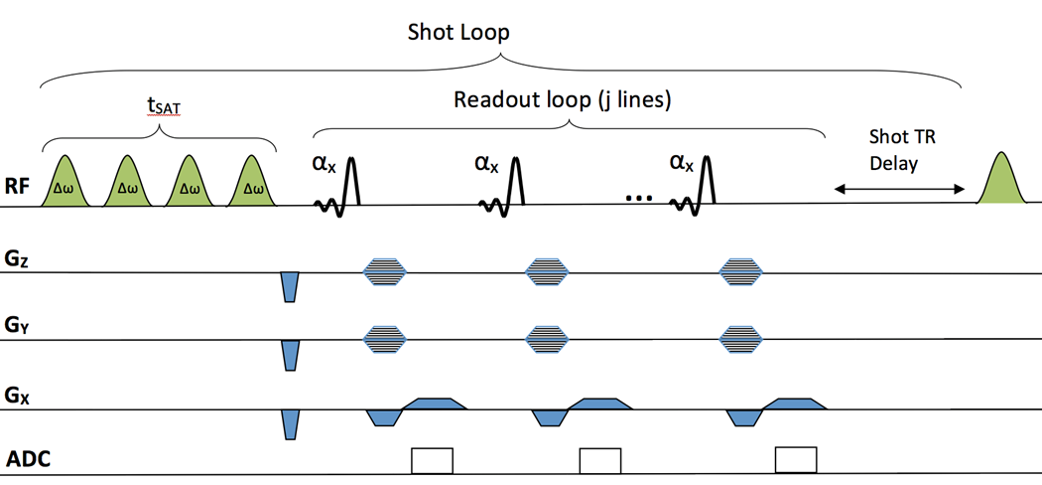
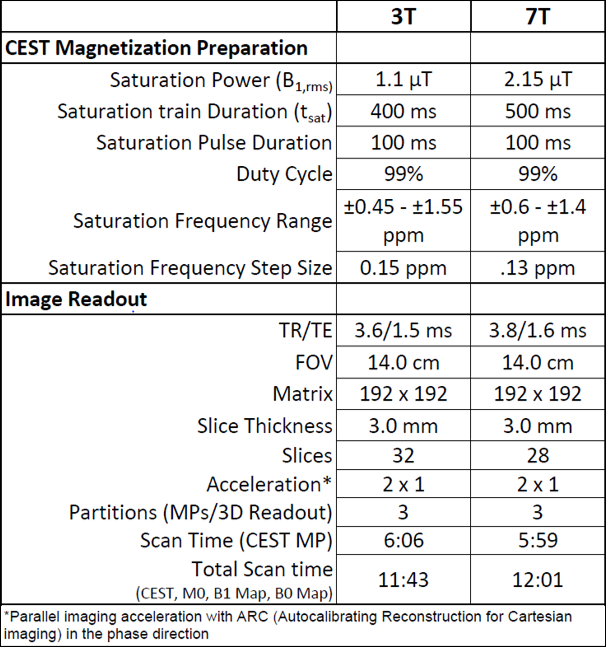
Four intact, immature bovine stifles (San Jose Valley Veal, Santa Clara, CA) were imaged at room temperature on 3T and 7T MR scanners (GE Healthcare) using a 16-channel and 32-channel coil, respectively. GagCEST images were acquired using a magnetization prepared 3D spoiled gradient-echo sequence (Figure 1) with imaging parameters shown in Table 1. CEST saturation parameters were optimized for bovine cartilage at each respective field strength. CEST analysis was performed using in-house MATLAB scripts to correct for B0 and B1 field inhomogeneities as described previously5. CEST asymmetry due to GAG was calculated using the normalized B0 corrected signal intensity at ±1.0 ppm, the chemical shift of GAG hydroxyl protons, using the equation: $$ (S-1.0ppm - S+1.0ppm)/S0 $$. For each bovine specimen, femoral cartilage was divided into two layers representing either superficial or deep zones. These were then subdivided into 19-23 2x4x3mm regions from equivalent regions on 3T and 7T GagCESTasym maps. An average GagCESTasym was calculated for each masked region on a slice-by-slice basis. A Wilcoxon signed rank test (α = 0.05) was used to compare differences in the average GagCESTasym in the surface and deep zones at different field strengths. Further, the correlation between GagCESTasym measurements at 3T and 7T were measured using a Pearson’s correlation coefficient.
Results
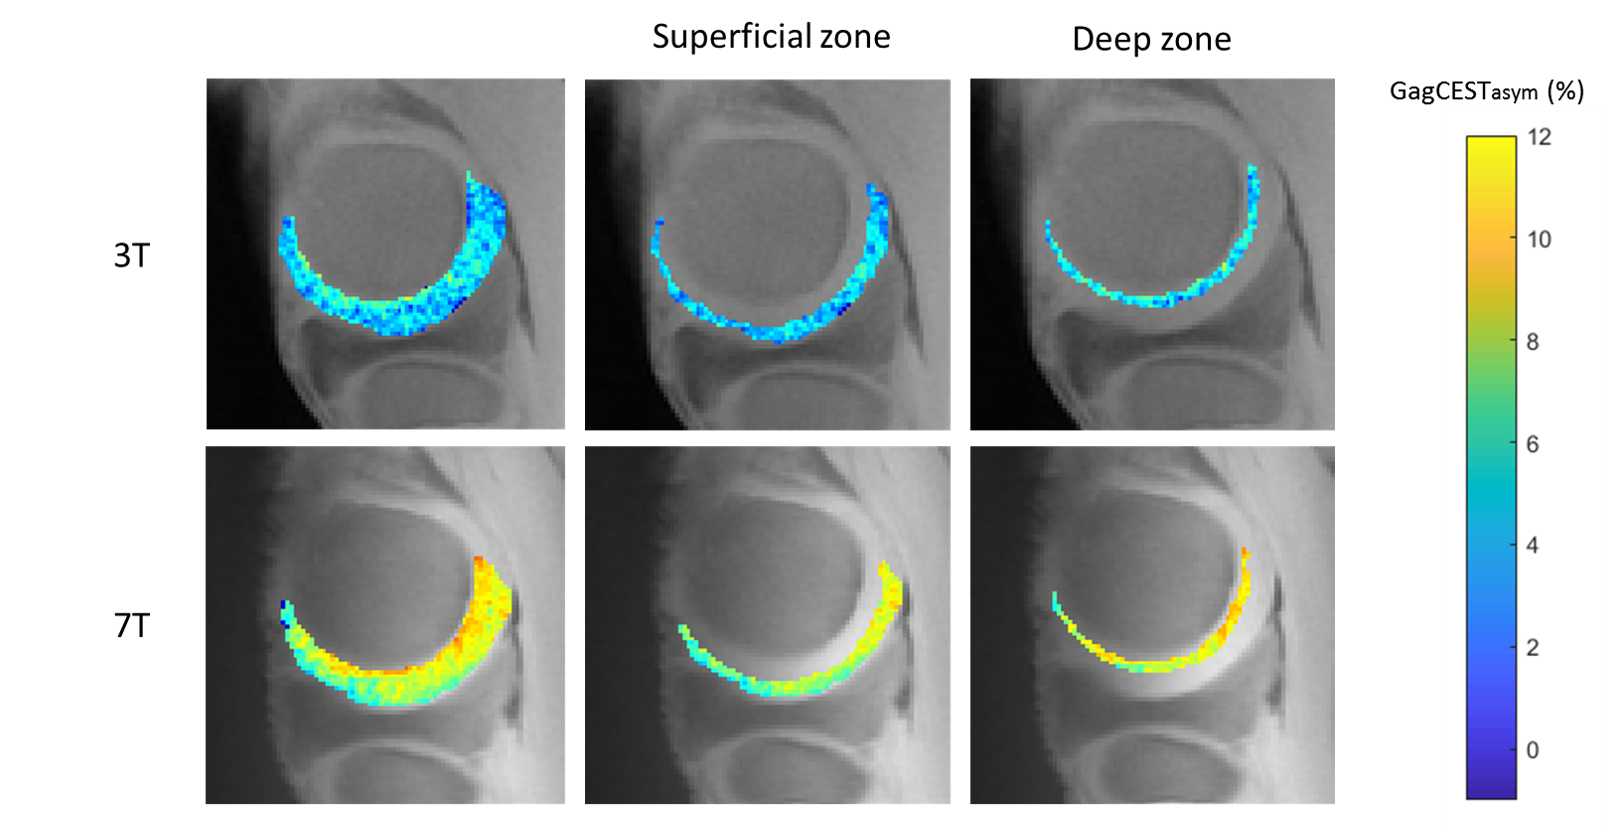
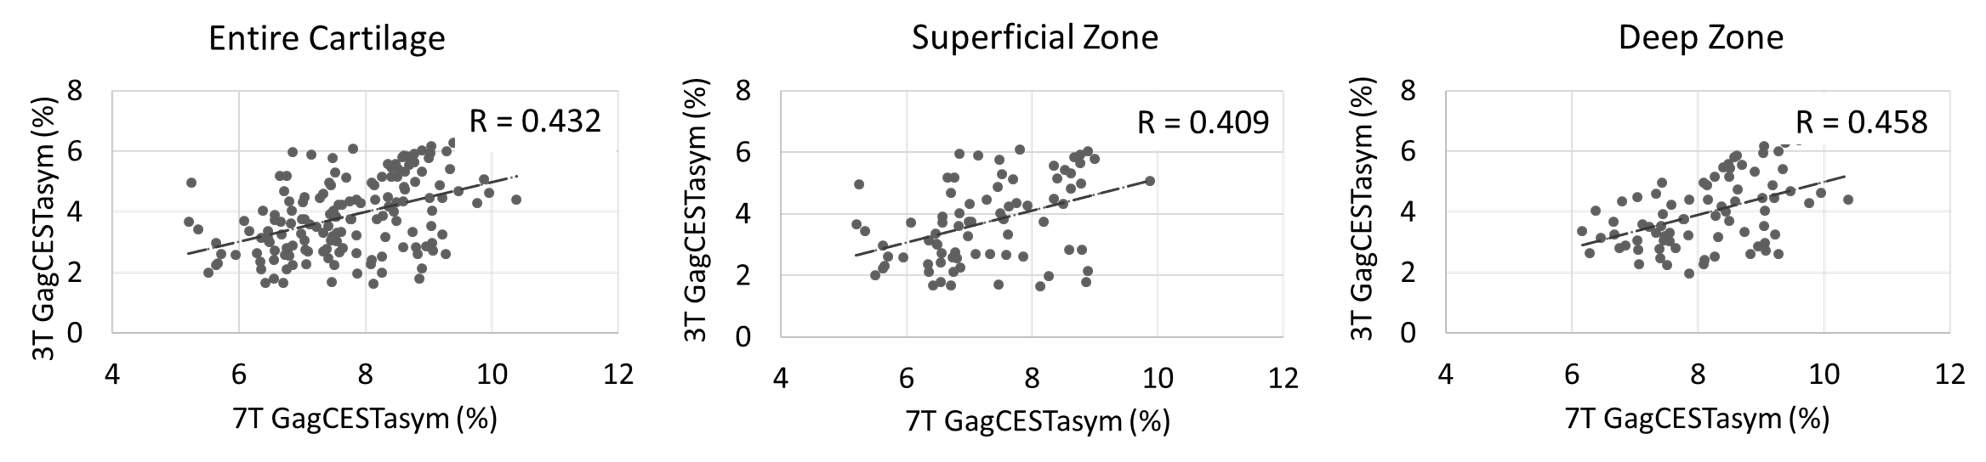
Zonal differences in GagCESTasym were observed at both 3T and 7T (Figure 2). There was a significant difference between the average GagCESTasym between the superficial and deep zones at both 3T and 7T (p < 0.01 for both). While the average cartilage GagCESTasym was greater for 7T than for 3T, the results were positively correlated (R = 0.431, p < 0.01). When the zones were compared separately, there was a similar correlation between GagCESTasym at 3T and at 7T for cartilage within the superficial zone (R = 0.409, p < 0.01) and within the deep zone (R = 0.458, p < 0.01) (Figure 3).Discussion
While GagCEST has shown to be promising for direct detection of GAG at 7T, its utility at 3T remains in question. In healthy bovine cartilage, there was a clear laminar distribution in the GagCESTasym maps at 7T. This pattern was less distinct, though still significant, at 3T. These results are consistent with the known GAG distribution in articular cartilage6. Despite the lower dynamic range and reduced SNR in comparison to 7T, the 3T images acquired here demonstrate improved dynamic range compared to previous literature4. These results suggest that GagCEST can be used at either field strength to distinguish zonal differences in cartilage composition. It is important to note that we studied bovine samples at room temperature, which likely resulted in different exchange conditions compared to in vivo human knees. Additionally, the images were not automatically segmented or registered, which could lead to some discrepancies in the correlations. Further work will assess if this relationship is present within healthy human cartilage, and if it can be used to observe early cartilage degeneration in subjects with osteoarthritis.Conclusion
This work demonstrates potential for whole-joint GagCEST knee imaging at 3T with improved dynamic range. Results suggest that within juvenile femoral articular cartilage, GagCEST can be used to distinguish zonal differences in cartilage composition at both 3T and 7T.Acknowledgements
This work was funded by the William K. Bowes Jr. Stanford Graduate Fellowship, GE Healthcare, and the National Institutes of Health (NIH) grants K99EB022634, RO1 EB002524, and K24 AR062068.References
1. Matzat S, van Tiel J, Gold G, Oei EHG. Quantitative MRI Techniques of Cartilage Composition. Quantitative Imaging in Medicine and Surgery, 2013; 3(3):162-174.
2. Ling W, Regatte RR, Navon G, Jerschow A. Assessment of glycosaminoglycan concentration in vivo by chemical exchange-dependent saturation transfer (gagCEST). Proceedings of the National Academy of Science, 2008;105(7):2266-2270.
3. Schmitt B, Zbyn S, Stelzeneder D, Jellus V, Paul D, Lauer L, Bachert P, Trattnig S. Cartilage quality assessment by using glycosaminoglycan chemical exchange saturation transfer and (23)Na MR imaging at 7T. Radiology, 2011; 260(1):257–264.
4. Singh A, Haris M, Cai K, Kassey VB, Kogan F, Reddy D, Hariharan H, Reddy R. Chemical exchange saturation transfer magnetic resonance imaging of human knee cartilage at 3 T and 7T. Magnetic Resonance in Medicine 2012; 68(2):588–594.
5. Kogan F, Hargreaves B, Gold G. Volumetric Multislice GagCEST Imaging of Articular Carilage: Optimization and Comparison with T1rho. Magnetic Resonance in Medicine, 2017;77(3):1134-1141.
6. Maroudas A. Transport of solutes through cartilage: permeability to large molecules. Journal of Anatomy, 1976; 122:335–347.
7. Krishnamoorthy, G., Nanga, R. P. R., Bagga, P., Hariharan, H. and Reddy, R. High quality three-dimensional gagCEST imaging of in vivo human knee cartilage at 7 Tesla. Magnetic Resonance in Medicine, 2017;77: 1866–1873.
Figures