1381
Grey-Level Co-Occurrence Matrix Texture Analysis of T2, Adiabatic T1ρ, Adiabatic T2ρ and Dual-Echo Steady-State Magnetic Resonance Imaging Contrasts in Osteoarthritic Knee Articular Cartilage1Research Unit of Medical Imaging, Physics and Technology, University of Oulu, Oulu, Finland, 2Department of Diagnostic Radiology, Oulu University Hospital, Oulu, Finland, 3Medical Research Center, University of Oulu and Oulu University Hospital, Oulu, Finland
Synopsis
Grey-level co-occurrence matrix (GLCM) based texture analysis is a sensitive image processing tool for the evaluation of cartilage in knee osteoarthritis (OA). Texture analysis of T2, Adiabatic T1ρ (AdT1ρ), Adiabatic T2ρ (AdT2ρ) relaxation time maps as well as Dual-Echo Steady-State (DESS) images showed the ability to distinguish OA patients and asymptomatic volunteers. Moreover, texture analysis turned out to be more sensitive to cartilage degeneration than mean relaxation time values. Texture analysis can therefore supplement existing quantitative MRI techniques of articular cartilage.
Introduction
Osteoarthritis (OA) is a chronic disease with high socioeconomic impact worldwide. The primary changes in knee OA take place in cartilage1. Accurate biomarkers that offer potential for an earlier diagnosis and that could be used as outcome measures for the development of new treatments are needed. The analysis of image texture might be a sensitive indicator of cartilage deterioration.
Quantitative magnetic resonance imaging (qMRI), with its excellent soft tissue contrast, is a powerful technique for evaluating the articular cartilage condition. T2, Adiabatic T1ρ (AdT1ρ) and Adiabatic T2ρ (AdT2ρ) relaxation times have shown the ability to provide early and sensitive depiction of changes in cartilage composition2,3. These methods can be further evaluated using grey-level co-occurrence matrix (GLCM) texture analysis4, which quantifies the distribution of the cartilage pixel values with OA progression5. To test if similar differences could be observed from a non-quantitative method, Dual-Echo Steady-State (DESS) images were also explored as they seem to reveal some OA progression when used in the morphological assessment of cartilage6. Texture features contrast and difference entropy of the relaxation time maps and DESS images were studied in patients with knee OA.
Methods
The study population consisted of 24 subjects selected from the Oulu Knee Osteoarthritis Study cohort7, the Oulu University Hospital patient registry and general public. Half of the recruited individuals were patients diagnosed with early OA (6 female, 6 male, mean age 59.1 years (standard deviation (SD) 5.9 years), body mass index (BMI) 30.4 kg/m2 (SD 6.9 kg/m2)) within the last six months according to the criteria for classification of idiopathic OA of the American College of Rheumatology (ACR)8. The other half comprised age- and sex-matched asymptomatic volunteers (6 female, 6 male, mean age 59.8 years (SD 5.5 years), BMI 24.8 kg/m2 (SD 3.2 kg/m2)). The imaging protocols and informed consent documentation were approved by the local Institutional Review Board (IRB) ethical committee. The exclusion criteria for patients participating in this study were age below 50 years, total or partial knee prosthesis and knees with radiographic Kellgren-Lawrence grade equal or above 3. For volunteers the exclusion criteria were history of knee surgery, any recent traumatic knee lesion and any knee joint functional impairment or moderate-to-severe physical symptoms experienced during the past six months.
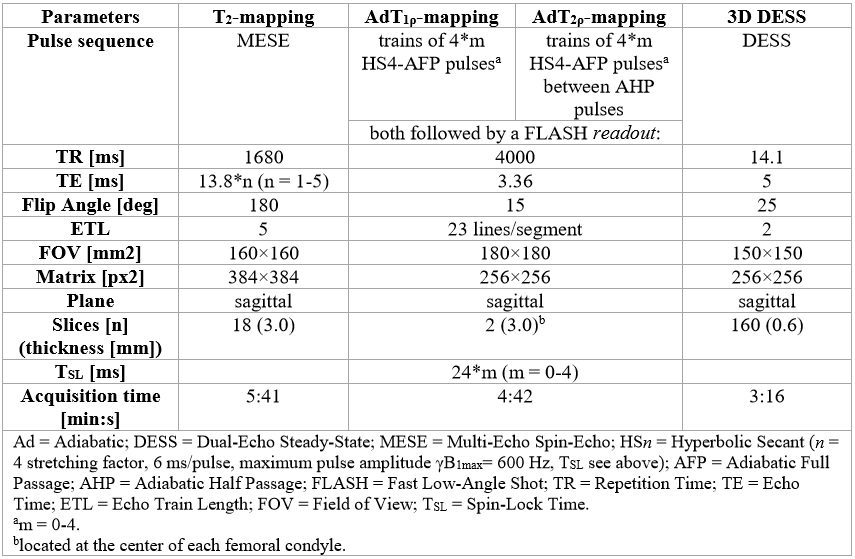
Subjects were scanned on a 3T Siemens Skyra (Siemens Healthcare, Erlangen, Germany). All the imaging measurements were collected using a 15-channel transmit/receive knee coil (QED, Mayfield Village, OH, USA). The acquisition protocol included four different sequences (Fig. 1). DESS thin and DESS thick are used to refer to DESS images with 0.6 mm and 3.0 mm slice thickness, respectively. Region-of-interest-wise texture analysis was then applied slice-by-slice for all the segmented images with an in-house developed segmentation and analysis tool (MATLAB, Mathworks Inc., Natick, MA). Contrast and difference entropy were examined from GLCM4. Statistical analysis was performed with the IBM SPSS Statistics 23 software: Mann-Whitney U tests were used to compare patients and volunteers.
Results
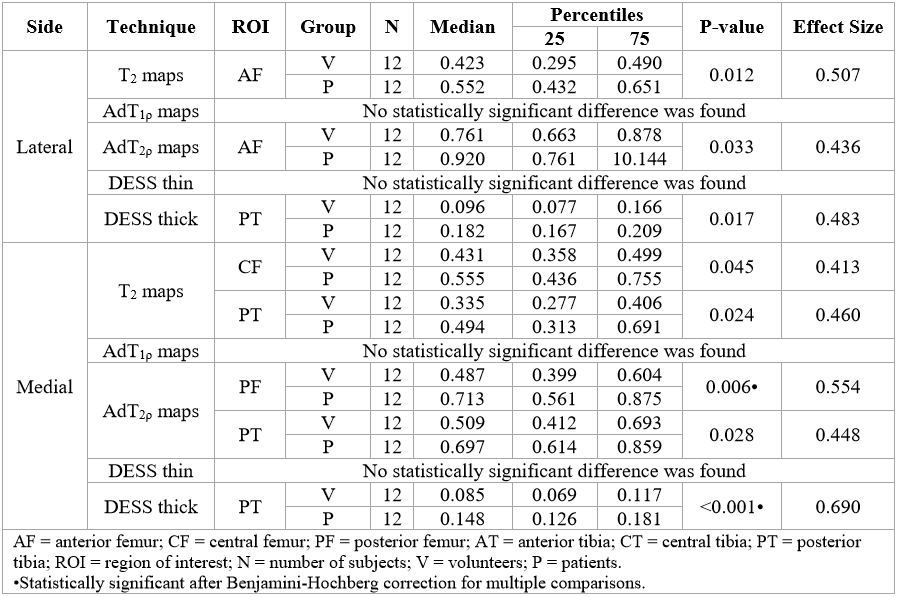
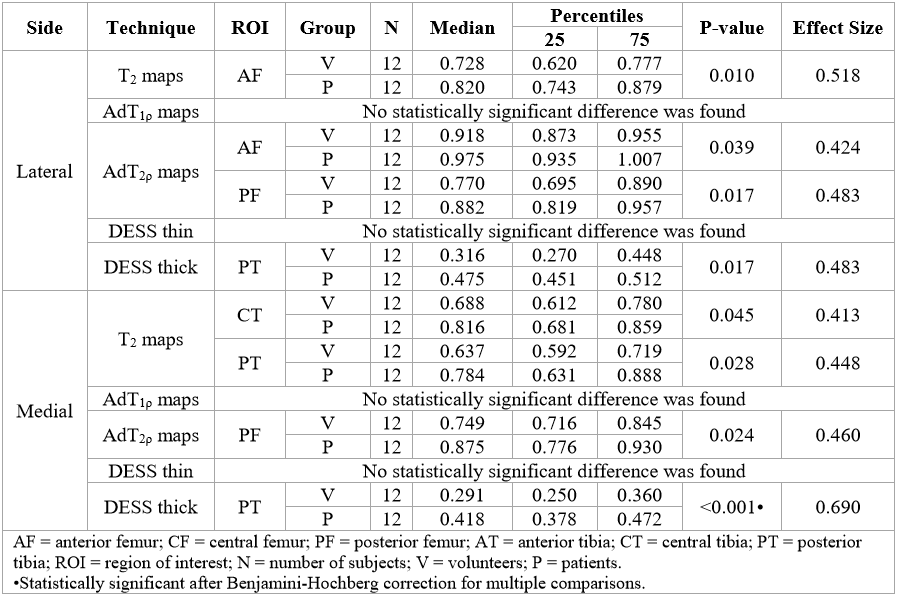
All texture features demonstrated to be sensitive to knee OA. Contrast and difference entropy showed the largest number of regions of interest with statistically significant difference between patients and volunteers (Fig.2-3). Overall, AdT2ρ maps revealed superior performance and the biggest differences were verified in the predominant weight-bearing cartilage. DESS thick images showed the largest effect size in both texture features. Contrast and difference entropy displayed a tendency for higher values in the patient group.
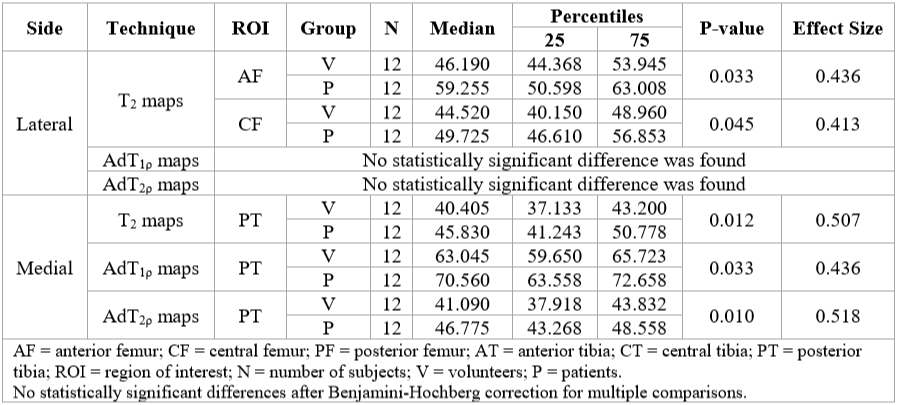
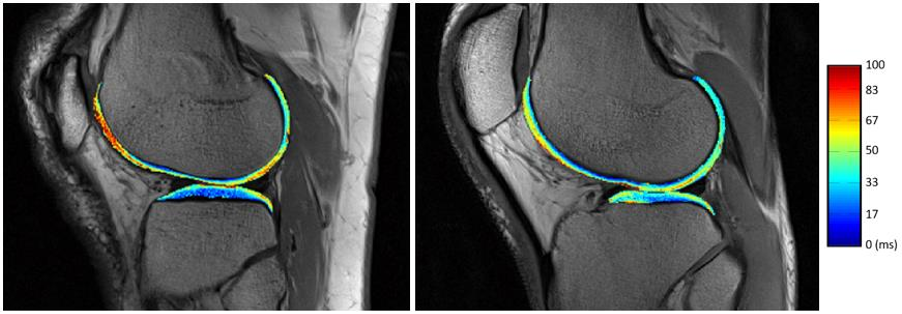
All relaxation time values were also capable of separating the studied groups. T2 turned out to be the most sensitive relaxation time constant to cartilage degeneration (Fig. 4). Higher T2 (Fig. 5), AdT1ρ and AdT2ρ relaxation time values were observed in patients. Differences were mostly found in the medial compartment of tibia and on the posterior tibial cartilage areas as in texture analysis.
Texture features revealed more differences between patients and volunteers than mere mean relaxation time values.
Discussion
Osteoarthritic articular knee cartilage was associated with a less uniform texture than healthy cartilage. Texture features demonstrated an increase in the dissimilarity between the cartilage pixels’ signals and a higher disorder of pixel value arrangement. While relaxation time values can be appropriate parameters to identify OA, probing their spatial distribution through GLCM texture analysis may be more sensitive in detecting changes in tibiofemoral cartilage. Thus, texture analysis may then provide additional information regarding cartilage macromolecular changes.Conclusions
GLCM texture analysis based parameters appear to be promising non-invasive sensitive candidates for identifying early OA, and may thus help in localized monitoring and possibly therapy development. Furthermore, texture analysis could possibly allow a deeper understanding of degenerative phenomena in OA.Acknowledgements
Research funding from Northern Ostrobothnia Hospital District and Instrumentarium Science Foundation is gratefully acknowledged.References
1. J. A. Buckwalter, H. J. Mankin, and A. J. Grodzinsky, “Articular cartilage and osteoarthritis.,” Instructional course lectures, vol. 54. pp. 465–480, 2005.
2. L. Wang and R. R. Regatte, “Quantitative mapping of human cartilage at 3.0T: parallel changes in T₂, T₁ρ, and dGEMRIC.,” Acad. Radiol., vol. 21, no. 4, pp. 463–71, 2014.
3. J. Rautiainen et al., “Multiparametric MRI assessment of human articular cartilage degeneration: Correlation with quantitative histology and mechanical properties,” Magn. Reson. Med., vol. 74, no. 1, 2015.
4. R. M. Haralick, K. Shanmugam, and I. Dinstein, “Textural Features for Image Classification,” IEEE Trans. Syst. Man. Cybern., vol. 3, no. 6, pp. 610–621, 1973.
5. G. Blumenkrantz et al., “The feasibility of characterizing the spatial distribution of cartilage T2 using texture analysis,” Osteoarthr. Cartil., vol. 16, no. 5, pp. 584–590, 2008.
6. C. G. Peterfy, E. Schneider, and M. Nevitt, “The osteoarthritis initiative: report on the design rationale for the magnetic resonance imaging protocol for the knee.,” Osteoarthritis Cartilage, vol. 16, no. 12, pp. 1433–41, 2008.
7. J. Podlipská et al., “Comparison of Diagnostic Performance of Semi-Quantitative Knee Ultrasound and Knee Radiography with MRI: Oulu Knee Osteoarthritis Study.,” Sci. Rep., vol. 6, p. 22365, 2016.
8. R. Altman et al., “Development of criteria for the classification and reporting of osteoarthritis: Classification of osteoarthritis of the knee,” Arthritis Rheum., vol. 29, no. 8, pp. 1039–1049, 1986.
Figures