1377
Analysis of the Local Associations between Morphology and Biochemical Composition of the Articular Cartilage after Anterior Cruciate Ligament Injury and Reconstructive Surgery using Voxel-Based Relaxometry1Department of Radiology and Biomedical Imaging, University of California, San Francisco, San Francisco, CA, United States, 2Department of Orthopaedic Surgery, University of California, San Francisco, San Francisco, CA, United States
Synopsis
This study uncovered new insights on the local associations between cartilage thickness and T1ρ relaxation time (a marker of cartilage proteoglycan content). Using Voxel-based relaxometry, this study quantified the longitudinal and cross-sectional thickness changes that occur in both the ACL-injured knee and the healthy contralateral in the lateral femoral condyle, medial femoral condyle, trochlea, medial tibia, lateral tibia, and patella and examined compartment-specific associations with relaxometry at various time points.
Introduction
Rapid progression of osteoarthritis following anterior cruciate ligament (ACL) injury, despite current treatment regimens and reconstructive surgery, is a well-documented phenomenon.1 Despite our current understanding of cartilage lesions and the changes in biochemistry that occur after ACL injury, no study has investigated the link between these features and cartilage morphological and macroscopic changes. Using the quantitative T1ρ relaxation time Magnetic Resonance Imaging and Voxel-based relaxometry, a quantitative technique capable of detecting localized cartilage changes in the early stages of cartilage degeneration, this multi-center study assesses cartilage biochemical composition and thickness at the baseline ACL injury to 12 months after ACL reconstruction in the injured and non-injured contralateral knee.Methods
A total of 64 patients (28 Female; Age = 28.3 ± 12.5 years; BMI = 24.5 ± 3.1 kg/m2) were recruited from three sites: UCSF, Mayo Clinic, and Hospital for Special Surgery. 56 patients (24 Female; Age = 29.3 ± 12.7 years; BMI = 24.7 ± 3.1 kg/m2) returned six and twelve months after ACL reconstruction for follow-up studies. Bilateral knees were scanned using a 3T MRI scanner (GE Healthcare) with an 8-channel phased array knee coil (Invivo). MRI Protocol included quantitative combined T1ρ/T2 (T1ρ TSL= 0/10/40/80 ms, spin-lock frequency = 500 Hz, FOV 14 cm2, 256 × 128 matrix size, slice thickness 4 mm, T2 preparation TE=0/12.87/25.69/51.39ms). Articular cartilage was automatically segmented in the overall dataset using a technique based on deep learning convolutional neural network trained on 613 manually segmented MRI volumes collected in-house for other studies including ACL, controls and OA subjects. From the cartilage segmentations, local thickness maps were computed for each subject. One subject was then selected as reference using minimum deformation template technique. A non-rigid registration technique was applied between the reference and first TSL=0, T1ρ-weighted image in each dataset. The transformation field was applied to every T1ρ-weighted image and thickness map. T1ρ maps were generated with voxel-by-voxel, monoexponential curve fitting. Injured vs. contralateral differences in cartilage thickness at baseline 6- and 12-month time points, as well as longitudinal progression in both limbs were analyzed using paired Statistical Parametric Mapping technique. Local associations between thickness and T1ρ relaxation time were assessed with voxel based partial Pearson correlations adjusted for age, gender and BMI.Results
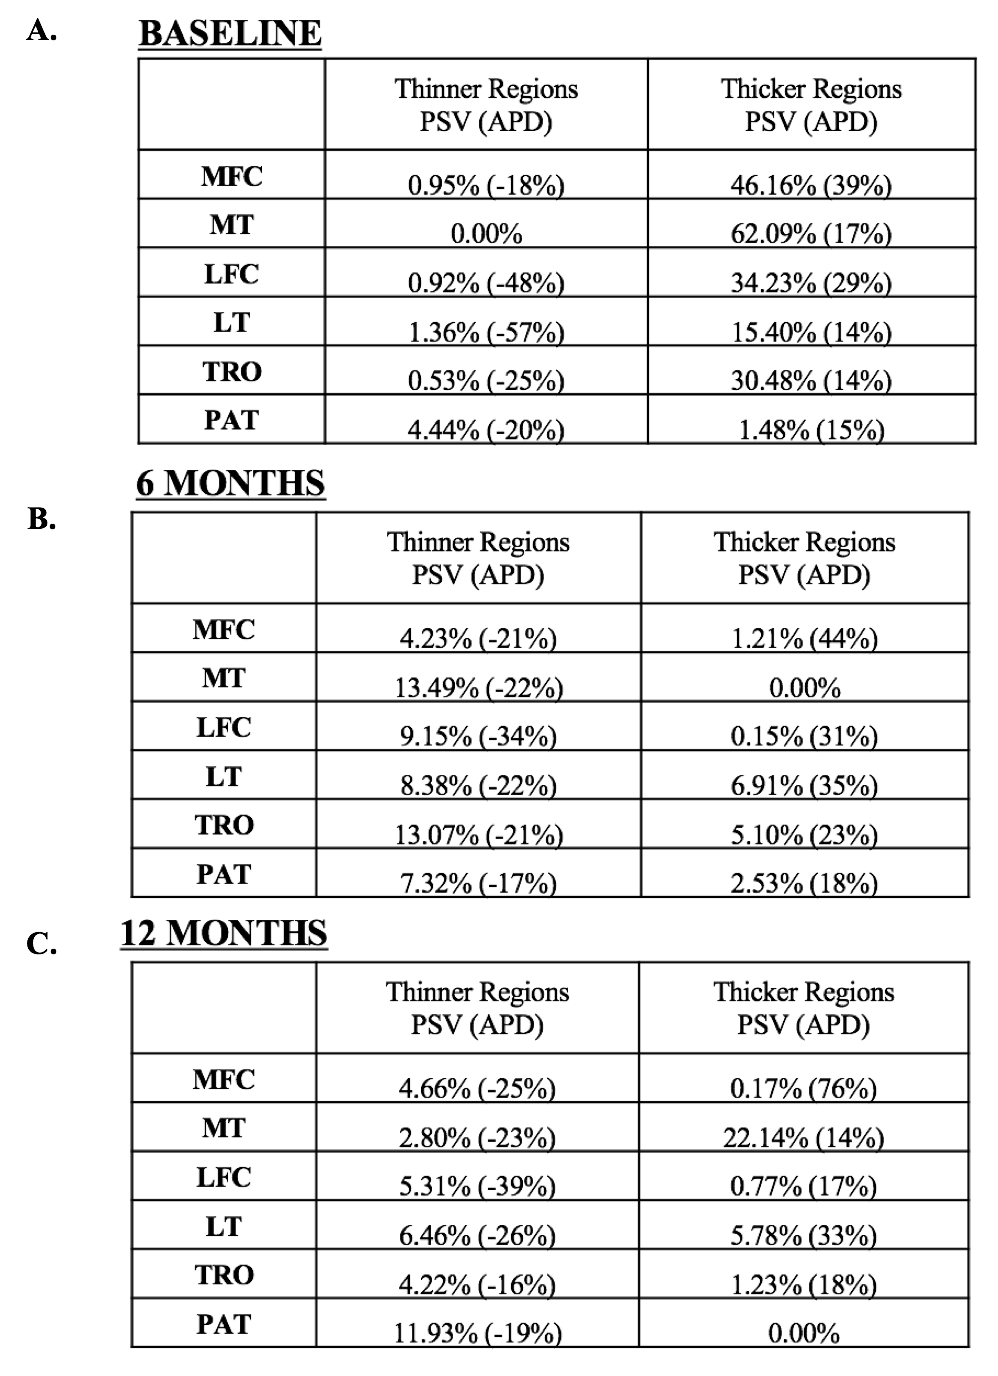
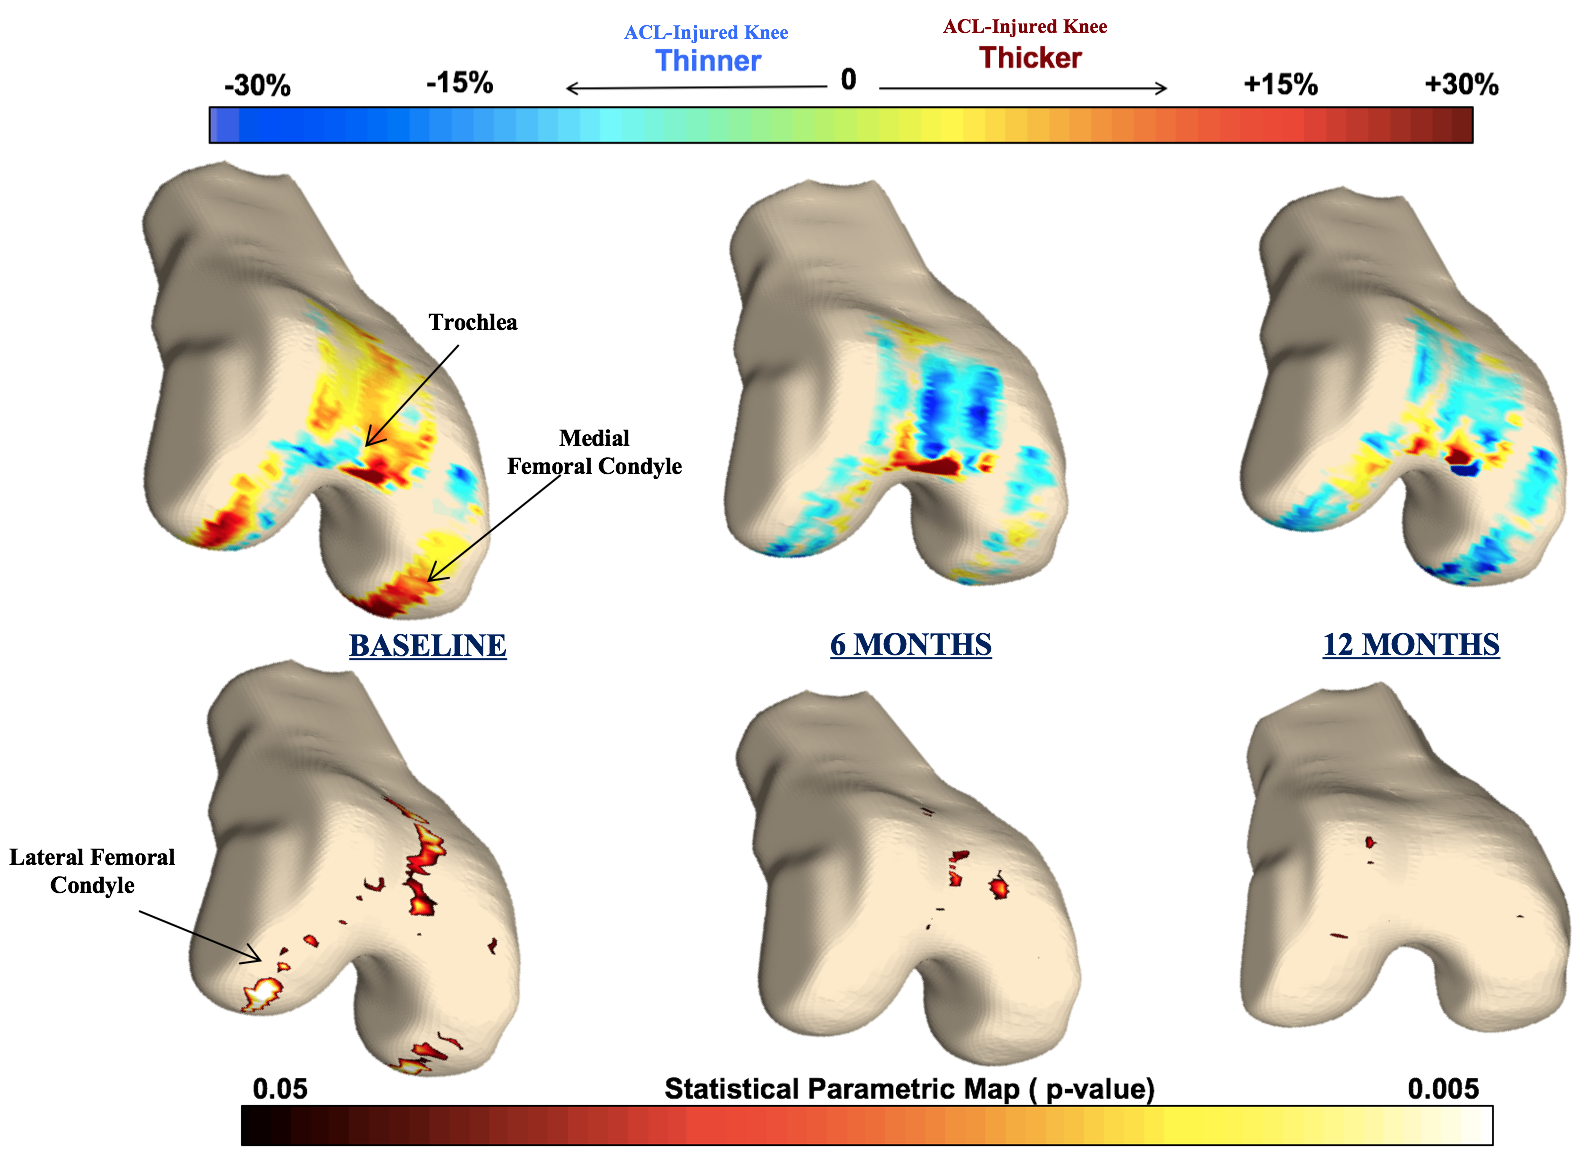
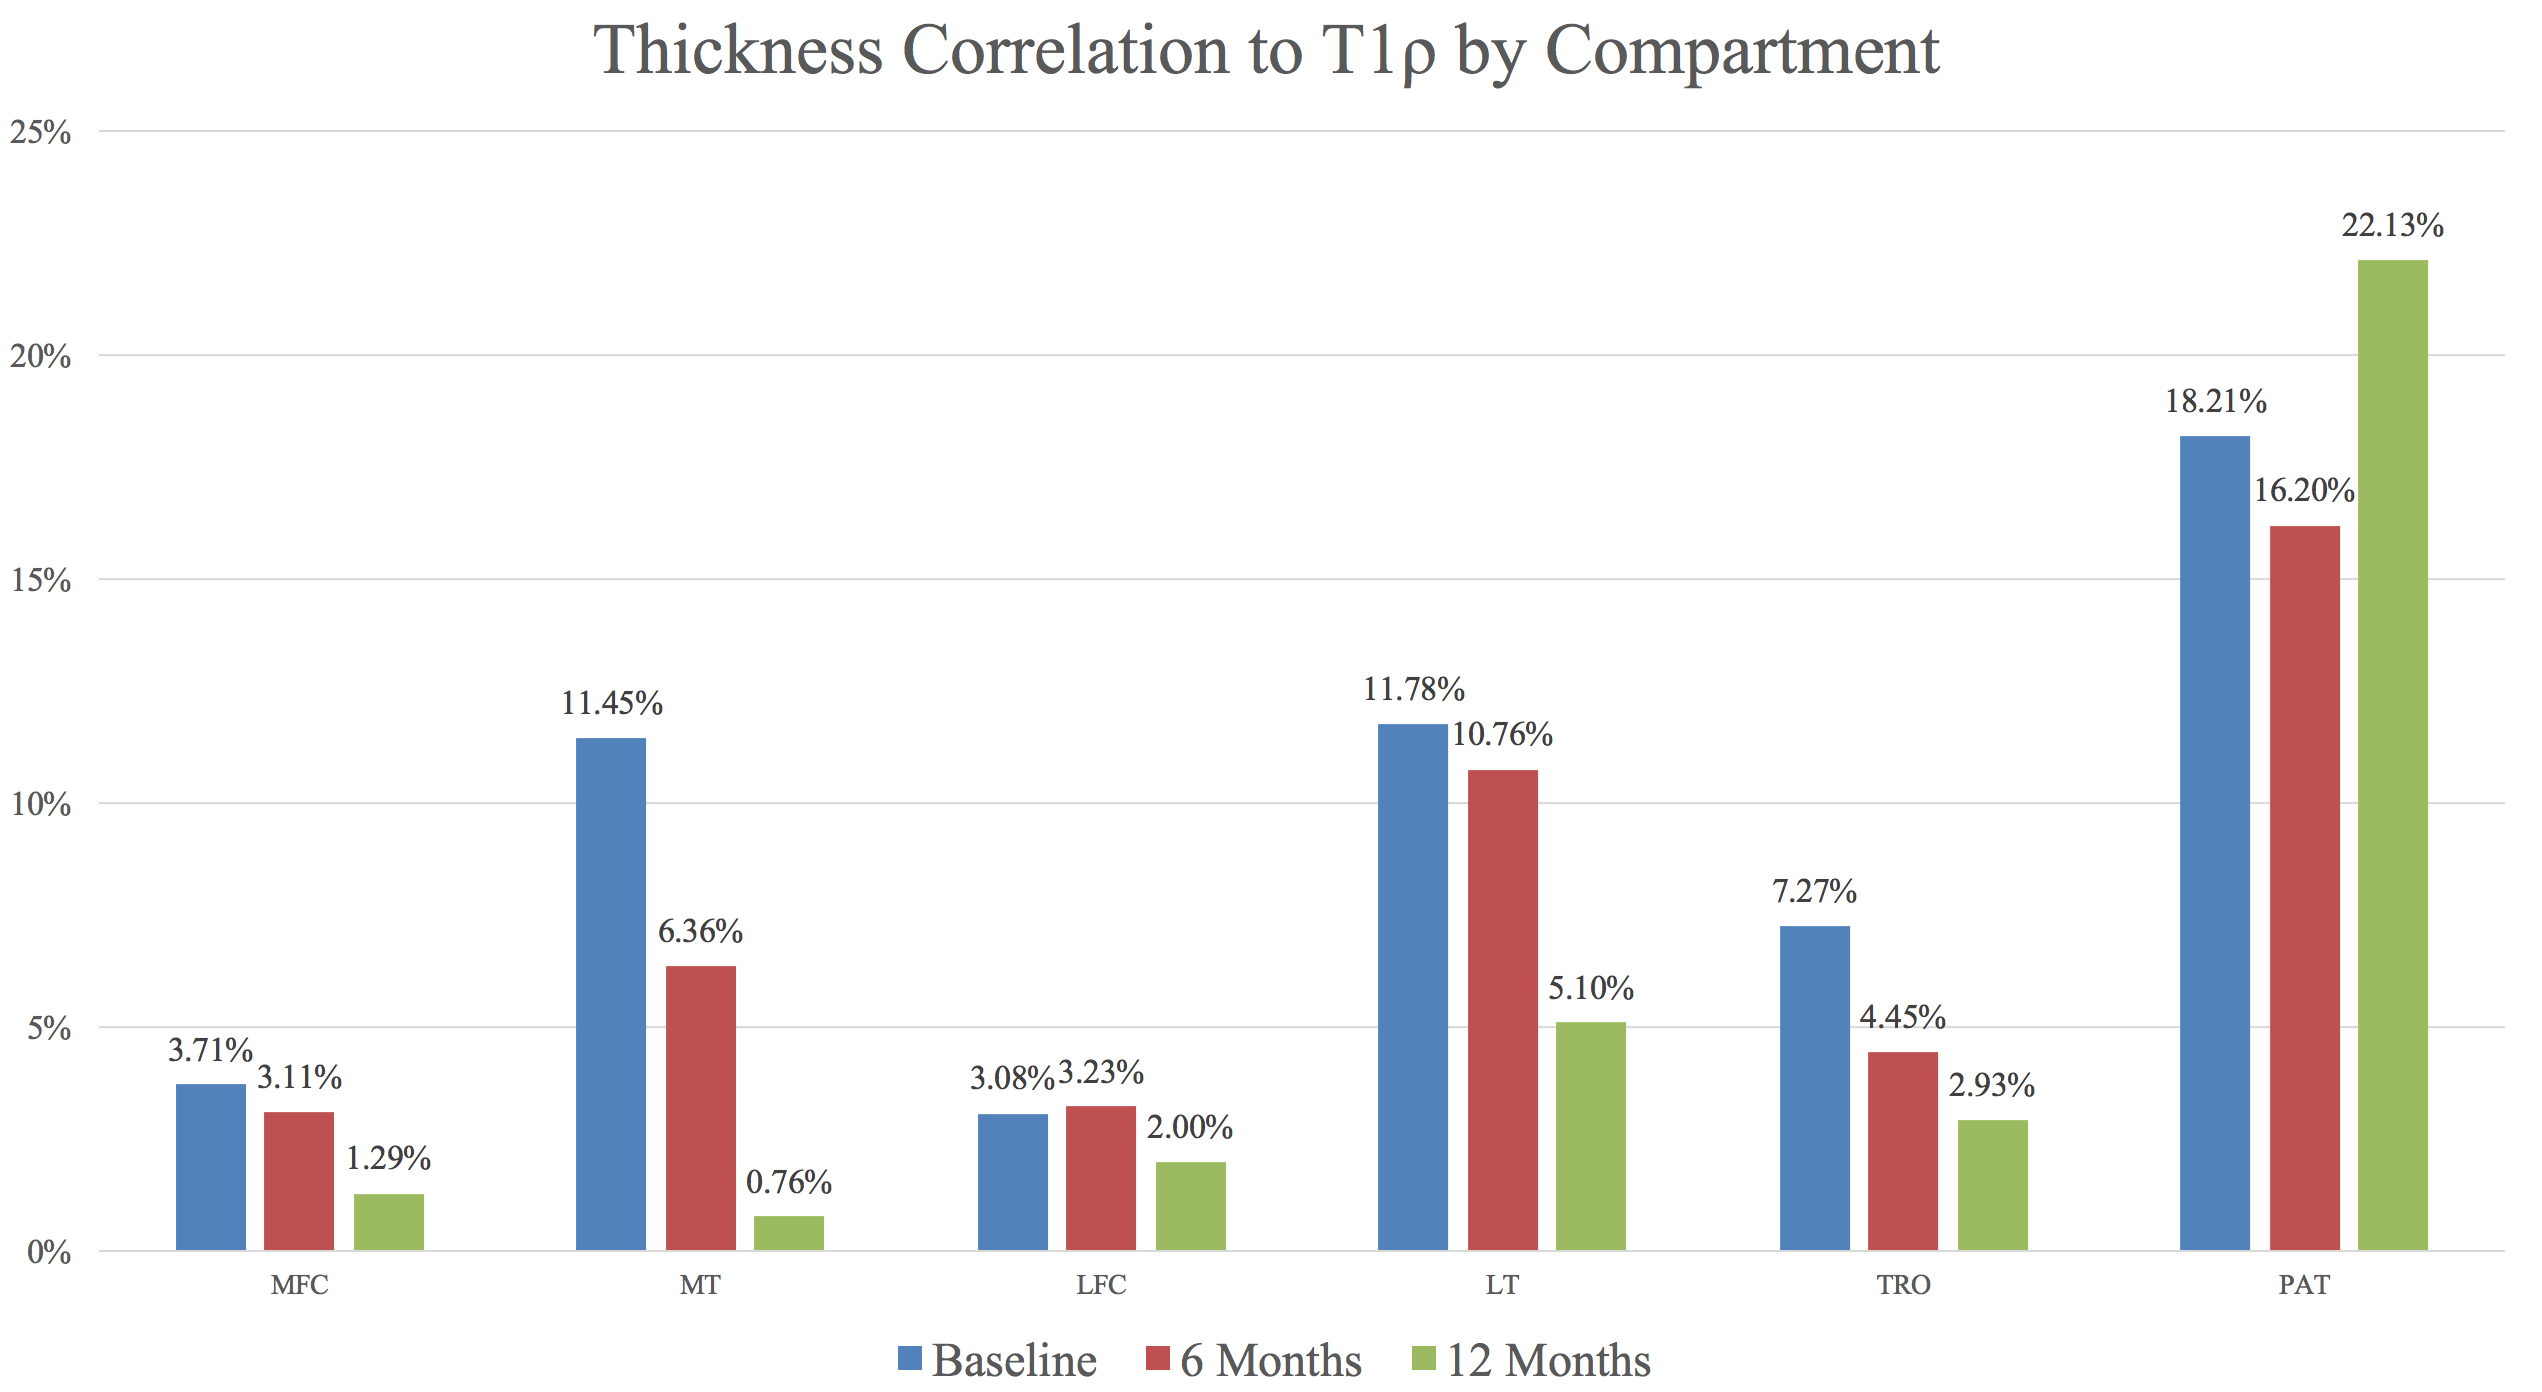
At the baseline scan, cross-sectional analysis (injured knee thickness vs. healthy contralateral knee thickness) showed all compartments except the patella with large regions of cartilage thickening in the injured side (Figures 1A and 2). Alternatively, most knee compartments at baseline showed little to no regions of cartilage thinning of the ACL-injured knee compared to the healthy contralateral knee, with PSV ranging from 0.0% in the medial tibia to 4.4% in the patella (Figures 1A and 2). At 12 months, cross-sectional analysis showed variable results, with many compartments showing a trend towards cartilage thickening while others showed trends towards thinning (Figures 1C and 2). In the analysis of the associations between morphology and relaxometry, patella compartment showed the highest correlation of thickness with T1ρ at all time points (Figure 3).Discussion
The results from this study quantifies the thickness changes at corresponding time points and evaluates correlations with T1ρ. Previous studies have shown transient elevations in T1ρ following injury, even in regions not directly involved in the mechanism of injury such as the medial femur and medial tibia.2 The diffuse cartilage thickening found at baseline suggests that these elevations in T1ρ may be due to the initial joint swelling and inflammation rather than a degenerative process leading to proteoglycan loss. Therefore, a combined assessment of local thickness and relaxation time may provide a more comprehensive imaging biomarker for post-traumatic osteoarthritis. At 6 months after ACL reconstructive surgery, there were fewer regions of cartilage thickening and more regions of cartilage thinning (Figure 1B). At 12 months, there was significant loss of cartilage in the posterior lateral tibia, a potentially significant site as it is directly involved in the “kissing contusion” mechanism of ACL injury.3Conclusion
Though the patella showed minimal increases in percent significant voxels of cartilage thickening both at the baseline scan following injury and in the 12 months following reconstruction (Figures 1A-1C), a strong correlation with T1ρ across all time points (Figure 3) suggest that the patella could potentially play a role in osteoarthritis risk stratification. Further analysis of the patella and other compartments with T1ρ ,T2, and KOOS scores may improve understanding of the risk factors and predictors of post-traumatic osteoarthritis.Acknowledgements
Thank you to the Heiman Family and the UCSF Heiman Research Fellowship for sponsoring Onyekachi Ezinna Nnabue and this research project.References
1. Barenius B, Ponzer S, Shalabi A, et al. 2014. Increased risk of osteoarthritis after anterior cruciate ligament reconstruction: a 14-Year follow-up study of a randomized controlled trial. Am J Sports Med 42:1049–1057.
2. Pedoia, V., et. al. Analysis of the articular cartilage T1ρ and T2 relaxation times changes after ACL reconstruction in injured and contralateral knees and relationships with bone shape. J. Orthop. Res., 35: 707–717. doi:10.1002/jor.23398
3. Li X, Kuo D, Theologis A, et al. Cartilage in Anterior Cruciate Ligament–Reconstructed Knees: MR Imaging T1ρ and T2—Initial Experience with 1-year Follow-up. Radiology. 2011;258(2):505-514. doi:10.1148/radiol.10101006.
Figures