1376
T2 and T1rho mapping of ankle cartilage of female and male ballet dancers1Radiological Sciences, University of California, Irvine, Irvine, CA, United States, 2Science and Health in Artistic Performance, Ohio University, Athens, OH, United States, 3Department of Dance, The Claire Trevor School of the Arts, University of California, Irvine, Irvine, CA, United States
Synopsis
This study demonstrated T2 and T1rho profiles of talar dome and tibial plafond cartilage from male and female ballet dancers using angular-segmentation methodology for quantitative assessment of cartilage in vivo. The results in this study showed both T2 and T1rho relaxation time indicated the lowest value over the central weight-bearing portion, while they indicated relatively higher values in the anterior and posterior portion. These findings can be due to the combination of the magic angle effect which has higher influence on T2 value and early cartilage degenerative changes which are more sharply detected by T1rho value.
Purpose
Many dancers begin their training long before skeletal maturity for years, which can lead to ankle arthritis in experienced dancers. Accurate and non-invasive assessment of early cartilage disease is important for young dancers. The purpose of this study was to demonstrate T2 and T1rho profiles and values of talar dome and tibial plafond cartilage in male and female ballet dancers, and compare them using an angle-dependent mapping approach for quantitative assessment of cartilage in vivo.Materials and Methods
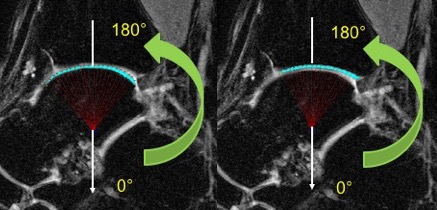
The study protocol was approved by the institutional review board, and all subjects gave written informed consent. Ten healthy female dancers (mean: 21.7 years old, range: 19-30) and 9 male dancers (mean: 23.1 years old, range: 18-40) were enrolled. Equal numbers of left and right ankles were scanned in the female group. Four right ankles and five left ankles were scanned in the male group. One left ankle of a male dancer was excluded because of incorrect angular position. All MR studies were performed on a 3T scanner (Achieva, Philips Healthcare, Netherlands) using an 8-channel, dedicated ankle/foot coil. Three sagittal images were acquired including fat suppressed (FS) proton density-weighted imaging (PDWI), T2 mapping, and T1rho mapping with true sagittal angulation parallel to the magnetic static field (B0). The acquisition parameters were as follows. FS PDWI: 2D turbo spin-echo; repetition time (TR)/echo time (TE)= 3958/30 ms, number of excitation (NEX)=1, and total acquisition time=2.5 minutes. T2 mapping: 2D turbo spin-echo; TR/TE=3000/13, 26, 39, 52, 65, 78, 91 ms, NEX=1 and total acquisition time=11 minutes. T1rho: 3D FS PROSET (PRinciple Of Selective Excitation Technique); TR/TE=7.5/3.8 ms, flip angle=10°, NEX=1, spin-lock frequency=575 Hz, time of spin-lock (TSL)= 0, 10, 20, 40, and 80 ms, and acquisition time=3 minutes 51 seconds for each TSL. All images were obtained with field of view (FOV)=140x140mm, slice thickness/gap=3/0 mm, image matrix=512×512, and number of slices=20. Manual cartilage segmentation of the talar and tibial cartilage on T2 and T1rho images was performed by a radiologist using MIPAV software (http://mipav.cit.nih.gov). T2 and T1rho angle-dependent profiles of the talar and tibial cartilage were created from the five-middle segmented-slices in each ankle by angular segmentation in steps of 4-degrees over the length of the segmented cartilage1,2 with the angle 0 defined along B0 as shown in Figure 1. Mean thickness and volume of the talar and tibial cartilage were estimated using the five-middle segmented-slices and the entire segmented-slices, respectively. The angular T2 and T1rho profiles were compared between male and female dancers using the first, third, and fifth slices of five segmented-slices defined as medial, middle, and lateral slice, respectively. Both angular segmentation and profile generation were performed using a custom program prepared in Matlab (MathWorks, Natick, USA).Results
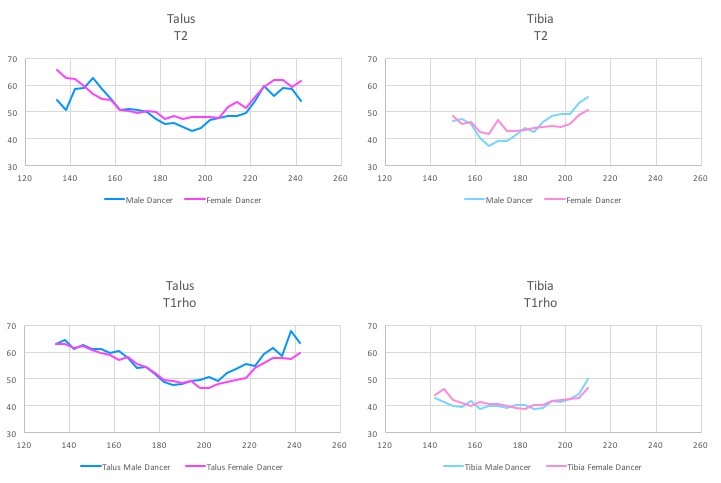
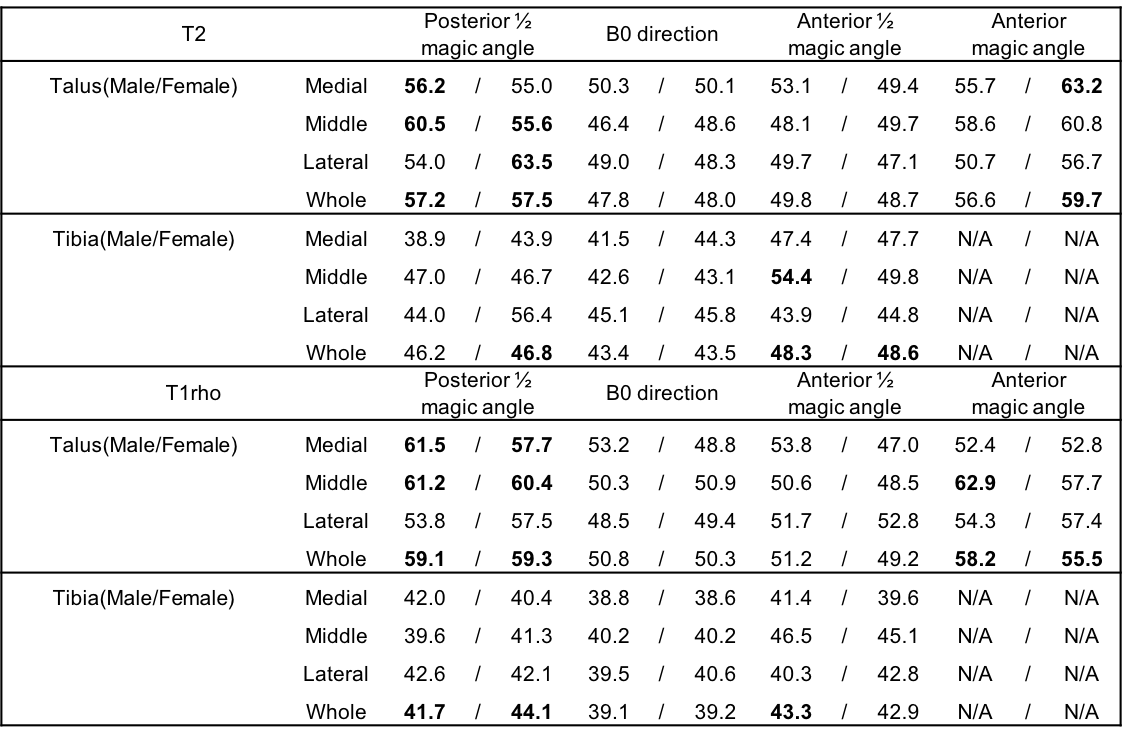
Mean thickness and volume of the talar and tibial cartilage were shown in Table 1. T1rho demonstrated thicker cartilage and larger cartilage volume measurements in comparison to those of T2 for both male and female dancers because deep cartilage was dark similar to the subchondral bone plate on T2 mapping leading to underestimation. Male dancers showed thicker cartilage and larger cartilage volume than female dancers. The angular T2 and T1rho profiles in the middle slice were shown in Figure 2. Average T2 and T1rho value in posterior 1/2 magic angle (150-154°), B0 direction (178-182°), anterior 1/2 magic angle (206-210°) and anterior magic angle (234-238°) were evaluated in Table 2. There were no significant differences in both T2 and T1rho profiles between female and male dancers. Tibial cartilage tended to yield lower T2 and T1rho values than talar cartilage. Both talar and tibial cartilages demonstrated angular-dependent T2 and T1rho profiles. T2 and T1rho values of talar and tibial cartilage indicated the lowest values from the angular range of approximately 180°±20°, which corresponded to the central weight-bearing portion of talar dome and tibial plafond. T2 and T1rho values of talar and tibial cartilage tended to be higher at closer angle to the magic angle.Conclusion
This study demonstrated an angular-dependent T2 and T1rho profiles and values of talar and tibial cartilage in female and male ballet dancers. T2 value was shown to be more largely influenced by magic angle effect, while T1rho was less prone to be influenced by it2,3. On the other hand, T1rho value was shown to be more sensitive to early cartilage degeneration than T2 value4. Therefore, increased T2 and T1rho values over the anterior and posterior portion of the talar dome and tibial plafond in dancers can be due to the combination of the magic angle effect and early cartilage degeneration.Acknowledgements
No acknowledgement found.References
1. Yu HJ, Luk A, Ton J, et al. Comparison of T2 and T1r mapping of the ankle cartilage between young healthy females and dancers. 26 April, 2017, 25th Annual Meeting & Exhibition (ISMRM), Honolulu. (#5106)
2. Nozaki T, Kaneko Y, Yu HJ, et al. Comparison of T1rho imaging between spoiled gradient echo (SPGR) and balanced steady state free precession (b-FFE) sequence of knee cartilage at 3 T MRI. Eur J Radiol. 2015;84:1299-1305.
3. Kaneko Y, Nozaki T, Yu HJ, et al. Normal T2 Map Profile of the Entire Femoral Cartilage Using an Angle/Layer-Dependent Approach. J Magn Reson Imaging. 2015;42:1507-1516
4. Choi JA, Gold GE. MR imaging of articular cartilage physiology. Magn Reson Imaging Clin N Am. 2011;19:249-282.
Figures