1375
Magnetization Transfer Ratio (MTRNOE) as a Biomarker of Hip Osteoarthritis1Radiology & Biomedical Imaging, University of California, San Francisco, San Francisco, CA, United States, 2Orthopaedic Surgery, University of California, San Francisco, San Francisco, CA, United States, 3Physical Therapy, University of California, San Francisco, San Francisco, CA, United States
Synopsis
Loss of cartilage collagen, proteoglycans (PG), glycosaminoglycans (GAG) are responsible for osteoarthritis (OA). MRI biomarkers T2 (sensitive to collagen), magnetization transfer (MT) and T1ρ, (sensitive to PG), and GAGCEST (sensitive to GAG) can detect OA at early stages. Similar to GAGCEST, CEST signal of Nuclear Overhauser Effect (NOECEST) at -1.6ppm also changes with OA. However, unlike GAGCEST, this NOECEST is measurable at 3T which is suitable for
Introduction
Hip osteoarthritis (OA) causes significant pain and disability in patients. The loss of cartilage’s extra-cellular components, i.e. collagen, proteoglycans (PG) and glycosaminoglycans (GAG), is largely responsible for the degradation of hip joint cartilage and eventually OA. Measuring cartilage GAG content with chemical exchange saturation transfer (CEST) at 7T has been shown to correlate with OA1. At 3T however, GAG protons are in fast exchange with water and thus their CEST signal cannot be quantified. NMR spectroscopy of human cartilage with and without OA has shown that OA leads to significant change in the spectrum up-field from water2,3, which generate CEST signal through Nuclear Overhauser Effect (NOE)4. Several studies have also shown that an NOE peak at -1.6ppm is detectable in CEST experiments5 which also coincides with the frequency offset of the metabolites in cartilage that change significantly with OA. In addition, loss of macromolecular content of cartilage (collagen, PG) in OA leads to a change in its MT effect6. Cartilage T2 is longer in OA7 which result in narrowing of the direct effect in cartilage CEST spectrum. We hypothesize MTR at offset frequencies around -1.6ppm (MTRNOE) reflects the combination of all of the above-mentioned changes (NOE,MT,T2) and is a potential biomarker for hip OA at 3T.Materials & Methods
MTRNOE decreases in OA due to:
1)Line-narrowing resulting from increase in T2,
2)Decrease in MT due to loss of macromolecular content (mostly collagen)
3)Decrease in CESTNOE (for [-1ppm,-1.7ppm]).
Subjects: 39 hips of (26 subjects) were scanned (13M/13F, Age:52±14years, BMI=25.1±3.5Kg/m2) with IRB approval. Hips with radiographic score Kellgren Lawrence (K-L)<2 were considered healthy control (n=29) and K-L>=2 was considered OA (n=10).
MRI was performed on a 3T GE scanner (using 32-channel coil). A 3D segmented SPGR sequence was used for CEST,WASSR,T1ρ,T2 imaging with: FOV=14cm2, Thickness=4mm, 14slices, TR=6ms,FA=10,ARC=2x1, segment length=64.
CEST preparation included 5 Gaussian RF pulses (each pulse: duration=80ms, B1rms=2μT), and was acquired for offsets: [-1.8ppm,0.6ppm] and [0.6ppm,1.8ppm] with 0.12ppm increments and a reference image at 780ppm.
WASSR preparation involved 3 Gaussian pulses (each pulse: duration=80ms, B1rms=0.2μT), and was acquired for offsets frequencies [-0.42ppm,0.42ppm] with 0.06ppm increments. Composite T1ρ/T2 imaging was performed with Spin-Lock frequency=300Hz, TSL=0/15/30/45ms, and TE=0/10.4/20.8/41.7ms8,7.
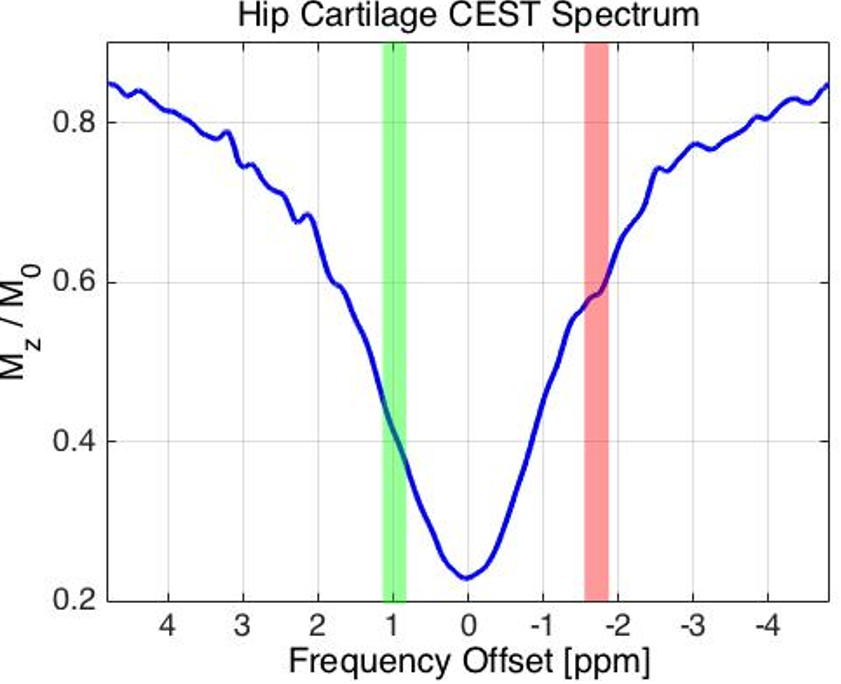
Analysis: T1ρ/T2 maps were calculated by fitting a mono-exponential curve to data. CEST spectrum was B0 corrected (WASSR) and then normalized to reference image. The MTRNOE was calculated by averaging CEST spectrum for the offsets [-1.5ppm,-1.7ppm]. MTRGAG was also calculated by averaging CEST spectrum in [0.9ppm,1.1ppm].
Results
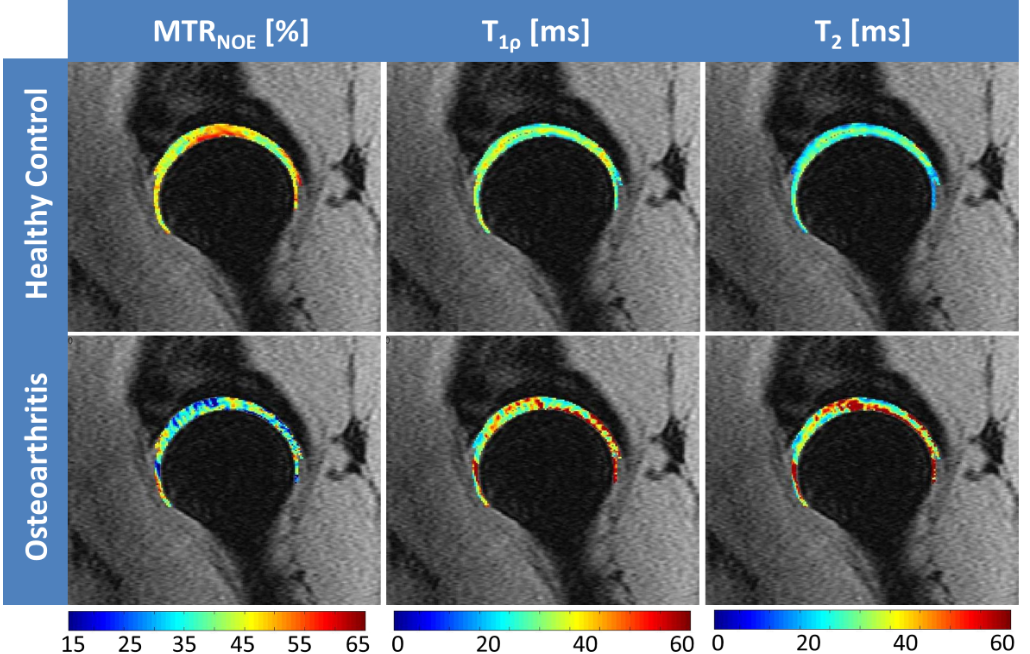
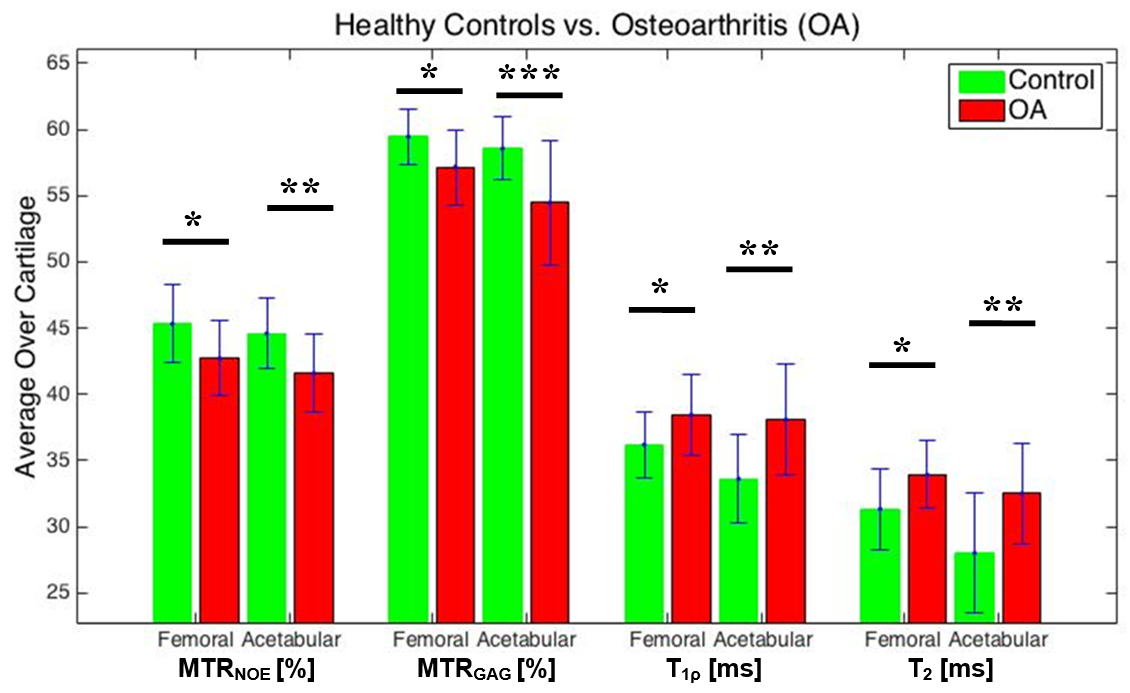
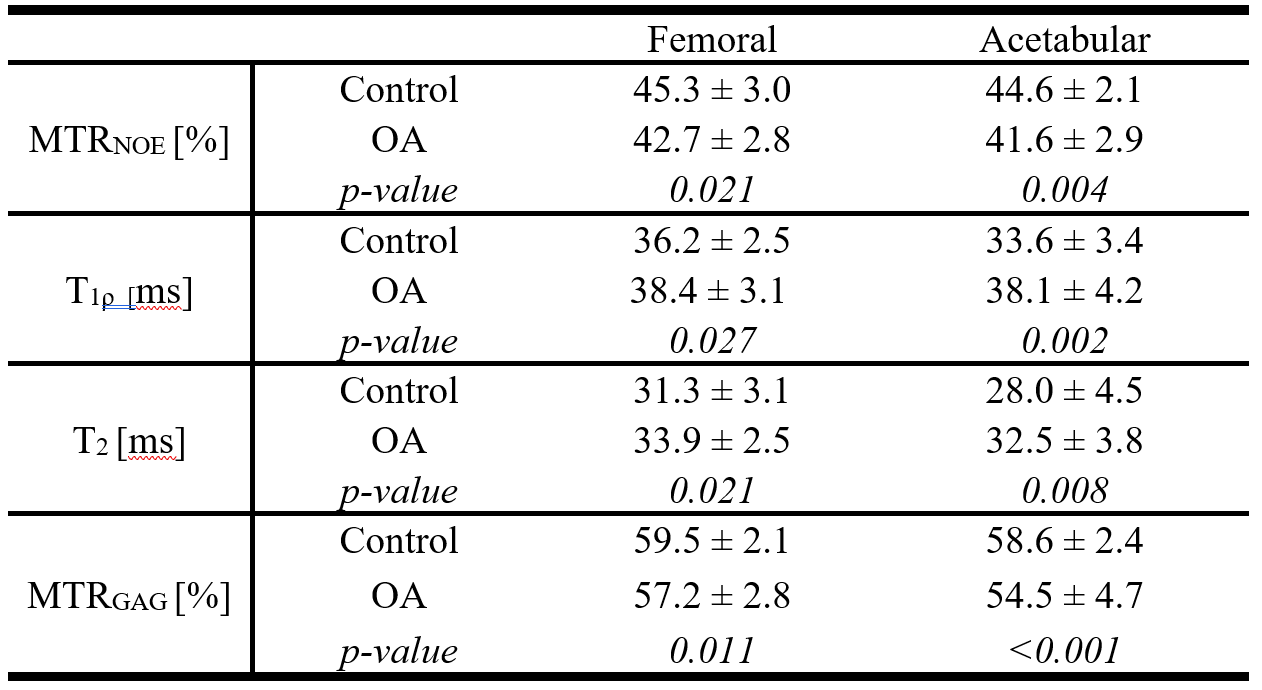
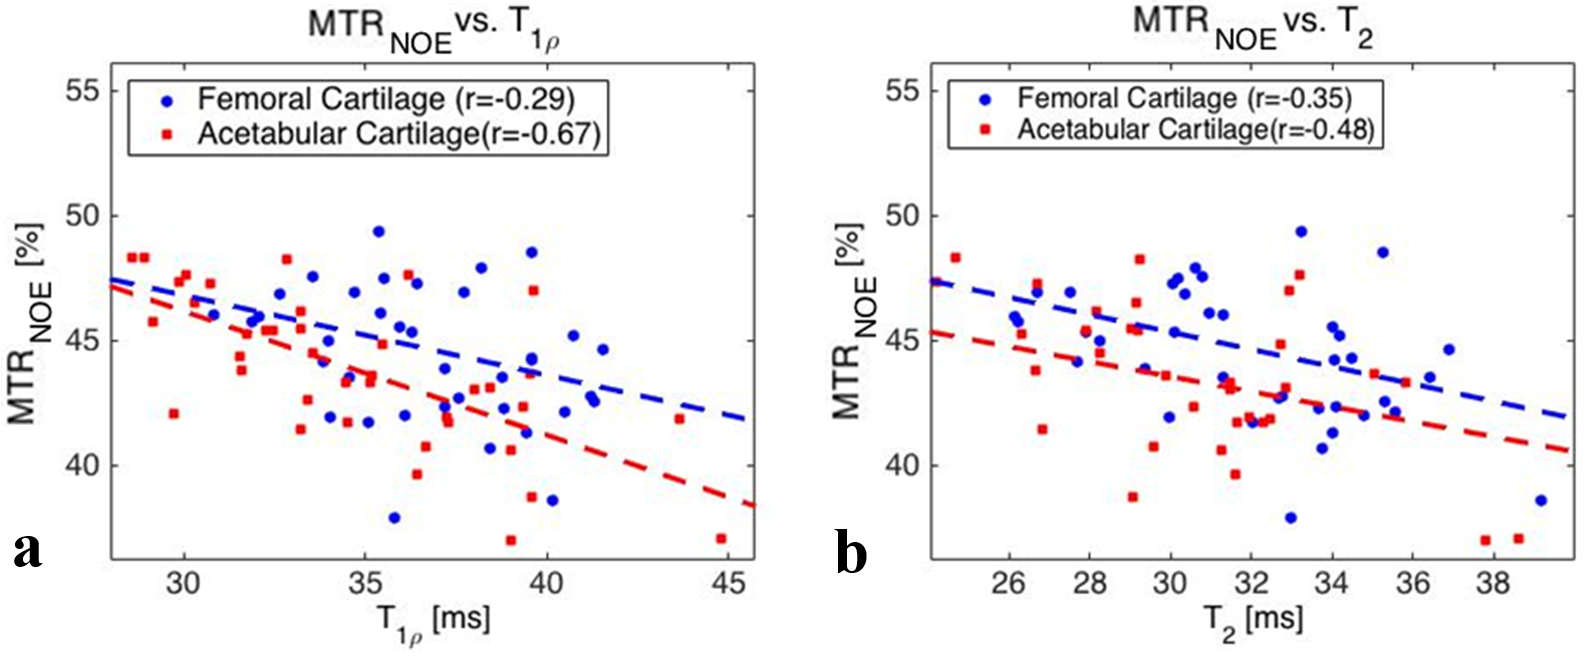
All images (T1ρ,T2,CEST,WASSR) were co-registered to the first echo of the T1ρ data. Four slices at the center of the imaging volume were selected, then femoral and acetabular cartilages were identified on each slice. Each metric was calculated voxel-by-voxel and then averaged over the entire cartilage (femoral and acetabular). CEST spectrum of a representative case is shown in Figure1. Figure2 illustrates representative MTRNOE,T1ρ/T2 maps (overlaid on first echo of T1ρ) for a healthy control and OA subjects showing lower MTRNOE and increased T1ρ/T2 in OA subject compared to control. Table1 and Figure3 report each metric for controls and OA subjects. The correlation between MTRNOE and T1ρ and T2 are shown in Figure4 (average over each cartilage).Discussions
Figure1 shows the GAGCEST peak is indistinguishable from water peak as these two pools are in fast exchange at 3T. The widening of water spectrum (at offsets>0) due to GAG can also be observed in this figure. However, MTRGAG is capable of separating the controls from OA (Table1). This spectrum also shows the NOE peak around -1.6ppm.
There was statistically significant differences between MTRNOE of OA and control cohorts for both cartilages. MTR metrics represent the combination of changes in MT, T2, CEST, and considering healthy subjects could be separated from OA similarly with MTRGAG and MTRNOE (which share the MT and T2 component), the majority of changes in OA are accounted for in these components that reflect the cartilage collagen and PG. A larger population is needed to determine how significant the contribution of NOE peak of CEST is in diagnosis of OA.
Finally (as expected7), T1ρ and T2 of entire cartilage were higher in OA, and provided statistically significant separation of the two cohorts. There was also high correlations between MTRNOE and T1ρ and T2 measured for both cartilages (Figure4). The similarity in spatial distribution of MTRNOE, T1ρ and T2 (Figure1) also show that these parameters may be providing complementary information about cartilage degeneration in OA.
Conclusions
MTRNOE of hip cartilage is capable of differentiating hip OA from healthy controls and could provide complementary information to the already established metrics such as T1ρ and T2.Acknowledgements
This study was funded by NIH R01AR069006.References
1. Shet, K. et al. High-resolution magic angle spinning NMR spectroscopy of human osteoarthritic cartilage. NMR Biomed. 25, 538–544 (2012).
2. Ling, W., Regatte, R. R., Schweitzer, M. E. & Jerschow, A. Characterization of bovine patellar cartilage by NMR. NMR Biomed. 21, 289–295 (2008).
3. Ling, W., Regatte, R. R., Navon, G. & Jerschow, A. Assessment of glycosaminoglycan concentration in vivo by chemical exchange-dependent saturation transfer (gagCEST). Proc. Natl. Acad. Sci. U. S. A. 105, 2266–2270 (2008).
4. Wachsmuth, L., Juretschke, H. P. & Raiss, R. X. Can magnetization transfer magnetic resonance imaging follow proteoglycan depletion in articular cartilage? Magn. Reson. Mater. Physics, Biol. Med. 5, 71–8 (1997).
5. Li, X., Han, E. T., Busse, R. F. & Majumdar, S. In vivo T1?? mapping in cartilage using 3D magnetization-prepared angle-modulated partitioned k-space spoiled gradient echo snapshots (3D MAPSS). Magn. Reson. Med. 59, 298–307 (2008).
6. Wyatt, C. et al. Cartilage T1rho and T2 Relaxation Times in Patients With Mild-to-Moderate Radiographic Hip Osteoarthritis. Arthritis Rheumatol. 67, 1548–1556 (2015).
Figures