1374
Detailed T2-mapping analysis reveal disc characteristics that may be of significance for low back pain patients1Dept. of Medical Physics and Techniques, Sahlgrenska University Hospital, Gothenburg, Sweden, Institute of Clinical Sciences, Sahlgrenska Academy, University of Gothenburg, Gothenburg, Sweden, Gothenburg, Sweden, 2Dept. of Radiology, Sahlgrenska University Hospital, Gothenburg, Sweden, Institute of Clinical Sciences, Sahlgrenska Academy, University of Gothenburg, Gothenburg, Sweden, Gothenburg, Sweden, 3Dept. of Orthopaedics, Sahlgrenska University Hospital, Gothenburg, Sweden., Institute of Clinical Sciences, Sahlgrenska Academy, University of Gothenburg, Gothenburg, Sweden, Gothenburg, Sweden
Synopsis
In this study, we address the lack of studies comparing intervertebral disc characteristics between symptomatic and asymptomatic individuals. Based on quantitative T2-mapping, small but relevant differences between low back pain patients and a control cohort were found on a global and regional level.
Introduction
Intervertebral disc (IVD) degeneration can be evaluated by conventional 1 and functional MRI 2. Both can provide objective continuous IVD-degeneration measures when evaluated with quantitative morphometric 3,4 and innovative histogram analysis 5. However, the exact relation between IVD-degeneration and low back pain (LBP) is not fully elucidated and there are limited studies comparing detailed quantitative IVD characteristics of symptomatic and asymptomatic individuals.
As the IVD tissue display regional variation in T2-relaxation time and both biomechanical load and degeneration often are unevenly distributed 6, it is desirable to investigate the IVD on a more detailed regional scale.
The aim was to analyse T2-maps in detail to find differences in IVD tissue characteristics between LBP-patients and asymptomatic individuals.
Materials and Methods
Twenty-five LBP-patients (124 IVDs, 20 of which have HIZ, 11 males, mean 38y, range 25-69y) and 12 matched controls (59 IVDs, 4 of which have HIZ, 7 males, mean 38y, range 25-59y) were examined with T2-mapping on a 1.5T MRI scanner (Siemens Magnetom Aera, Erlangen, Germany). All IVDs were graded twice with the Pfirrmann score 7 by an experienced radiologist.
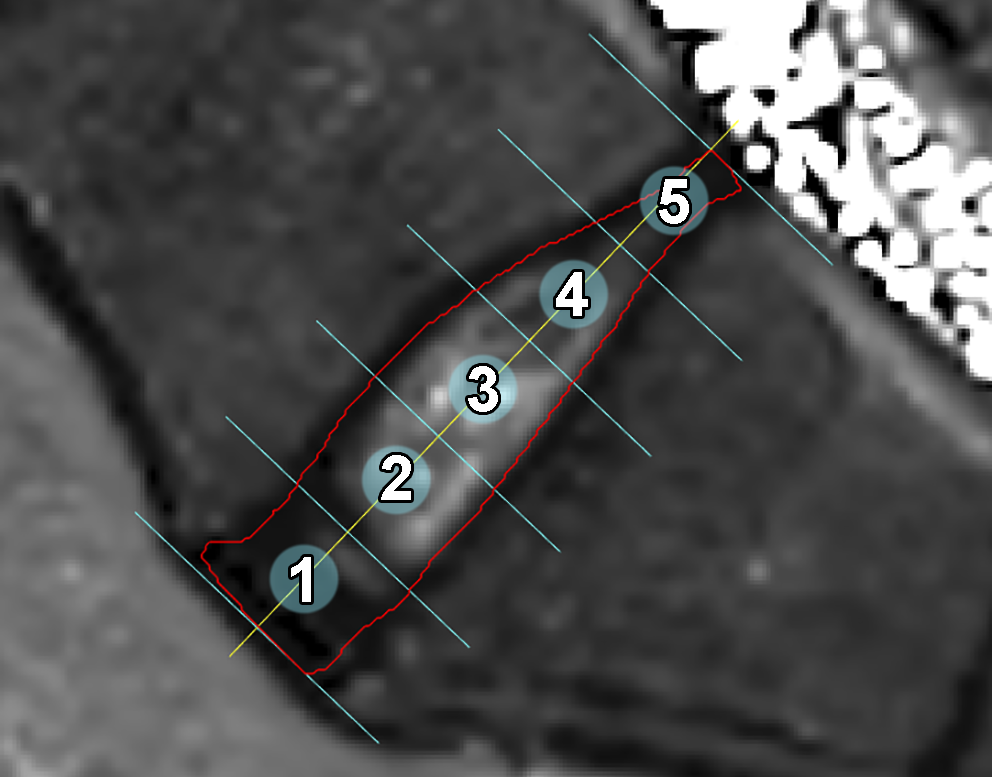
For all IVDs, the mean T2-values and standard deviations (SD) were analysed globally and regionally (Figure 1). Histogram analysis, proposed by Waldenberg et al.5, was also performed to provide additional quantitative metric (Δµ) describing the IVD tissue structure.
Statistical significance between groups was determined with Mann-Whitney U-test at P<0.05, except for Pfirrmann grade 5 due to too small sample size.
Results
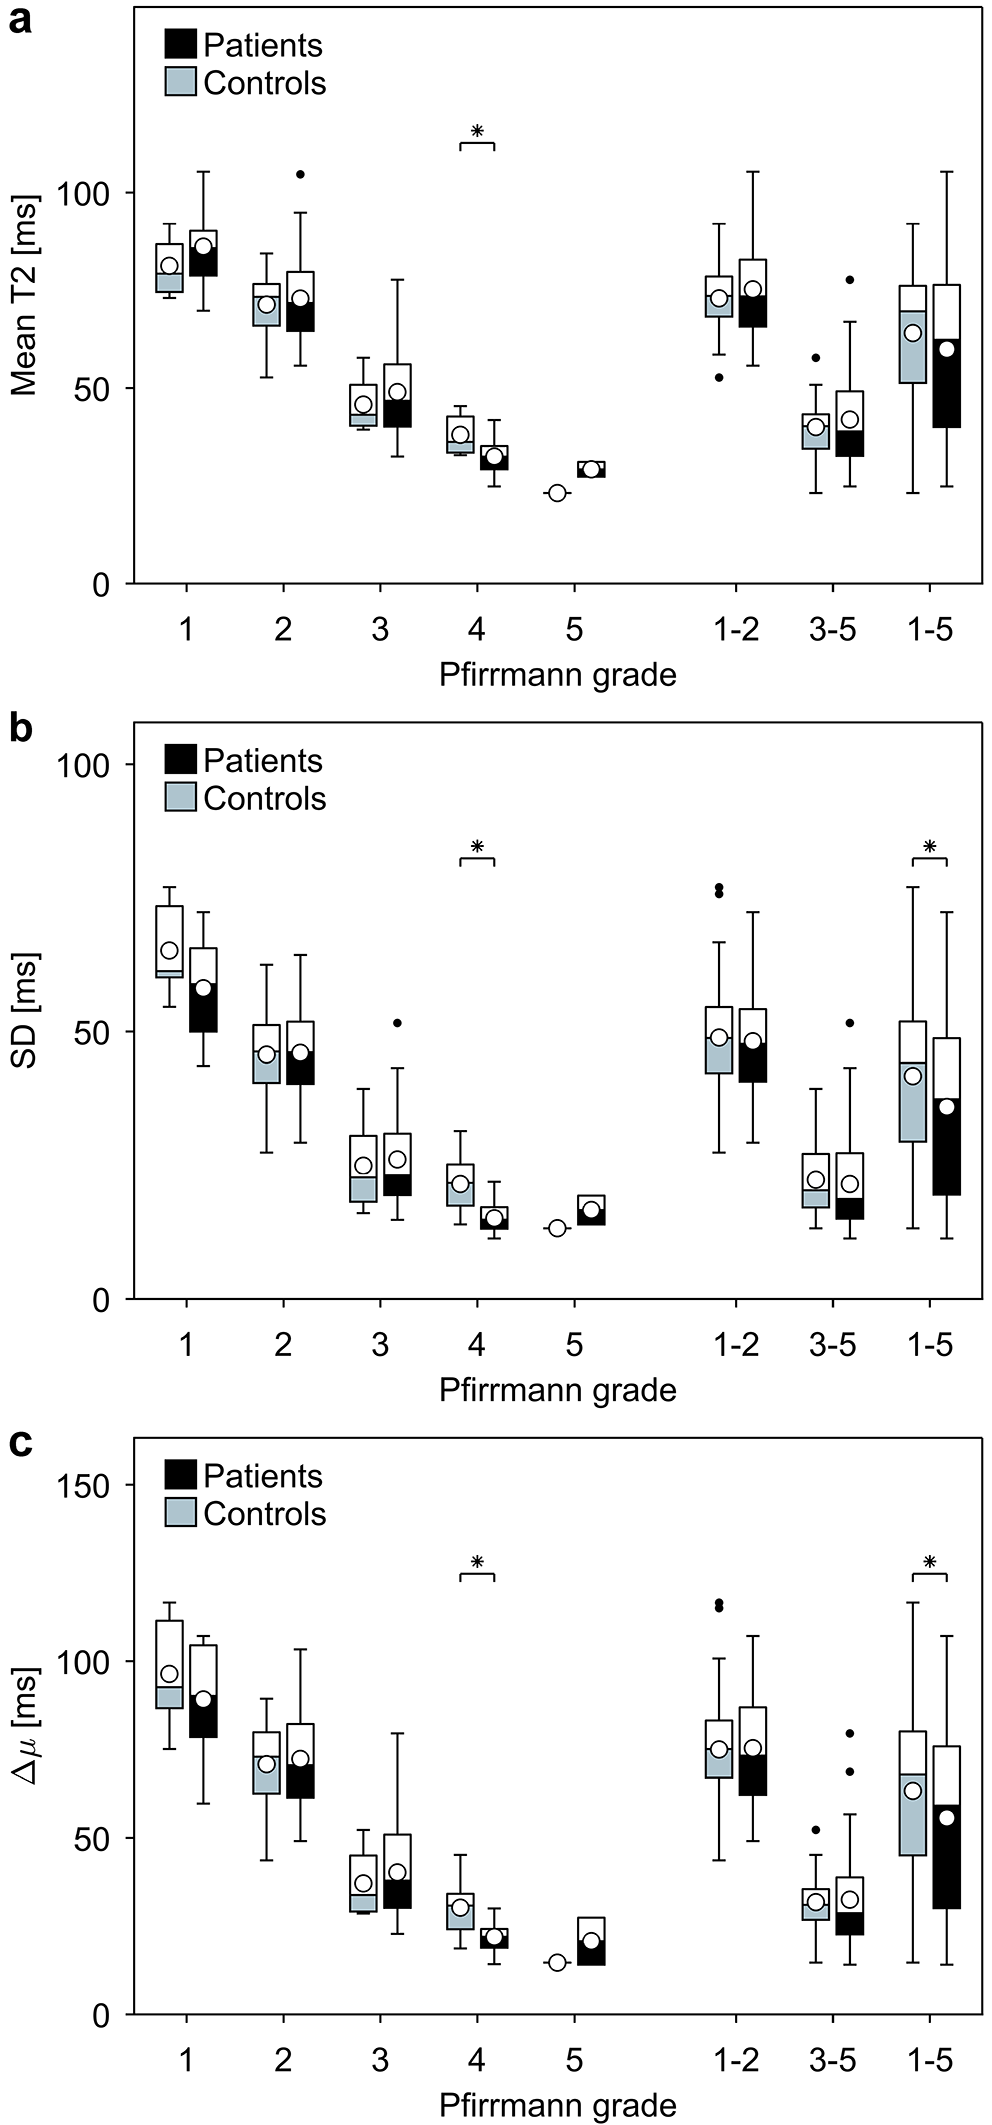
For both patients and controls, the global IVD T2-relaxation time, SD and Δµ all decreased with increased degeneration (Figure 2). For all these investigated metrics, significant difference between patients and controls was found for IVDs with Pfirrmann grade 4. After re-scoring of Pfirrmann (κ = 0.74), significance for all metrics was also found for Pfirrmann grade 3.
Compared to controls, patient IVDs generally reached lower median and mean values for all metrics, with significant differences for SD and Δµ.
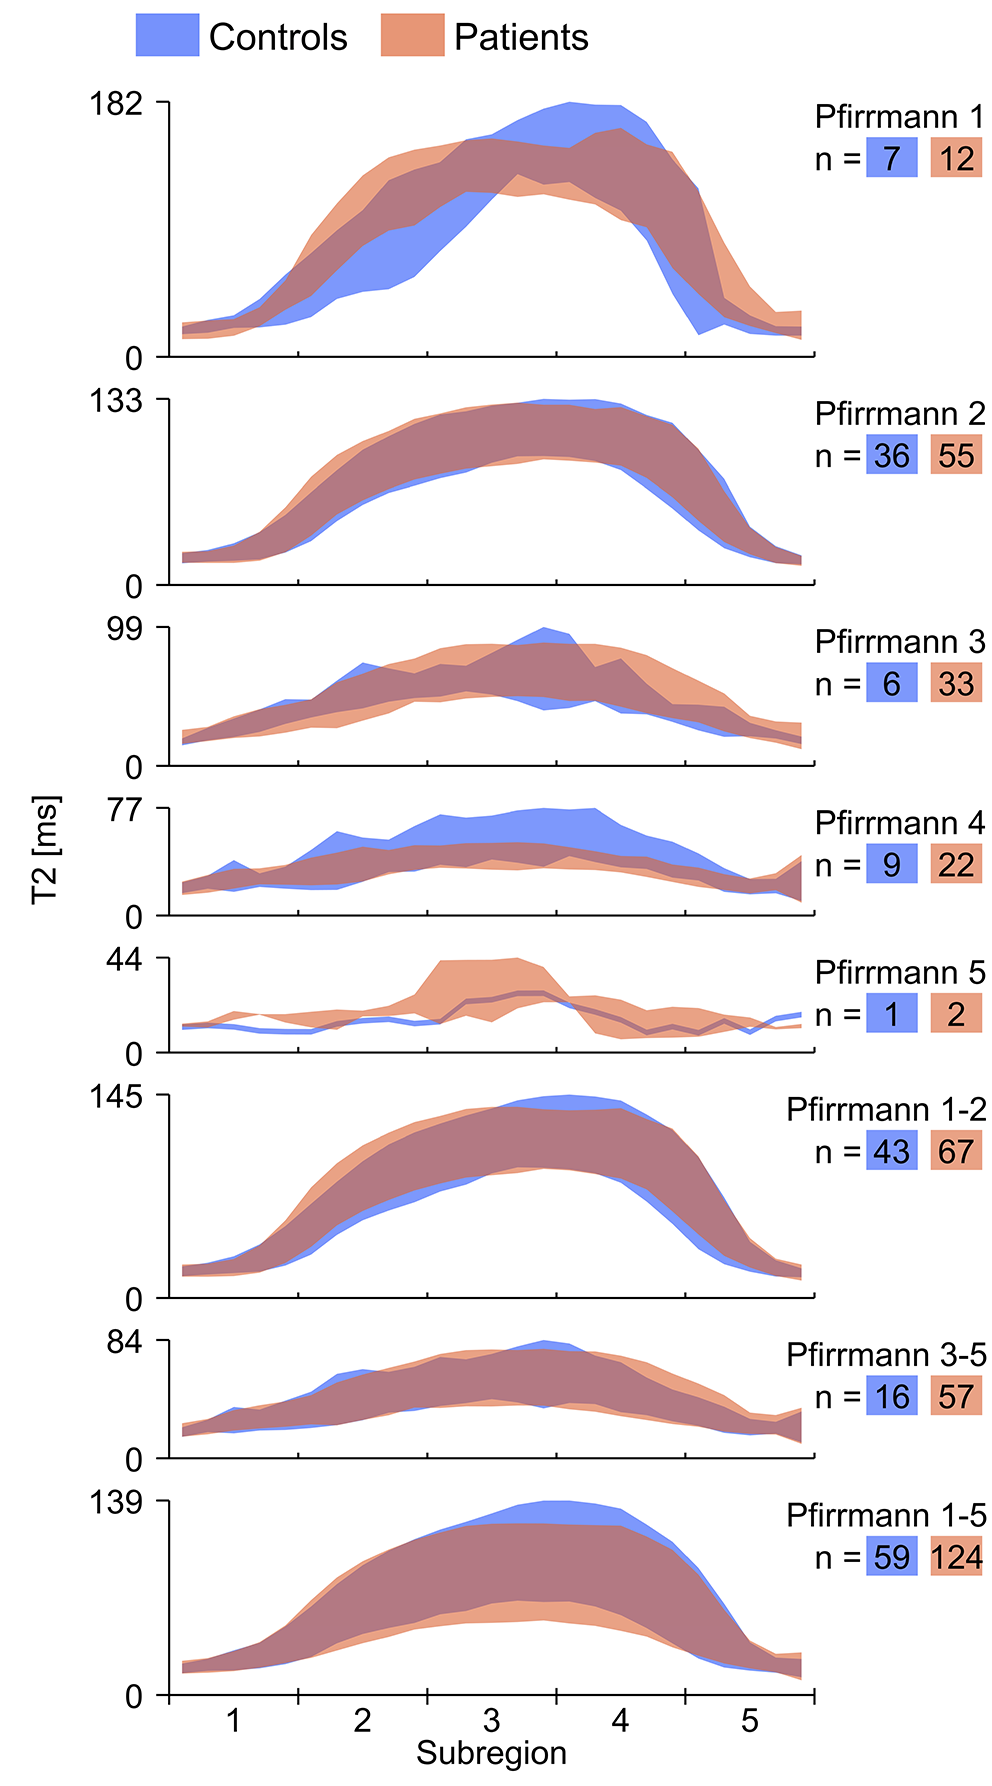
Regional analysis revealed significant differences between patients and controls in regions with the highest T2-relaxation time, i.e. subregion 3 and 4 (Figure 3).
Discussion
This study, analysing quantitative IVD characteristics, found on a global and regional level small but relevant quantitative IVD differences between patient and control cohorts.
Significant differences between patients and controls were found for IVDs with Pfirrmann grade 4 that might reflect tissue characteristics related to LBP. However, the Pfirrmann grading is based on visual interpretation and as such the result may reflect interpreter sensitivity. Nonetheless, comparing all patient’s IVDs to all control’s IVDs, regardless of Pfirrmann grade, significant differences in sub-regions occupied by nucleus pulposus (NP) (3 and 4) were found. The lower T2-values found in these regions might reflect disturbed nutrient transport 8, which in turn might alter the tissue composition of the NP 9. Such effect could be directly related to LBP but could also be a consequence of LBP, e.g. LBP-patients may have a reduced physical activity and, hence, reduced nutrition transport 10. Large-scale interventional studies should be conducted to strengthen the conclusion.
Besides exploring differences between patients and controls, this study shows, on a group and individual level, that the regional T2-value variation is a promising marker for disc status. The variation in T2-value over the IVD follows a general pattern with low T2-values at the anterior and posterior sub-regions and the highest T2-value located slightly off-center towards the posterior side. Changes in this behaviour may reveal individual patterns of significance.
Conclusion
Both the global and histogram analysis of T2-maps reflected IVD-degeneration. However, a more detailed regional analysis revealed differences between LBP-patients and controls that might reflect functional differences.Acknowledgements
The authors acknowledge the financial support from C4I center, Sahlgrenska University Hospital and the Innovation Fund, The region of West Sweden.References
1. Luoma, K., et al., Low back pain in relation to lumbar disc degeneration. Spine, 2000. 25(4): p. 487-492.
2. Jenkins, J.P., et al., MR imaging of the intervertebral disc: a quantitative study. Br J Radiol, 1985. 58(692): p. 705-9.
3. Videman, T., et al., A new quantitative measure of disc degeneration. Spine J, 2017. 17(5): p. 746-753.
4. Teichtahl, A.J., et al., A Dose–response relationship between severity of disc degeneration and intervertebral disc height in the lumbosacral spine. Arthritis Research & Therapy, 2015. 17: p. 297.
5. Waldenberg, C., et al., MRI histogram analysis enables objective and continuous classification of intervertebral disc degeneration. European Spine Journal, 2017.
6. Bogduk, N., C. Aprill, and R. Derby, Lumbar discogenic pain: state-of-the-art review. Pain Med, 2013. 14(6): p. 813-36.
7. Pfirrmann, C.W., et al., Magnetic resonance classification of lumbar intervertebral disc degeneration. Spine (Phila Pa 1976), 2001. 26(17): p. 1873-8.
8. Urban, J.P., S. Smith, and J.C. Fairbank, Nutrition of the intervertebral disc. Spine (Phila Pa 1976), 2004. 29(23): p. 2700-9.
9. Iatridis, J.C., et al., Alterations in the mechanical behavior of the human lumbar nucleus pulposus with degeneration and aging. J Orthop Res, 1997. 15(2): p. 318-22.
10. Belavy, D.L., et al., Running exercise strengthens the intervertebral disc. Sci Rep, 2017. 7: p. 45975.
Figures