1373
Associations between Osteoarthritis Molecular Biomarkers and MR-based cartilage composition and Knee Joint Morphology: Data from the Osteoarthritis Initiative1Department of Radiology and Biomedical Imaging, University of California, San Francisco, San Francisco, CA, United States, 2Department of Epidemiology and Biostatistics, University of California, San Francisco, San Francisco, CA, United States, 3Department of Rheumatology, University of California, Davis, Davis, CA, United States
Synopsis
This study assessed the relationships of serum/urine biomarkers for osteoarthritis with MR imaging measures of joint structure and composition, using data from the Osteoarthritis Initiative (OAI). Significant positive correlations between the serum/urine biomarkers (sHA, sMMP3) and MRI cartilage T2 relaxation time measurements, compositional markers of early cartilage degeneration were observed. However, no significant associations were found with cartilage morphology or Kellgren-Lawrence (KL) grade. Therefore, serum biomarkers and cartilage T2 composition may reflect similar features of the pathophysiology of cartilage matrix degenerative disease.
Introduction:
Osteoarthritis (OA) is a degenerative joint disease that often leads to total knee replacement. Subjects with early stage OA could benefit from preventive measures such as lifestyle modification that may slow progression of disease. Various methods for identifying subjects at risk for OA have been proposed including serum/urine biomarkers [1, 2] and advanced MR imaging including cartilage T2 mapping (that quantifies degenerative cartilage compositional change). The purpose of this study was to assess the relationships of serum/urine biomarkers for OA with MR imaging measures of joint structure and composition, using data from the Osteoarthritis Initiative (OAI).Methods:
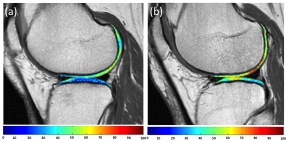
This study utilized data from the OAI, a multi-center study aimed at assessing biomarkers in OA. Subjects in this study are a subset of those included in the Foundation for the National Institutes of Health (FNIH) Biomarkers Consortium study, which assessed serum and urine OA biomarkers. For the present study, we analyzed 141 subjects that had a KL score ≤ 3 in the right knee. We analyzed four biochemical markers: serum cartilage oligomeric matrix protein (sCOMP), serum hyaluronan (sHA), serum matrix metalloproteinase-3 (sMMP3), and urine carboxy-terminal telepeptides of type II Collagen (uCTXII). MR images were obtained using 3.0 Tesla (Siemens Magnetom Trio, Erlangen, Germany) scanners. The following sequences were acquired: sag. 2D IW FSE (TR/TE=3200/30ms, spat. res.=0.357mmx0.511mm, slice th.=3.0mm), cor. 2D PD FSE (TR/TE=3700/29ms, spat. res.=0.365mmx0.456mm, slice th.=3.0mm), and sag. 3D DESS (TR/TE=16.3/4.7ms, spat. res.=0.365mmx0.456mm, slice th.=0.7mm) and were used for Whole-organ Magnetic Resonance Imaging Scores (WORMS). A sag. 2D MSME sequence (TR=2700ms, TE1-TE7=10-70ms, spat. res.=0.313mmx0.446mm, slice th.=3.0mm) was used for cartilage T2 measurements. T2 maps in six regions (patella, lateral femur, lateral tibia, medial femur, medial tibia) were computed on a pixel-by-pixel basis using 6 echoes (TE=20-70ms) and 3 parameter fitting accounting for noise. Due to the dynamic nature of the serum biomarkers, we averaged the values of the biomarkers over the three measured timepoints (baseline, 1and 2 years). For the cross-sectional analysis, partial correlations adjusted for age, gender, BMI, KL grade in both knees, diabetes status, and joint space narrowing over 2 years in both knees were used to evaluate the associations between serum/urine biomarkers and (a) cartilage T2 and (b) WORMS scores (cartilage, meniscus, and bone marrow). Longitudinal analysis was performed using mixed random effects models.Results:
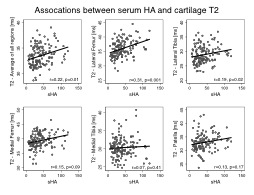
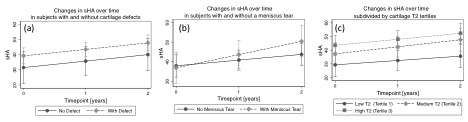
Cross Sectional Associations. Serum biomarkers sHA and sMMP3 were positively correlated with cartilage T2 values. For sHA, significant associations were found with T2 averaged over all cartilage compartments (r=0.22,p=0.01), lateral femur T2 (r=0.31,p=0.001) and lateral tibia T2 (r=0.19,p=0.02), Figure 1. sMMP3 showed positive associations with cartilage T2 in the average of all compartments (r=0.23,p=0.007), the lateral femur (r=0.19,p=0.03), the lateral tibia (r=0.21,p=0.01), and the medial tibia (r=0.17,p=0.04), Figure 2. uCTXII was positively associated with cartilage T2 in the patella (r=0.18,p=0.04). There were no significant associations between the primary serum/urine biomarkers and cartilage WORMS scores (p>0.05). However, sMMP3 was significantly correlated (p<0.05) with meniscus WORMS scores for the medial body (r=0.20,p=0.03), lateral anterior horn (r=0.18,p=0.05), lateral body (r=0.19,p=0.02) and maximum score of all regions (r=0.18,p=0.03). The only significant association between serum/urine biomarkers and bone marrow WORMS score was with sMMP3 for the lateral tibia (r=0.20, p=0.02). Longitudinal Changes: While subjects with cartilage defects had consistently higher sHA values than subjects without defects over 2 years, the differences were not significant (p=0.16) and their rates of change were not significantly different (p=0.21). Subjects with meniscal tears showed trends for increasing rates of change in sHA over time (p=0.085), yet the overall differences in sHA in subjects with and without meniscal tears was not significant (p=0.54). However, subjects with high T2 values had significantly greater sHA than subjects with low T2 values (T2 Tertile 3 vs. T2 Tertile 1: p=0.003) but the rates of change in sHA over time were similar among T2 tertile groups (p=0.77), Figure 3.Discussion:
Our study has shown significant positive correlations between the serum/urine biomarkers (sHA, sMMP3) and cartilage T2. Interestingly, however, no significant associations were found with cartilage morphology or KL grade. While the correlations between serum/urine biomarkers and cartilage T2 were low but significant, the results suggest that serum biomarkers may be sensitive to biochemical changes in cartilage that may not be related to focal morphologic damage. Based on our results, serum biomarkers and cartilage T2 composition may reflect similar features of the pathophysiology of cartilage matrix degenerative disease.Conclusion:
Overall, this study demonstrated low but significant associations between serum biochemical markers of OA (sHA, sMMP3) and MRI T2 biochemical degeneration of the cartilage ECM.Acknowledgements
This study was funded by NIH P50-AR060752 and NIH R01-AR064771.References
1. Vilim V, Olejarova M, Machacek S, Gatterova J, Kraus VB, Pavelka K. Serum levels of cartilage oligomeric matrix protein (COMP) correlate with radiographic progression of knee osteoarthritis. Osteoarthritis Cartilage 2002;10(9):707-713.
2. Garnero P, Mazieres B, Gueguen A, et al. Cross-sectional association of 10 molecular markers of bone, cartilage, and synovium with disease activity and radiological joint damage in patients with hip osteoarthritis: the ECHODIAH cohort. J Rheumatol 2005;32(4):697-703.
Figures