1372
Comparison of Conventional and Synthetic MRI for Quantitative Cartilage T2 Mapping of the Patella1Department of Radiology, Changi General Hospital, Singapore, Singapore
Synopsis
Synthetic MRI has been shown to be of comparable performance to conventional MRI in the assessment of intracranial abnormalities. This study compares synthetic MRI with conventional T2 mapping for quantitative assessment of cartilage T2 relaxation times. T2 values acquired via synthetic MRI are highly correlated with but not equivalent to conventional T2 mapping. Synthetic MRI could be a potential alternative in the quantitative assessment of chondral abnormalities, without the need for prolonged scan times and providing the benefit of dynamic tissue contrasts from a single acquisition.
Introduction
In vivo multi-slice multi-echo T2 mapping has been established as the conventional gold standard method for non-invasive quantitative assessment of collagen content and ultrastructure in cartilage1,2. However, performing this additional sequence increases overall scan duration and potential for image degradation by motion artefacts.
Synthetic MRI (SynMRI) is a recently released commercially available pulse sequence licensed for brain imaging that provides dynamic tissue and inversion recovery contrasts from a single scan, allowing for retrospective reconstruction for any desired tissue contrast weighting using resource imaging data3. Furthermore, this sequence offers quantitative maps of various relaxation time parameters (T1 and T2 maps) directly. SynMRI employs a saturation-prepared multi-slice, multi-echo and multi-delay turbo spin-echo sequence with spin system simulation, permitting an approximation of the signal envelopes and a direct quantification of the parametric maps based on a mono- or multi-exponential least-square fit.
SynMRI has recently been shown to be of comparable performance to conventional pulse sequences (eg. proton-density, STIR, T1- and T2-weighted images) in the assessment of intracranial abnormalities4. There has thus far been no published studies on the use of SynMRI for the quantitative assessment of cartilage T2 relaxation time values. We aim to compare cartilage T2 values as determined by conventional and SynMRI techniques, potentially delivering clinically relevant quantitative information with greater time efficiency.
Methods
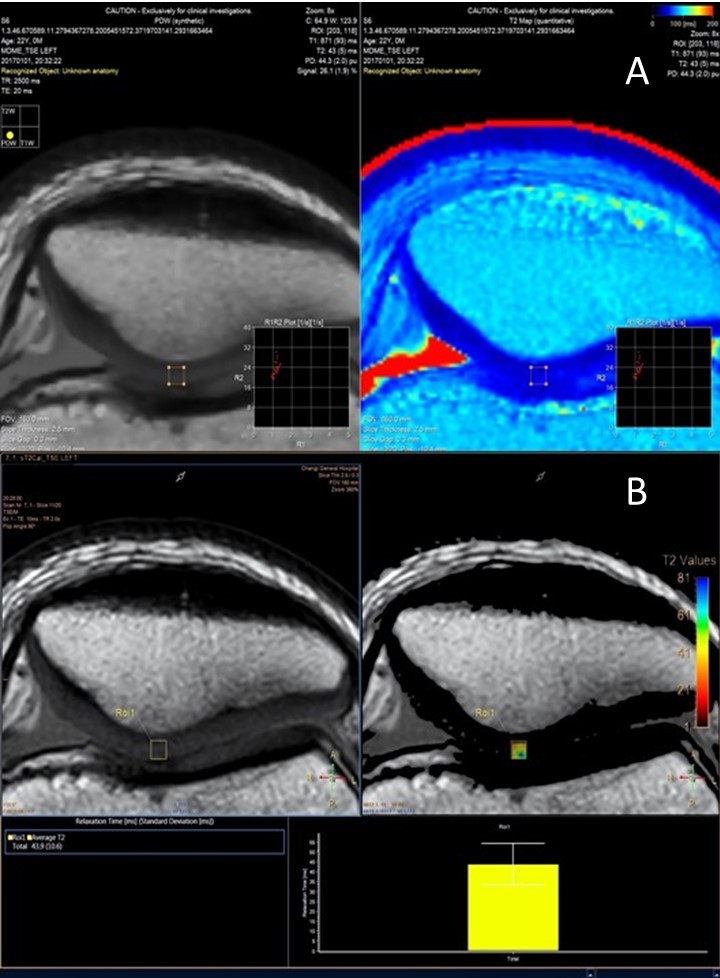
This study was approved by the local institutional review board. A prospective study of outpatients presenting for routine MRI knee examinations without a history of patellar injury, anterior knee pain or anterior knee surgery was conducted. All scans were done on a clinical 3.0T MRI system with a 16-channel phased array knee coil. Conventional axial multi-slice multi-echo T2 mapping as well as SynMRI sequences were performed in addition to routine knee examination sequences.
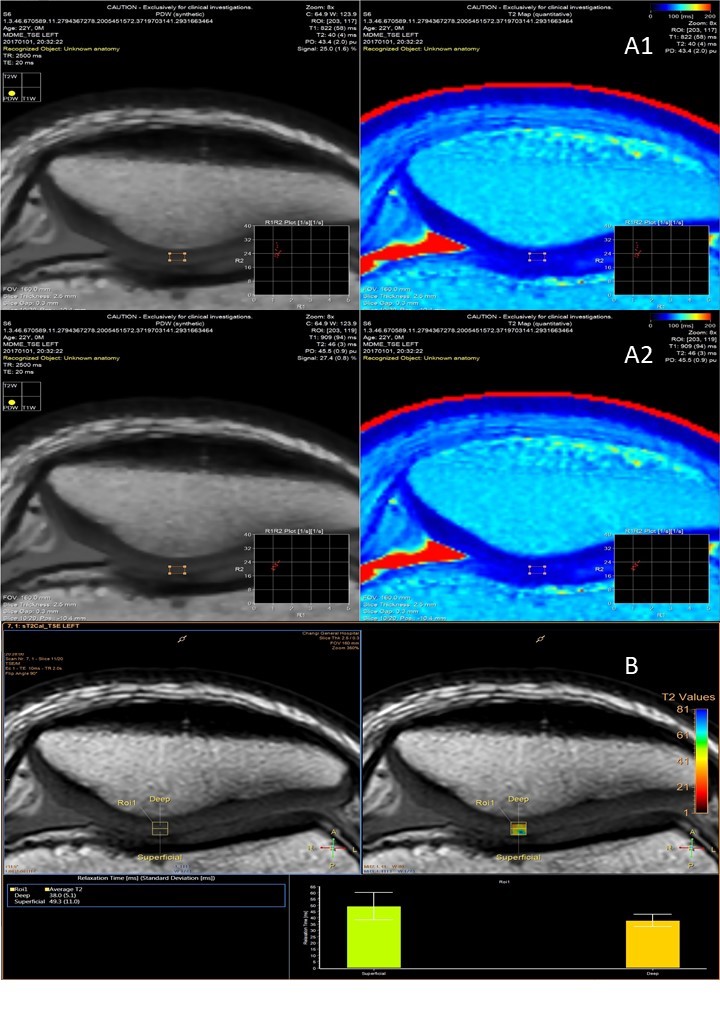
The acquired resource imaging data from both conventional T2 mapping and SynMRI were processed on dedicated workstations to yield quantitative cartilage T2 maps. Manual segmentation of patellar apex cartilage into full thickness square regions-of-interest (ROI) as well as deep-half and superficial-half ROIs was performed by two observers in consensus. The corresponding T2 values were recorded and statistical analysis performed using parametric paired Student’s T-test and Pearson correlation.
Results
Patellar cartilage apex ROIs of SynMRI and conventional T2 maps from thirty-two knees in thirty-one patients (23 males, 9 females; mean age 29 years) were analysed.
Mean full-thickness cartilage T2 relaxation time was significantly higher for SynMRI compared to conventional T2 mapping (46.3 vs 39.5 ms, p <0.01); similar findings were found for deep-half of the cartilage (42.3 vs 34.0 ms, p <0.01) and superficial-half (50.3 vs 45.1 ms, p <0.01).
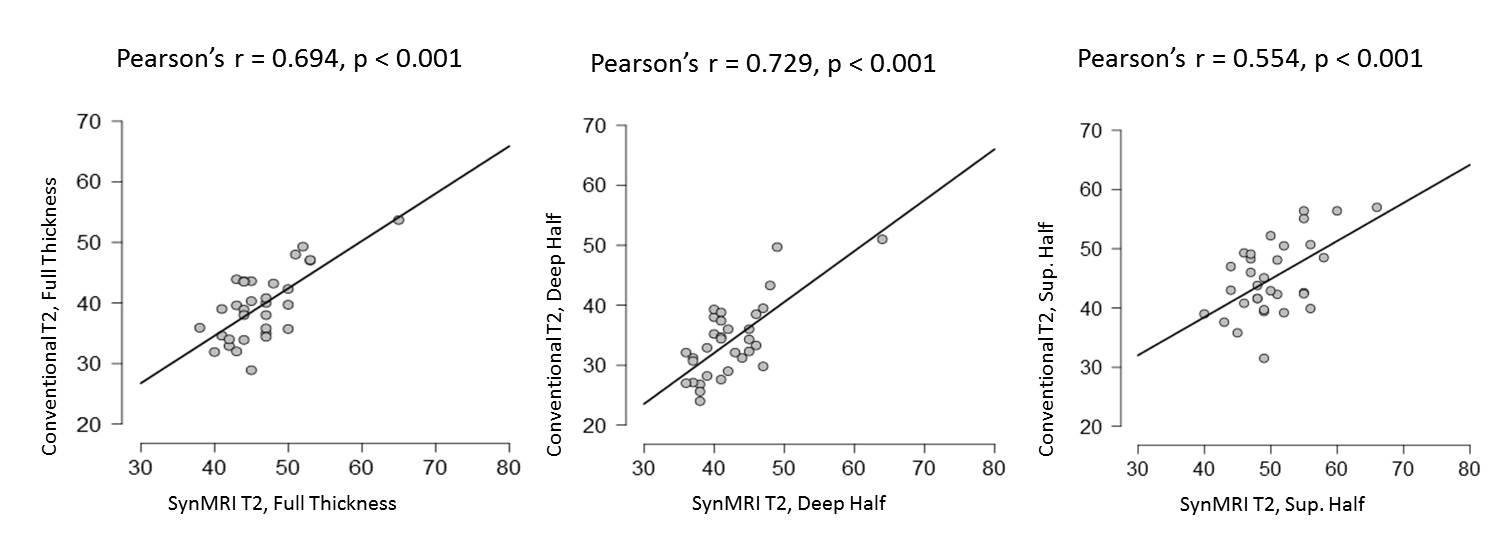
Pearson correlation showed strong
correlations of T2 relaxation time measurements between SynMRI and conventional T2 mapping for
full thickness (r=0.694, p <0.001) and deep cartilage (r=0.729, p
<0.001), with moderately strong correlation for superficial cartilage
(r=0.554, p <0.001).
Discussion and Conclusion
Our results reveal that T2 relaxation time measurements from SynMRI demonstrate strong correlation but are not equivalent to those from conventional multi-slice multi-echo T2 mapping, with significantly higher T2 values obtained from SynMRI. The difference in T2 measurements may be systematic and potentially correctable with algorithmic adjustments or estimated with linear regression. Given the strong correlation between T2 measurements from both techniques, SynMRI could be a promising tool in the quantitative assessment of chondral abnormalities, without the need for prolonged scan times and with the additional benefit of dynamic tissue contrasts from a single acquisition.Acknowledgements
No acknowledgement found.References
1. Choi JA, Gold GE. MR Imaging of Articular Cartilage Physiology. Magn Reson Imaging Clin N Am. 2011;19:249–82.
2. Mosher TJ, Dardzinski BJ. Cartilage MRI T2 Relaxation Time Mapping: Overview and Applications. Sem Musculoskel Radiol. 2004;8(4): 355-68.
3. Warntjes JBM et al. Rapid Magnetic Resonance Quantification of the Brain: Optimization for Clinical Usage. Magn Reson Med. 2008;60:320–9.
4. Tanenbaum LN et al. Synthetic MRI for Clinical Neuroimaging: Results of the Magnetic Resonance Image Compilation (MAGiC) Prospective, Multicenter, Multireader Trial. Am J Neuroradiol. 2017;38:1103–10.
Figures