1370
Correlation time mapping is associated with permeability of articular cartilage1Applied Physics, University of Eastern Finland, Kuopio, Finland, 2Medical Research Center, University of Oulu and Oulu University Hospital, Oulu, Finland, 3Research Unit of Medical Imaging, University of Oulu, Oulu, Finland, 4Department of Diagnostic Radiology, Oulu University Hospital, Oulu, Finland, 5Diagnostic Imaging Center, Kuopio University Hospital, Kuopio, Finland
Synopsis
Correlation time τc is a parameter that describes the relaxation properties of soft tissues. In this study, articular cartilage from human cadaver patellae was studied using MR imaging and biomechanical testing and modeling. The statistical analysis revealed an association between the permeability, as revealed by mechanical modeling, and the correlation time measured for articular cartilage.
Introduction
Earlier, increased fluid flow velocity of cartilage, characterized by permeability, was suggested to be the earliest change in osteoarthritis (OA)1. Magnetic resonance imaging (MRI) and biomechanical modeling are valuable tools in characterization of OA and cartilage composition2,3. Multiple MRI parameters, such as T1 and T2, have been earlier combined with modeling of cartilage for characterization of OA progression2,3. Correlation time τc is an MRI parameter reflective of mobility of water and it could potentially be used for detecting changes in water-cartilage interactions in early OA. In preliminary studies, the correlation time was observed to be shorter in the advanced OA than in the early OA4, which indicates that the correlation time may be related to tissue permeability.
Methods
Experiments: Cylindrical osteochondral samples from human cadaver patellae (n=15) were collected from donors. The condition of the samples varied from 0 to 4 in ICRS score. The samples were biomechanically tested with indentation testing (Fig.1) using a 2-step stress-relaxation protocol by applying 5% of compression followed by 15 minutes of relaxation in both steps. Proper contact of the indentation tip was ensured by applying a 12.5 kPa pre-stress.
For MRI measurements, the samples were immersed in perfluoropolyether (Galden HS 240, Solvay Solexis, Italy) and MRI was performed at 9.4 T using a 19 mm quadrature RF volume transceiver and VnmrJ3.1 Varian/Agilent DirectDrive console. The samples were imaged (Fig.1) at room temperature and relaxation time measurements were realized using a non-selective preparation block coupled to a single slice fast spin echo readout (TR=5s, ESP=5.5ms, ETL=8 with centric echo ordering, matrix=256x80, FOV=16x16mm and 1mm slice, yielding a resolution of 62.5µm along cartilage depth). A single imaging slice was positioned at the center of the specimen, perpendicular to the axis of specimen.
The MRI measurement included continuous wave (CW-) T1ρ with 10 spin-lock amplitudes (ranging from 0 to 2500 Hz with spin-lock durations of 0, 24, 48, 96 and 192 ms). CW-T1ρ was fitted in a pixel-wise manner using 2-parameter exponential with baseline. Furthermore, the τc correlation times were fitted from the T1ρ maps using the method described earlier4. For analyses, the correlation times were averaged using a 1-mm wide region of interest (ROI) from the center of the cartilage (Fig.1) for the whole cartilage thickness.
FE modeling and analysis: Axisymmetric FE models were constructed in ABAQUS (Dassault Systems) for each sample with the fibril-reinforced poroelastic properties1,5. The model boundary and loading conditions corresponded to the experimental setup (Fig.1). The time-dependent force of each model was optimized against the corresponding experimental data in MATLAB (Mathworks Inc) to obtain the following material parameters: initial (E0) and strain-dependent (Eε) collagen network moduli, proteoglycan matrix modulus (Em), initial permeability (k0) and permeability strain-dependence factor (M).
Statistics: Correlations between the optimized material parameters and τc correlation times were analyzed using Pearson’s 2-tailed linear correlation test in MATLAB. For this analysis, mean values of τc through samples thicknesses were calculated for each sample. The level of significance was set to 0.05.
Results
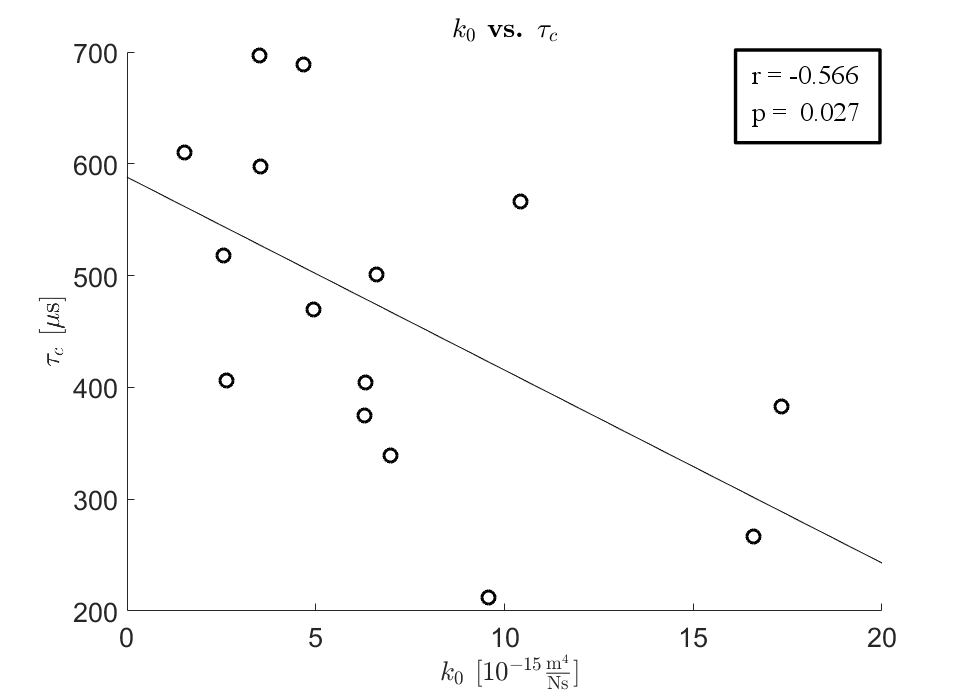
τc correlation time profiles and the corresponding material properties of cartilage were compared (Fig.2, Fig.3). The mean of the correlation time τc decreased with increasing permeability. Significant negative correlation (r = -0.566, p = 0.027) was found between the initial permeability k0 and the correlation time τc of the samples (Fig.3).Discussion
The results indicated that as the permeability of articular cartilage increases the correlation time τc decreases, confirming our initial hypothesis. The increase in permeability has been earlier linked to the earliest changes of OA1, but currently it cannot be detected or measured non-invasively. The present study suggests that τc may provide a non-invasive means to assess the permeability of articular cartilage.Conclusions
τc correlation time is sensitive to the changes in cartilage permeability. This might enable non-invasive evaluation of cartilage permeability, and thus, the detection of the earliest OA related changes, using MRI.Acknowledgements
Support from Northern Ostrobothnia Hospital District, Instrumentarium Science Foundation (grant #170033) and the Academy of Finland (grants #286526, #285909 and #293970) are gratefully acknowledged.References
1. Mäkelä JTA et al. Very early osteoarthritis changes sensitively fluid flow properties of articular cartilage. J Biomech. 2015;48(12):3369-3376.
2. Juras V et al. In vitro determination of biomechanical properties of human articular cartilage in osteoarthritis using multi-parametric MRI. J Magn Reson. 2009;197(1):40-47.
3. Chan DD et al. Probing articular cartilage damage and disease by quantitative magnetic resonance imaging. J R Soc Interface. 2012;10(78).
4. Elsayed H et al. Correlation Time Mapping of Articular Cartilage: correlation with tissue composition and structure. Proc Intl Soc Mag Reson Med. 2017; 25:13-14.
5. Wilson W et al. Stresses in the local collagen network of articular cartilage: a poroviscoelastic fibril-reinforced finite element study. J Biomech. 2004;37(3):357-366.
Figures
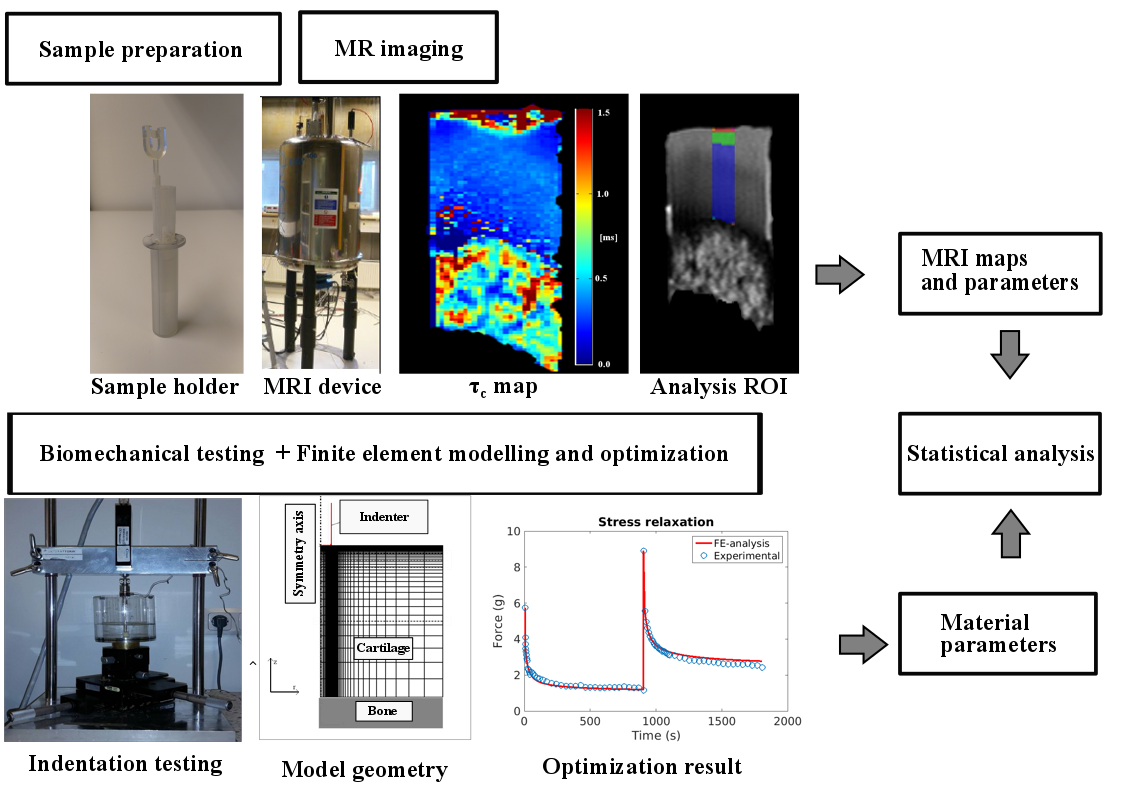
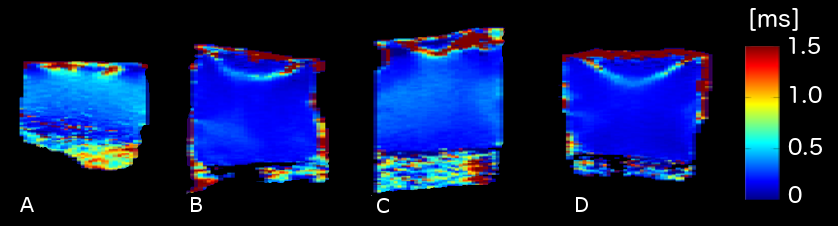
Figure 2: τc maps for articular cartilage samples representing different stages of osteoarthritis. A) sample 14: k0 = 1.53 [10-15 m4/Ns], b) sample 1: k0 = 2.64 [10-15 m4/Ns], c) sample 3: k0 = 6.98 [10-15 m4/Ns] and d) sample 9: k0 = 17.34 [10-15 m4/Ns]. The permeability of the samples was negatively correlated with the full thickness mean of τc.