1366
Metabolic imaging of glioblastoma using hyperpolarized 13C-MRI - glycolytic metabolism in cancer stem cell-like cells.1Radiation Oncology Branch, National Cancer Institute, NIH, Bethesda, MD, United States, 2Radiation Biology Branch, National Cancer Institute, NIH, Bethesda, MD, United States
Synopsis
Dynamic nuclear polarization-MRI along with hyperpolarized [1-13C] pyruvate was conducted to evaluate the difference in glycolytic profile between a glioblastoma cell line and cancer stem-like cells using the orthotopic xenograft mouse model.
Introduction
Since the cancer stem-like cells (CSCs) that consist a small population of tumors play an important role in their resistance against radiation and/or chemotherapy due to its different metabolic profile, to investigate the specific metabolic characteristics of CSCs is valuable. Dynamic nuclear polarization (DNP) techniques that make nuclear spin of 13C-labeled substrates far beyond thermal equilibrium conditions have been devised, enabling metabolic MRI1,2 to monitor specific enzymatic reactions elevated in tumors. Although some clinical studies of DNP-MRI using hyperpolarized [1-13C]-pyruvate have already been demonstrated in prostate cancer3,4 and myocardium5, there are no preclinical studies reported that stress on the tumor metabolism specific to CSCs. Especially, to discover differences in metabolic change after chemotherapy and/or radiation therapy between differentiated glioblastoma cells and the CSCs would lead to an innovation of new therapeutic strategies. In the present study, non-invasive imaging of DNP-MRI along with hyperpolarized [1-13C] pyruvate was conducted to evaluate the difference in glycolytic profile between a glioblastoma cell line and CSC using the orthotopic xenograft mouse model.Methods
DNP-MRI using [1-13C] Pyruvate
A 3T MRI scanner (MR Solutions, Surrey, UK) along with a custom-made head coil (1H-linear coil/13C-quadrature coil) was used for imaging. After an acquisition of T2-weigthed 1H-MRI data set, hyperpolarized [1-13C] MRI studies were performed. To obtain hyperpolarized [1-13C] pyruvate, 30 μL of pyruvic acid containing 15 mM of OX063 (trityl radical compound) and 2.5 mM of the gadolinium chelate were polarized at 3.35 T and 1.4 K in the Hypersense DNP polarizer (Oxford Instruments, Abingdon, UK), according to the manufacturer’s instructions. After 1–1.5 h, the hyperpolarized sample was rapidly dissolved and injected (approximately 1.15 mmol/kg) through the tail vein cannula as previously reported6. 13C two-dimensional spectroscopic images were acquired 30 seconds after the start of the pyruvate injection, with a 32 × 32 mm2 FOV in a 8-mm slab thickness, a matrix size of 16 × 16, spectral width of 4,000 Hz, repetition time of 75 ms, Gaussian excitation pulse with a flip angle of 5°. The total time required to acquire each image was 19.2 seconds. During the acquisition, the body temperature was kept in the range of 35.0 to 36.9 celsius degrees. Image processing was performed using MATLAB and ImageJ.
Cell lines
The human glioblastoma cell lines, U251 and glioma stem-like cells, NSC11 were cultured in the appropriate conditions, respectively.
Animal study
Orthotopic brain tumor model was developed in athymic nude mice according to intracranial implantation method described in a previous report. DNP-MRI was performed as described in the earlier section when the tumor size ranged 50 + 10 mm3 on T2-weighted image. Independently, immunofluorescent analyses of monocarboxylate transporter 1(MCT1) and MCT4 was performed using paraffin-embedded tumor tissue.
In vitro study
Expressed protein level of lactate dehydrogenase A (LDHA), LDHB, MCT1 and MCT4 under the normal cell culture conditions were evaluated by Western blotting. The expression level was standardized using beta-tubulin as an endogenous control.
Results
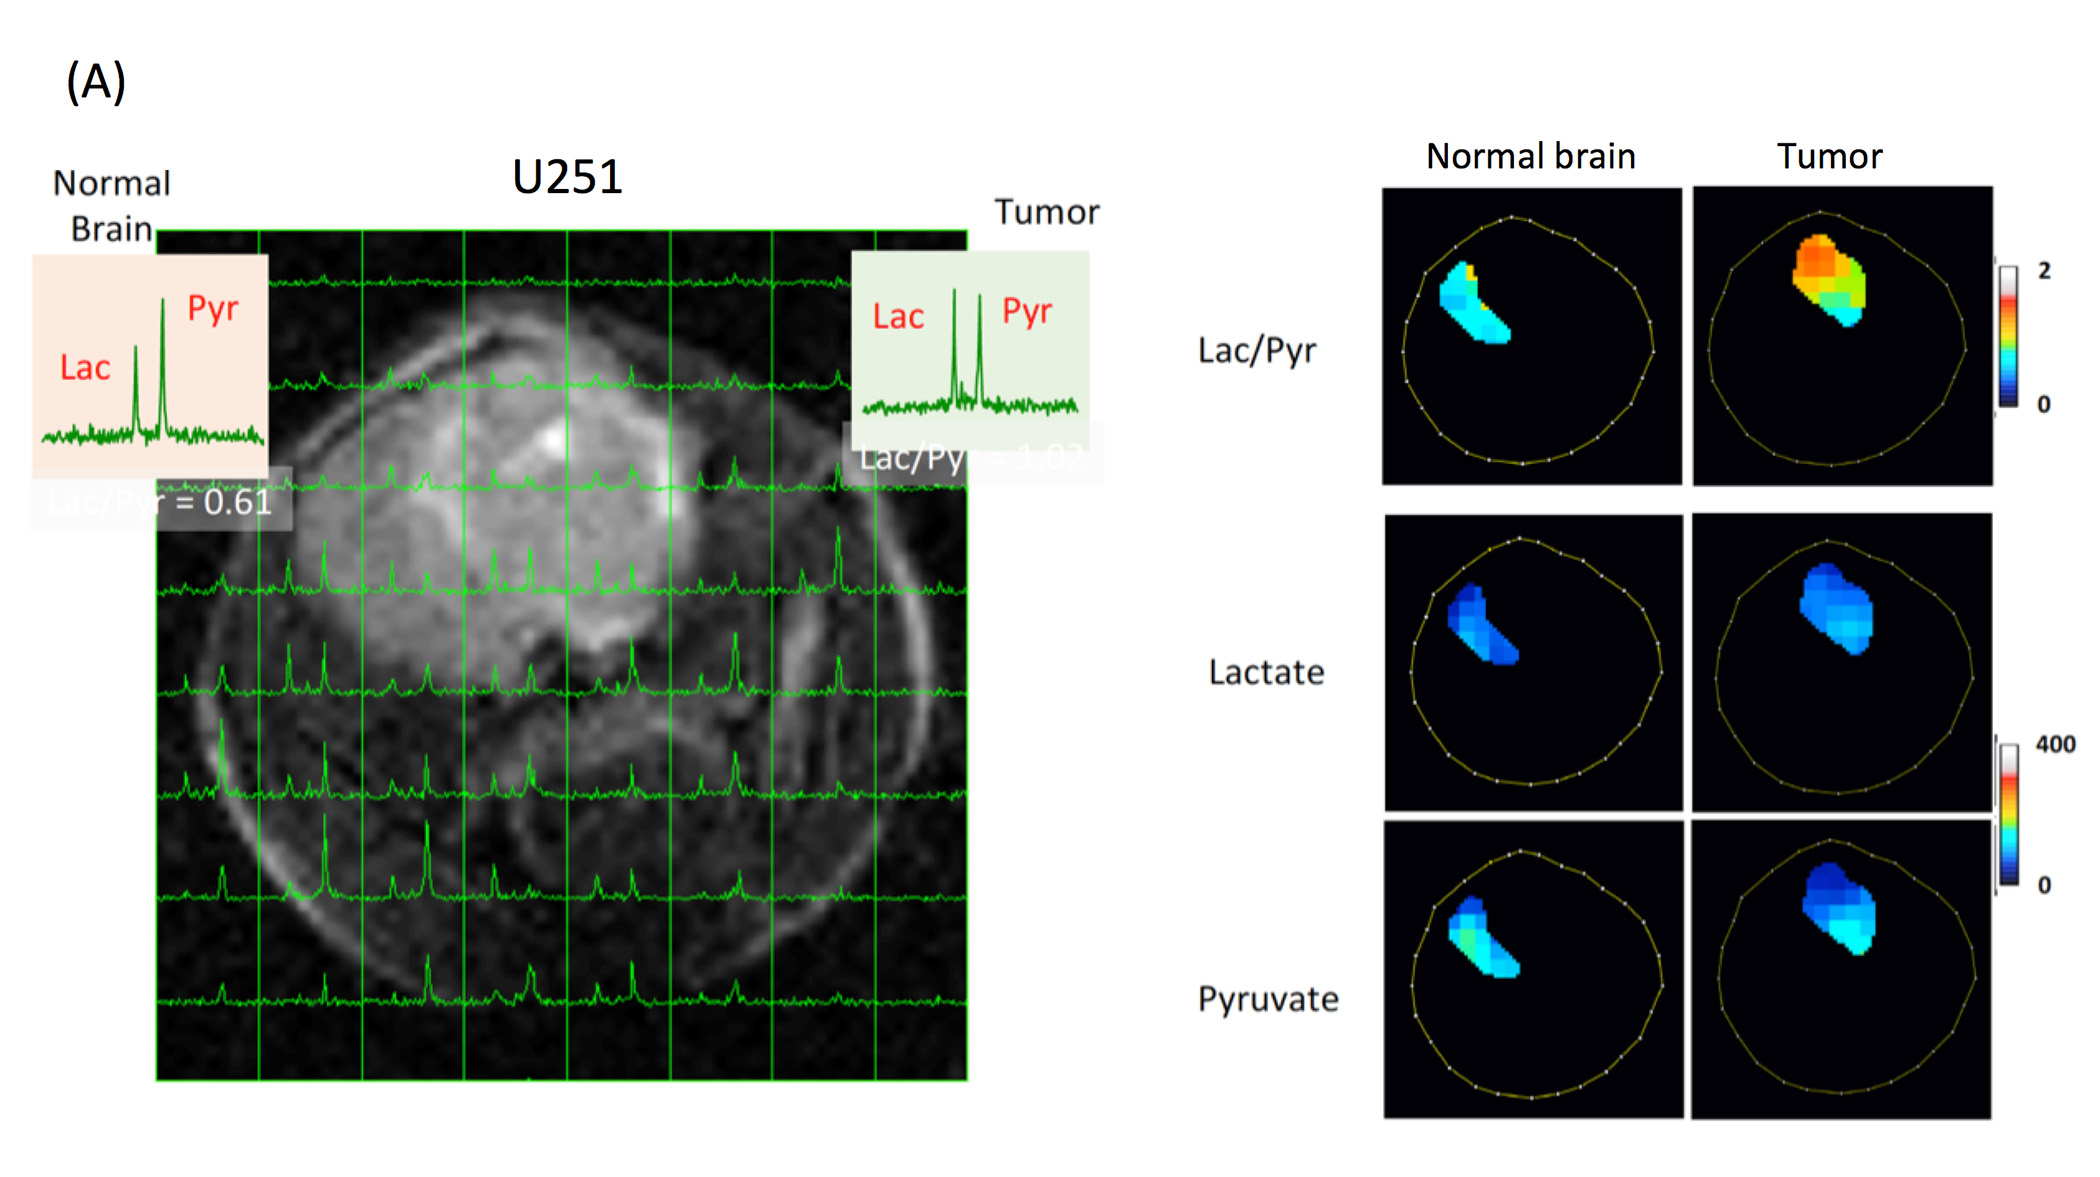
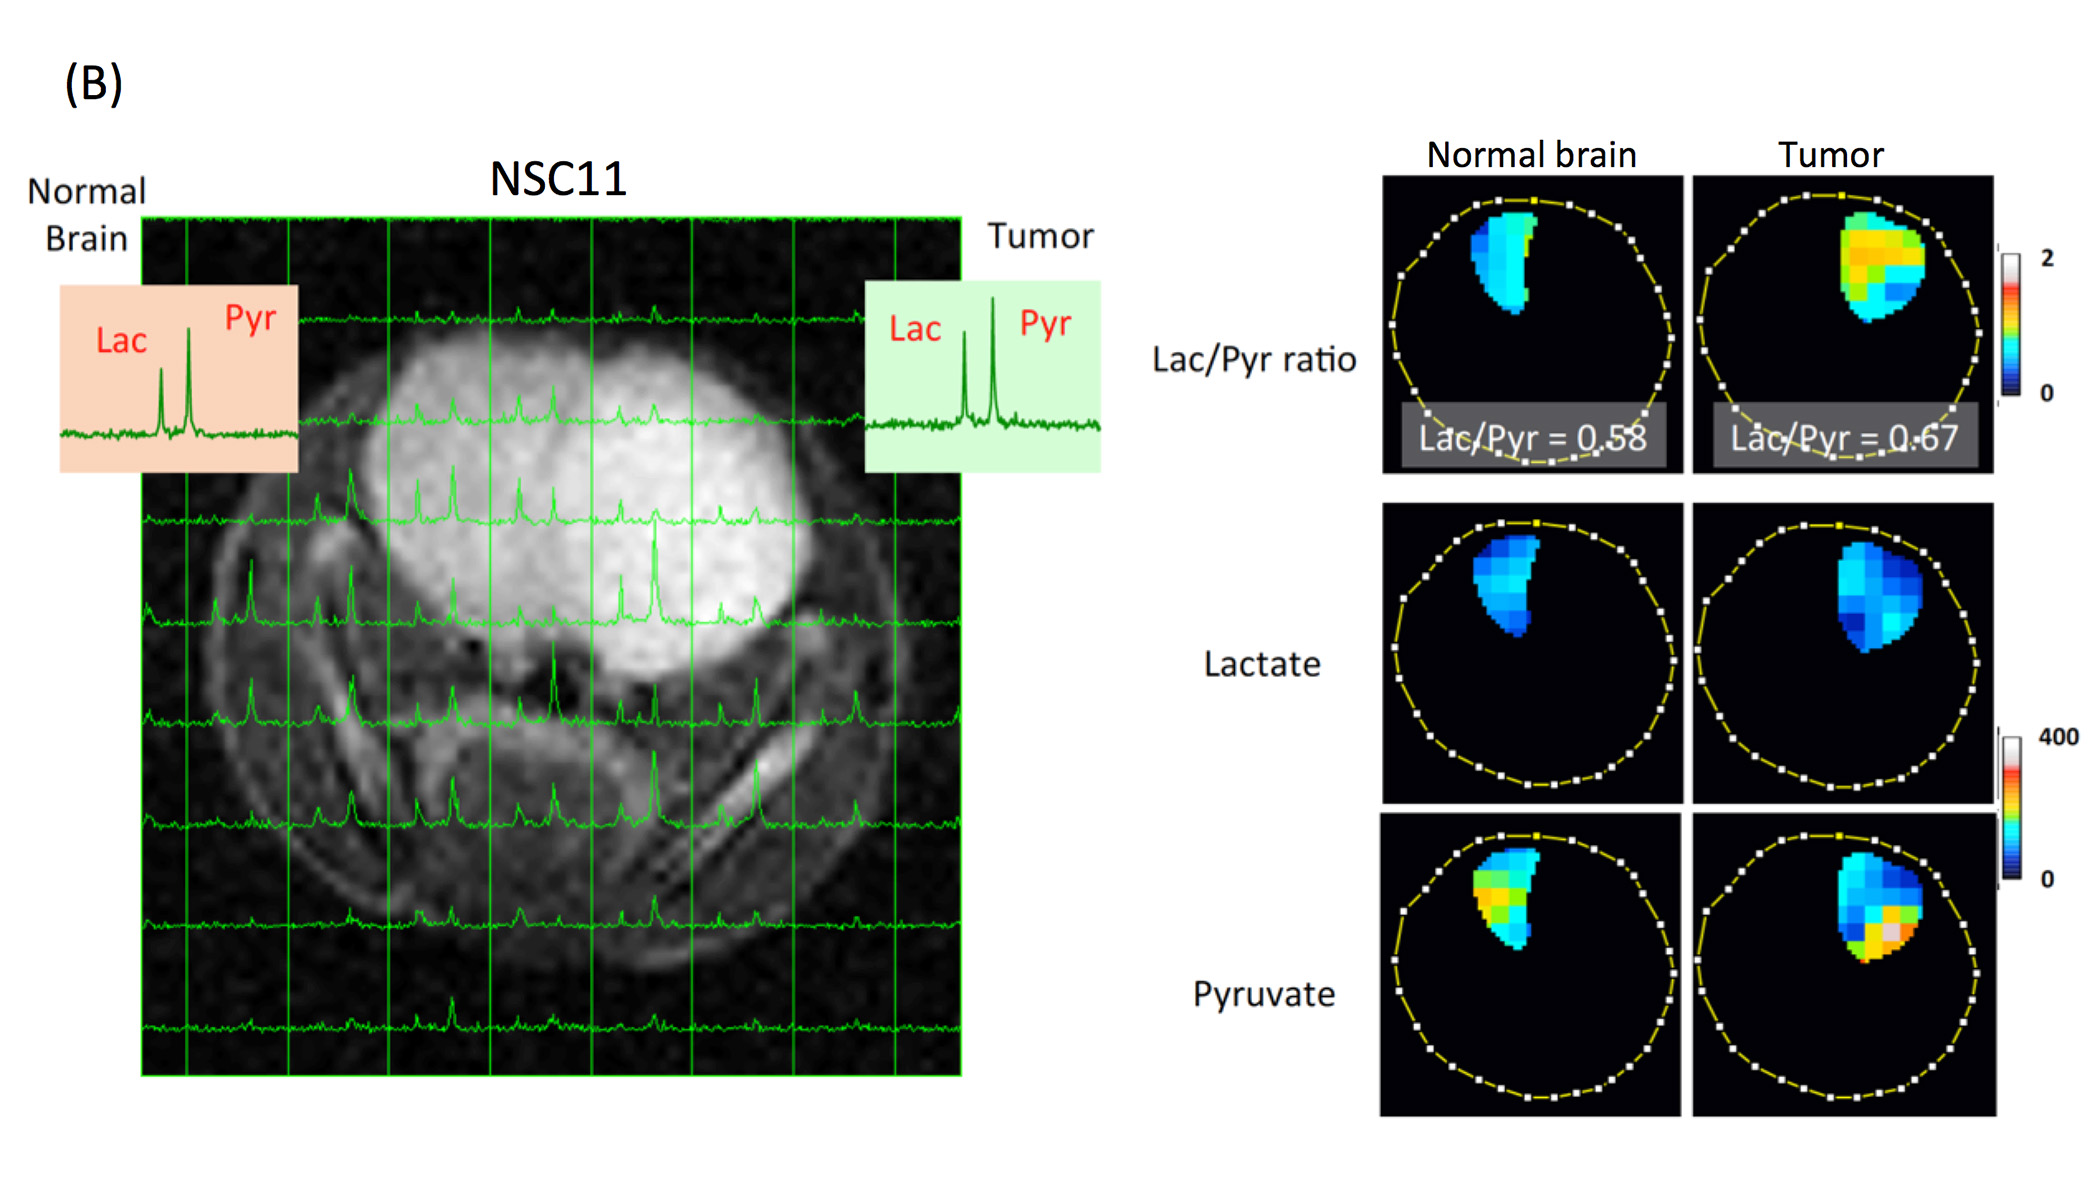
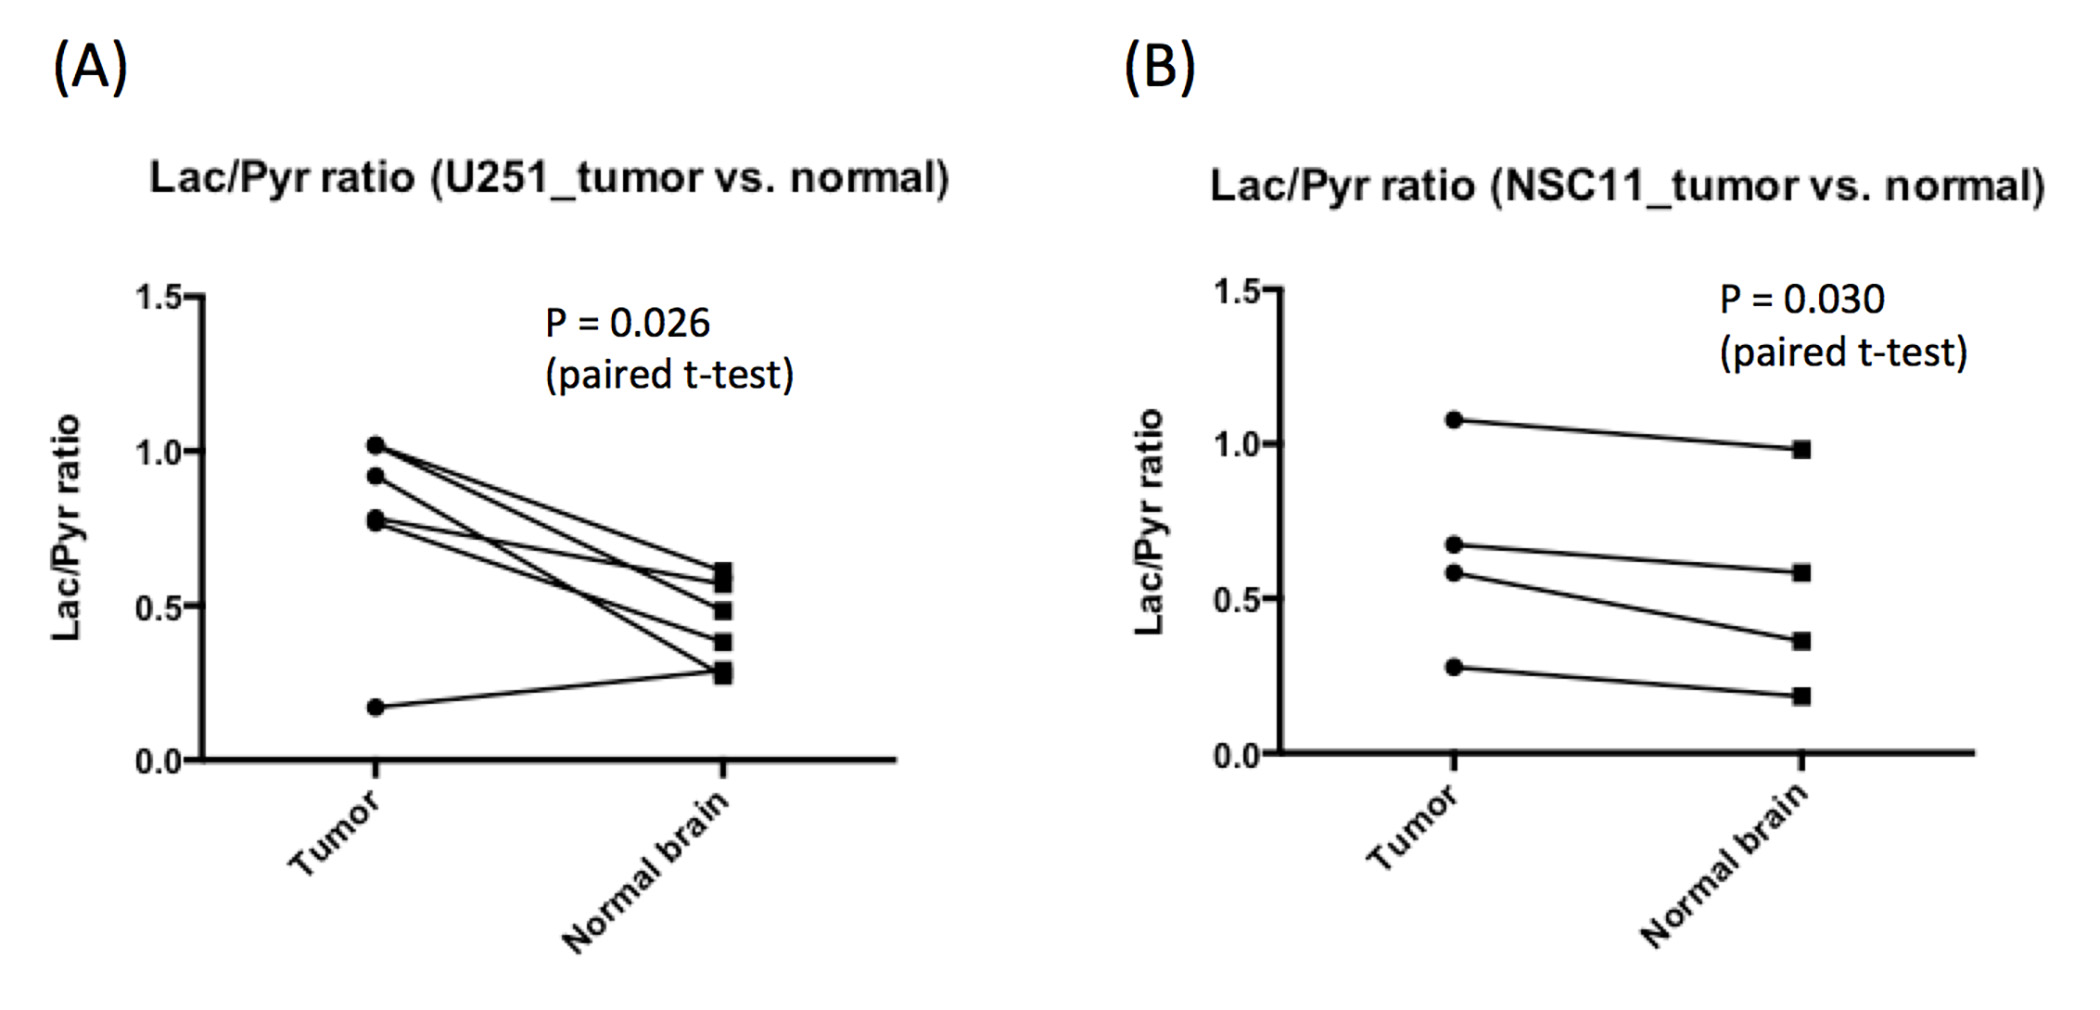
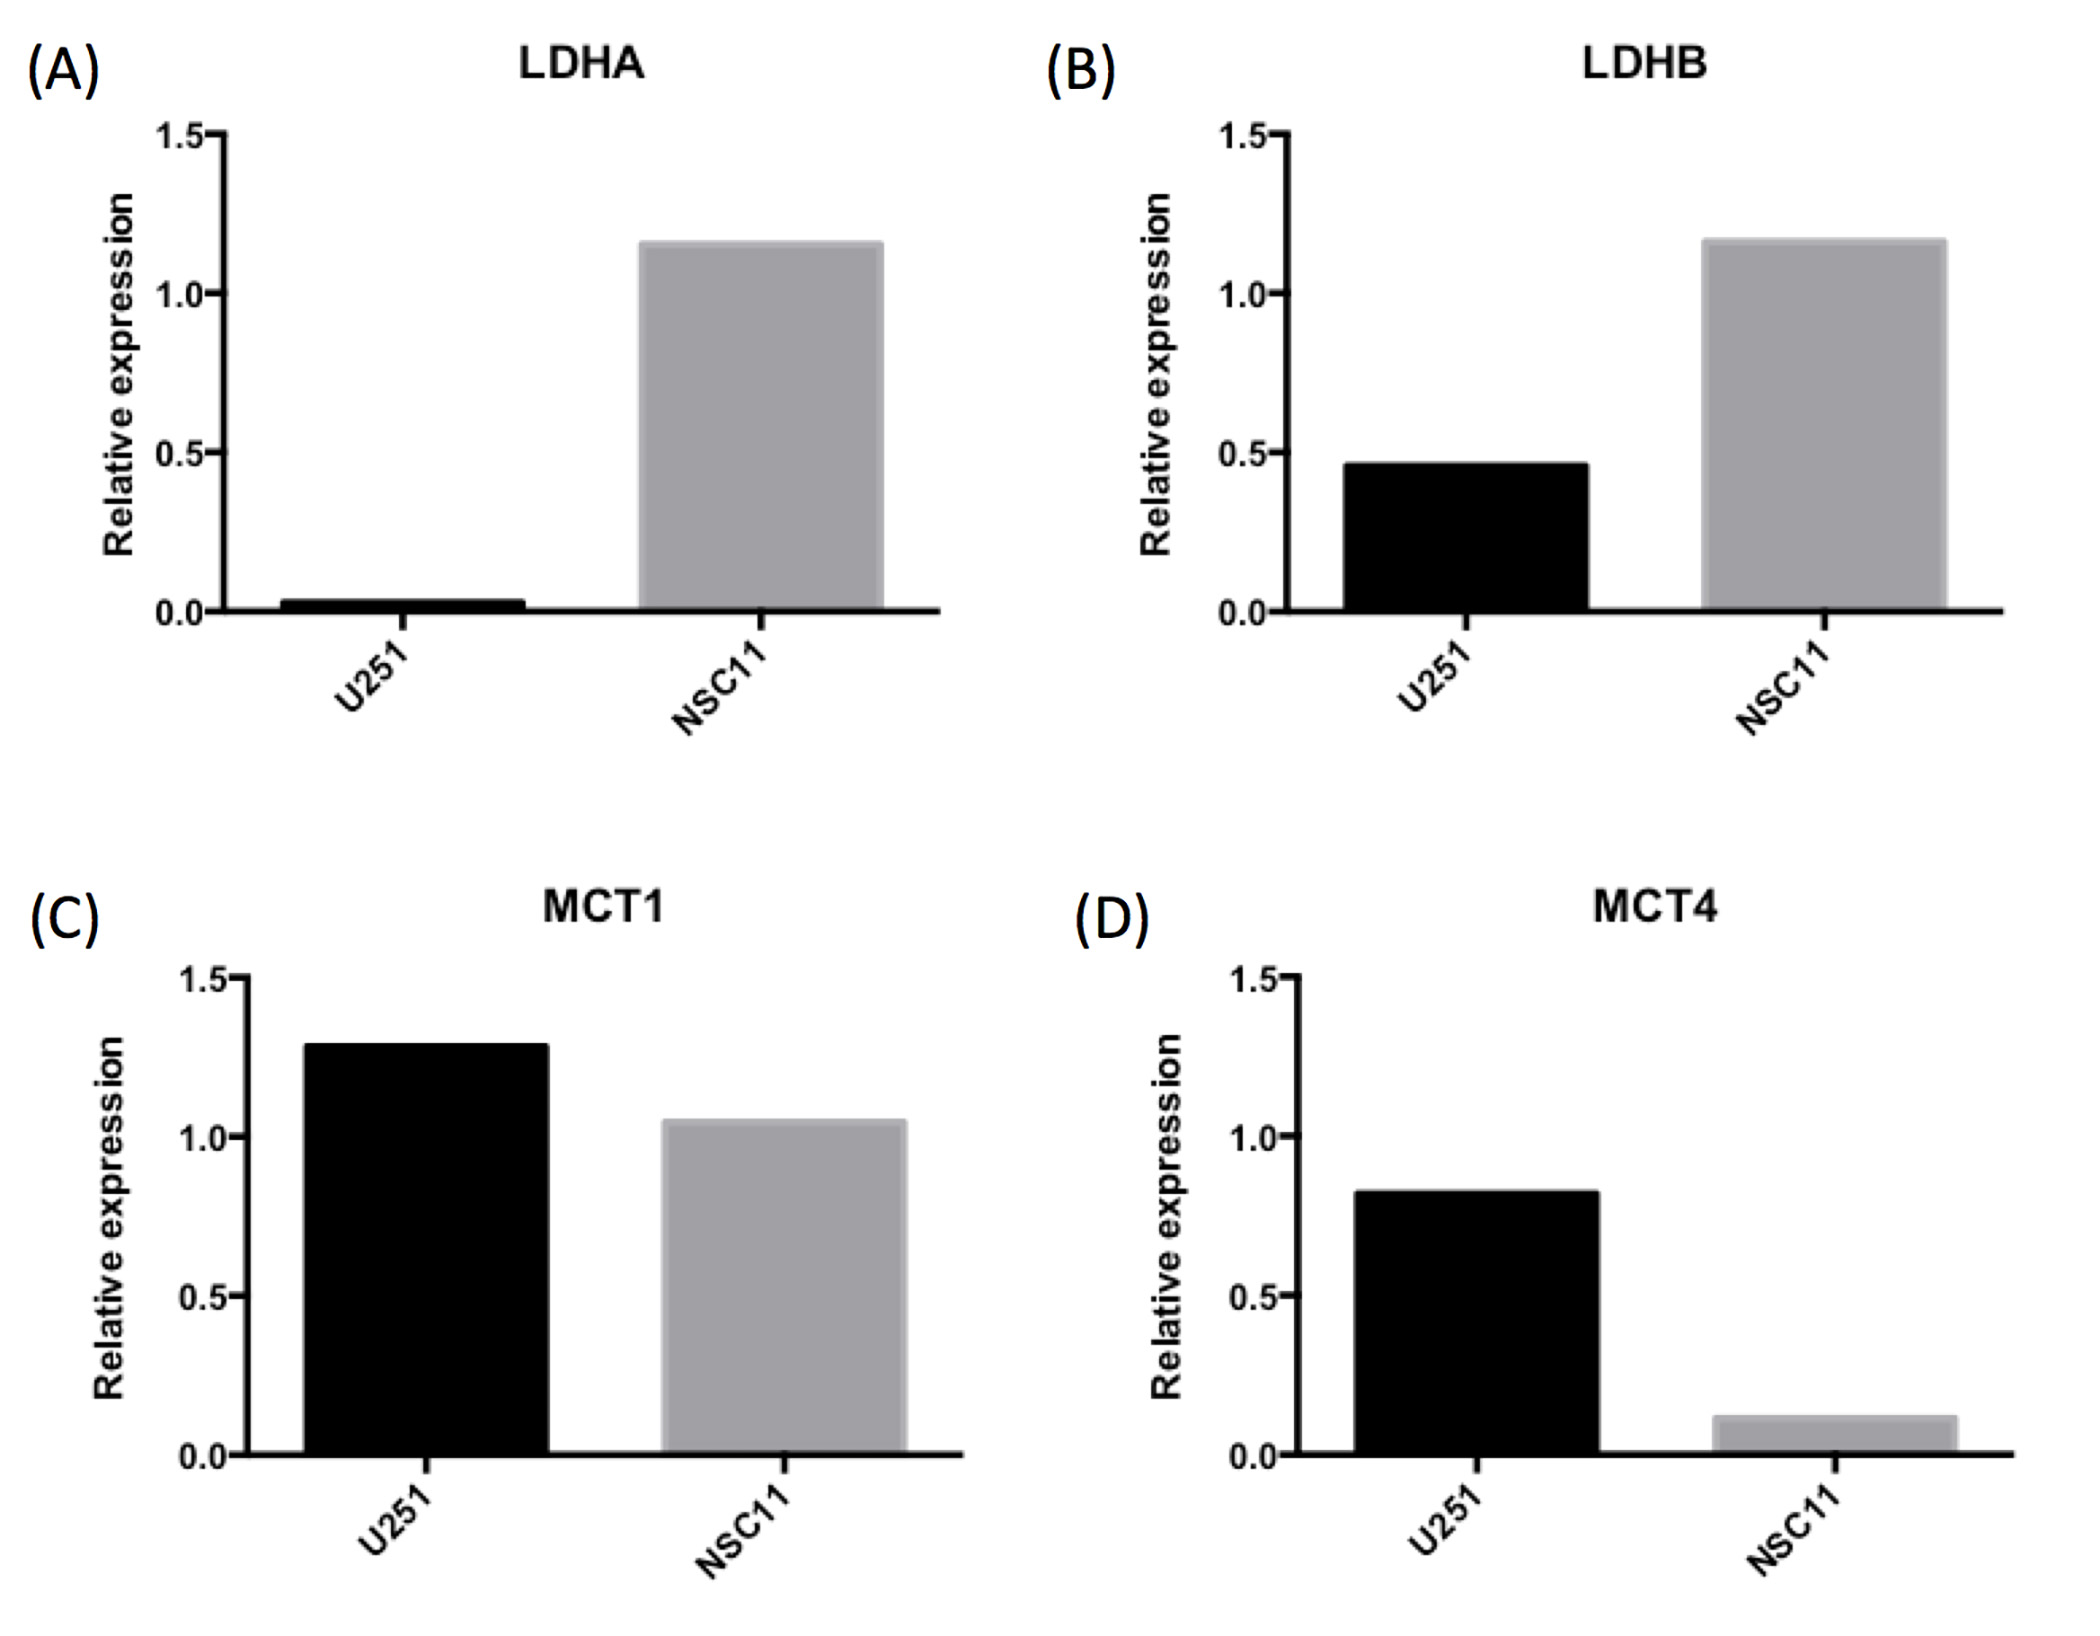
13C-MRI showed an increase in lactate-to-pyruvate ratio (Lac/Pyr) both in U251 and NSC11 compared to the contralateral normal brain tissue, suggested elevated anaerobic glycolysis (P<0.05) (Figure 1). The extent of the increase in Lac/Pyr compared to the normal brain tissue was higher in U251 than NSC11 except for one U251 case (Figure 2). Western blotting showed both LDHA and LHDB expression in U251 was lower than NSC11. The expression of MCT4 was higher in U251 than NSC11, whereas they were almost the same for MCT1 (Figure 3). Immunohistochemistry showed relative weak staining for MCT4 in NSC11, consistent with the result of Western blotting (Figure 4).Discussion
In this study, quality of 13C-DNP-MRI using [1-13C] pyruvate was validated and considered to be feasible to apply to the brain tumors. Lac/Pyr ratio in the tumor compared to the normal brain tissue was significantly higher both in U251 glioblastoma and NSC11 glioma stem-like cells. This result is reasonable in that malignant tumors enhance anaerobic glycolytic pathway even in the aerobic environment (Warburg effect). The extent of Lac/Pyr in NSC11 in relation to the normal brain, however, seemed lower than that in U251. Although further investigation is still needed, MCT4, which mainly functions both as importer and exporter of lactate produced by anaerobic glycolysis might play an important role. Evaluation of tumor metabolism in stem-like cells might lead to a new therapeutic strategy for glioblastoma.Conclusion
13C-DNP-MRI is a useful method for evaluation of tumor metabolism in glioblastoma and capable to differentiate its metabolic profile.
Acknowledgements
No acknowledgement found.References
1. Ardenkjaer-Larsen JH, Fridlund B, Gram A, et al. Increase in signal-to-noise ratio of > 10,000 times in liquid-state NMR. Proc Natl Acad Sci U S A 2003; 100: 10158-63.
2. Golman K, Ardenkjaer-Larsen JH, Petersson JS, et al. Molecular imaging with endogenous substances. Proc Natl Acad Sci U S A 2003; 100: 10435-9.
3. Nelson SJ, Kurhanewicz J, Vigneron DB, et al. Metabolic imaging of patients with prostate cancer using hyperpolarized [1-¹³C]pyruvate. Sci Transl Med. 2013;5:198ra108.
4. Aggarwal R, Vigneron DB, Kurhanewicz J. Hyperpolarized 1-[13C]-Pyruvate Magnetic Resonance Imaging Detects an Early Metabolic Response to Androgen Ablation Therapy in Prostate Cancer. Eur Urol. 2017 Jul 29. pii: S0302-2838(17)30651-6. doi: 10.1016/j.eururo.2017.07.022. [Epub ahead of print]
5. Cunningham CH, Lau JY, Chen AP, et al. Hyperpolarized 13C Metabolic MRI of the Human Heart: Initial Experience. Circ Res. 2016;119(11):1177-82.
6. Saito K, Matsumoto S, Takakusagi Y, et al. 13C-MR Spectroscopic Imaging with Hyperpolarized [1-13C]pyruvate Detects Early Response to Radiotherapy in SCC Tumors and HT-29 Tumors. Clin Cancer Res. 2015;21(22):5073-81.
Figures