1365
Metabolic Consequences in the Heart and Skeletal Muscle of Human Pancreatic Cancer Xenograft GrowthSantosh Kumar Bharti1, Paul T Winnard Jr.1, Yelena Mironchik1, Marie-France Penet1, and Zaver M Bhujwalla1,2
1Division of Cancer Imaging Research, Department of Radiology, Johns Hopkins University, School of Medicine, Baltimore, MD, United States, 2Department of Oncology, Johns Hopkins University, School of Medicine, Baltimore, MD, United States
Synopsis
To understand the metabolic events that occur during cancer-induced cachexia, here we analyzed the effects of human pancreatic cancer xenografts on heart and skeletal muscle metabolites using 1 H MRS. Studies were performed with cachexia-inducing Pa04C and non-cachexia inducing Panc1 human pancreatic cancer xenografts, since cachexia occurs most frequently in pancreatic cancer. 1H MR spectra identified differences in heart and skeletal muscle metabolites of cachectic and non-cachectic mice, as well as between normal mice and cachectic as well as non-cachectic mice. Our data highlight the systemic metabolic changes that occur with tumor growth and provide new insights in cancer-induced cachexia.
Introduction
Cachexia is an underexplored and yet devastating consequence of cancer that is the cause of 20% of all cancer related deaths [1]. Cachexia inducing tumors cause a ‘wasting away’ of the body. The condition is associated with poor treatment outcome [2], fatigue, and extremely poor quality of life [2, 3]. Because of the multi-factorial characteristics of this condition, it has been difficult to understand the mechanisms driving the impact of the tumor on body organs and the sequence of events that leads to this lethal condition. Tissue wasting is one of the characteristics associated with cachexia syndrome. Here we have used 1H MRS to characterize the metabolic profile of skeletal muscle and heart muscle obtained from normal mice and noncachexia (Panc1) and cachexia inducing (Pa04C) tumors bearing mice to further understand the cascade of events that occur during cachexia.Methods
The human pancreatic cancer cell line, Panc1, was obtained from ATCC. The human pancreatic cancer cell line, Pa04C, was provided by Dr. Maitra [4]. Male severe combined immunodeficient (SCID) mice were inoculated in the right flank with cancer cells (2 × 10⁶) and in the right hind leg muscle with reporter myoblasts (2×10⁶) [5]. Once the mice were sacrificed, the heart and skeletal muscle were harvested, freeze clamped and stored in -80°C until 1H MRS analysis. Dual phase solvent extraction was performed on the tissues. The water phase was separated, freeze dried, reconstituted in D2O PBS and transferred to a 5mm NMR tube for spectral acquisition. All 1H MR spectra were acquired on an Avance III 750 MHz (17.6T) Bruker NMR spectrometer equipped with a 5 mm broadband inverse (BBI) probe. 1H MR spectra with water suppression were acquired using a single pulse sequence with the following experimental parameters: spectral width of 15495.86 Hz, data points of 64 K, 90° flip angle, relaxation delay 10 sec, acquisition time 2.11 sec, 64 scans with 8 dummy scans, receiver gain 80.6. Spectral acquisition, processing and quantification were performed using TOPSPIN 2.1 software and statistical analysis was performed using The UnscramblerX 10.Results and Discussion
Representative 1H MR spectra of skeletal muscle obtained from normal mice, and from mice bearing noncachexia inducing Panc1 tumors, and cachexia inducing Pa04C tumors are shown in Figure 1. Quantitative changes in the 1H MRS detected metabolites in muscle are shown in Figure 2. Representative 1H MR spectra of the heart from normal mice, and from mice bearing noncachexia inducing Panc1 tumors, and cachexia inducing Pa04C tumors are displayed in Figure 3. Quantitative changes in 1H MRS detected metabolites in the heart are shown in Figure 4. Leucine, creatine, lactate and glucose were significantly lower, and acetate and formate were significantly higher, in the muscle of cachectic mice compared to non-cachetic mice. Cachectic mice had significantly lower alanine, succinate, glycine, lipid and PUFA (Polyunsaturated fatty acids), and significantly higher acetate, pyruvate, and formate compared to normal mice. Non-cachectic mice had significantly lower alanine, succinate, phosphocreatine, and glycine, and significantly higher leucine, isoleucine, valine, pyruvate, creatine, taurine and glucose compared to normal mice. In the heart, leucine, isoleucine, valine, aspartate, glucose, lipid and PUFA were significantly lower, and glutamine was significantly higher, in cachectic mice compared to non-cachetic mice. Cachectic mice had significantly lower leucine, isoleucine, valine, lactate, alanine, glutamate, and PUFA, and significantly higher glutamine and glucose compared to normal mice. Non-cachectic mice had significantly lower alanine, and significantly higher glucose and lipid compared to normal mice. These data highlight, for the first time, the profound metabolic changes that occur in skeletal muscle and the heart with cachexia, identifying potential in vivo 1H MRS indices to detect the onset of cachexia from changes in branched chain amino acids, glucose, and PUFAs. Our data also provide new insights into the effects of cachexia as well as noncachexia inducing tumors on skeletal muscle and heart metabolism that may lead to metabolic interventions in ‘metabolotheranostic’ strategies to reduce the morbidity associated with cancer and cachexia.Acknowledgements
This work was supported by NIH R01 CA193365, NIH R35CA209960, and NIH P30CA06973.References
- Argiles JM, Busquets S et al: Cancer cachexia: understanding the molecular basis. Nature reviews Cancer 2014, 14(11):754-762.
- Ozola Zalite I, Zykus R et al: Influence of cachexia and sarcopenia on survival in pancreatic ductal adenocarcinoma: a systematic review. Pancreatology 2015, 15(1):19-24.
- Fearon KC, Baracos VE: Cachexia in pancreatic cancer: new treatment options and measures of success. HPB (Oxford) 2010, 12(5):323-324.
- Penet MF, Shah T et al: Metabolic imaging of pancreatic ductal adenocarcinoma detects altered choline metabolism. Clinical cancer research : an official journal of the American Association for Cancer Research 2015, 21(2):386-395.
- Winnard PT, Jr., Bharti SK et al: Detection of Pancreatic Cancer-Induced Cachexia Using a Fluorescent Myoblast Reporter System and Analysis of Metabolite Abundance. Cancer research 2016, 76(6):1441-1450.
Figures
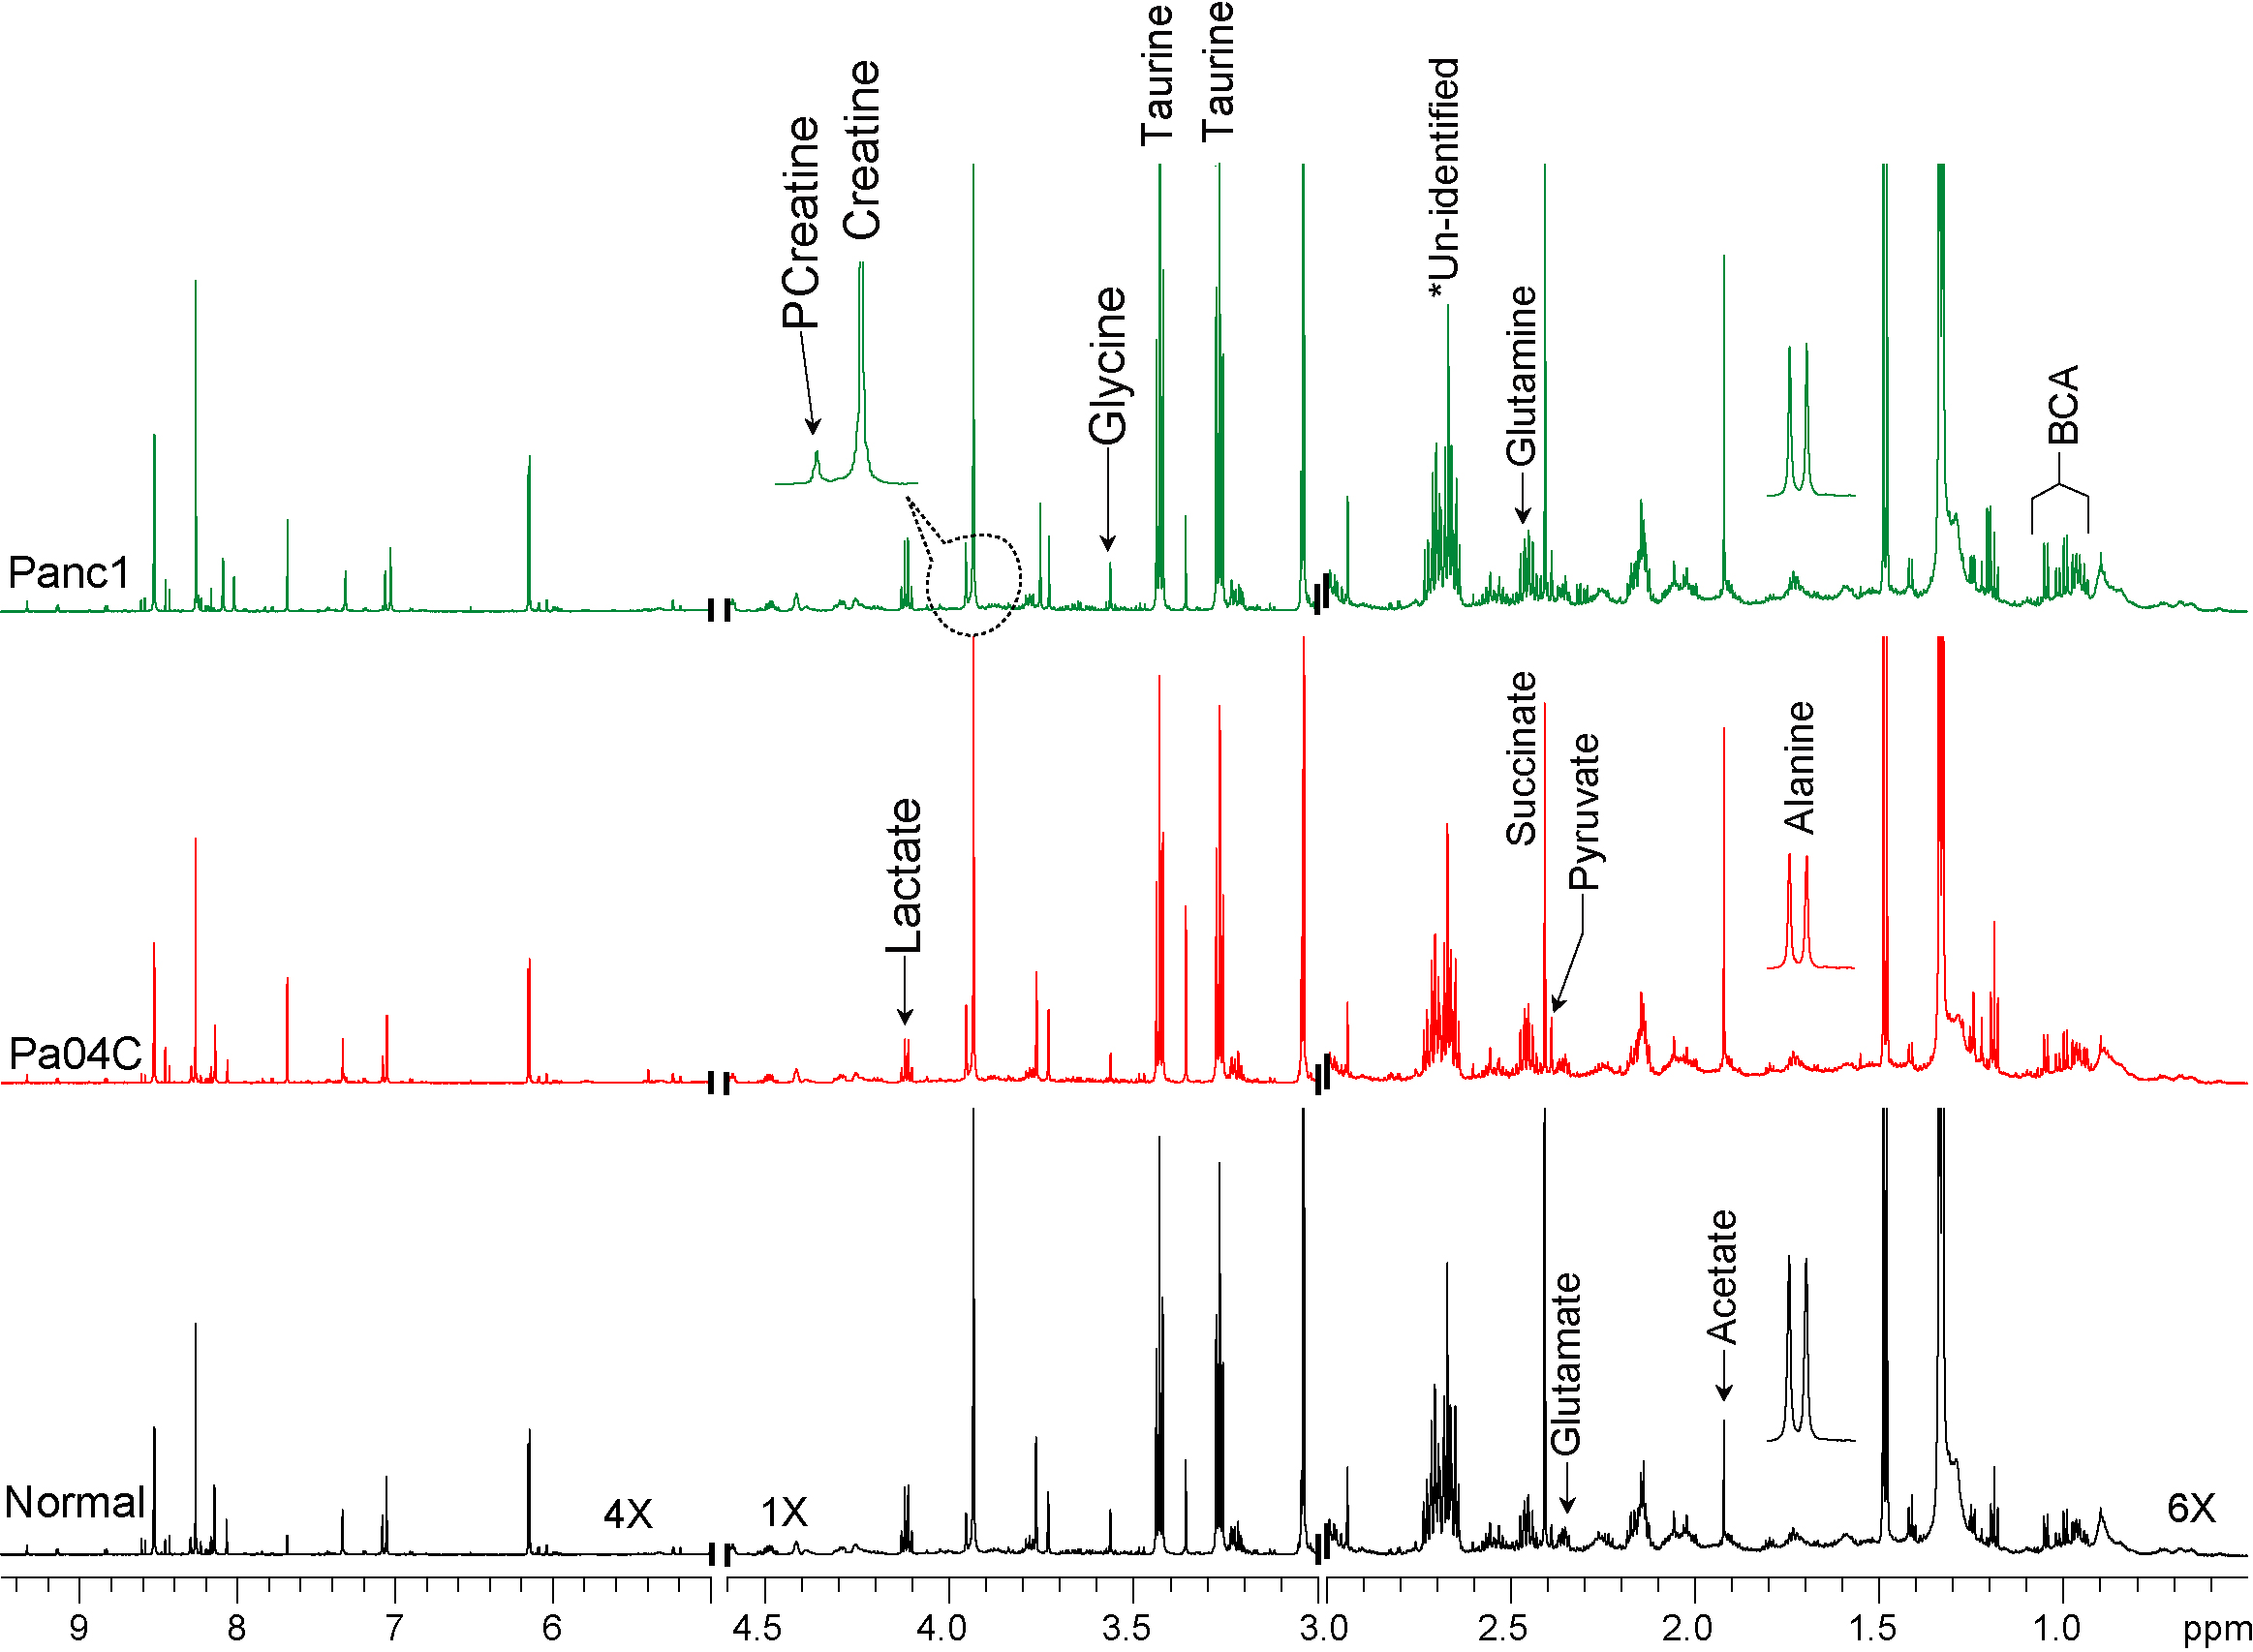
Figure 1: Representative
high resolution 1H MR spectra of water soluble extracts obtained
from the muscle tissue of normal mice (black), and mice
bearing Panc1 (green) and Pa04C (red) tumors. Relative to
normal mice, significant alterations in metabolite levels were identified in
muscle tissue from Panc1 and Pa04C tumor bearing mice. BCA; Branch Chain
Amino acids, PCreatine; Phosphocreatine
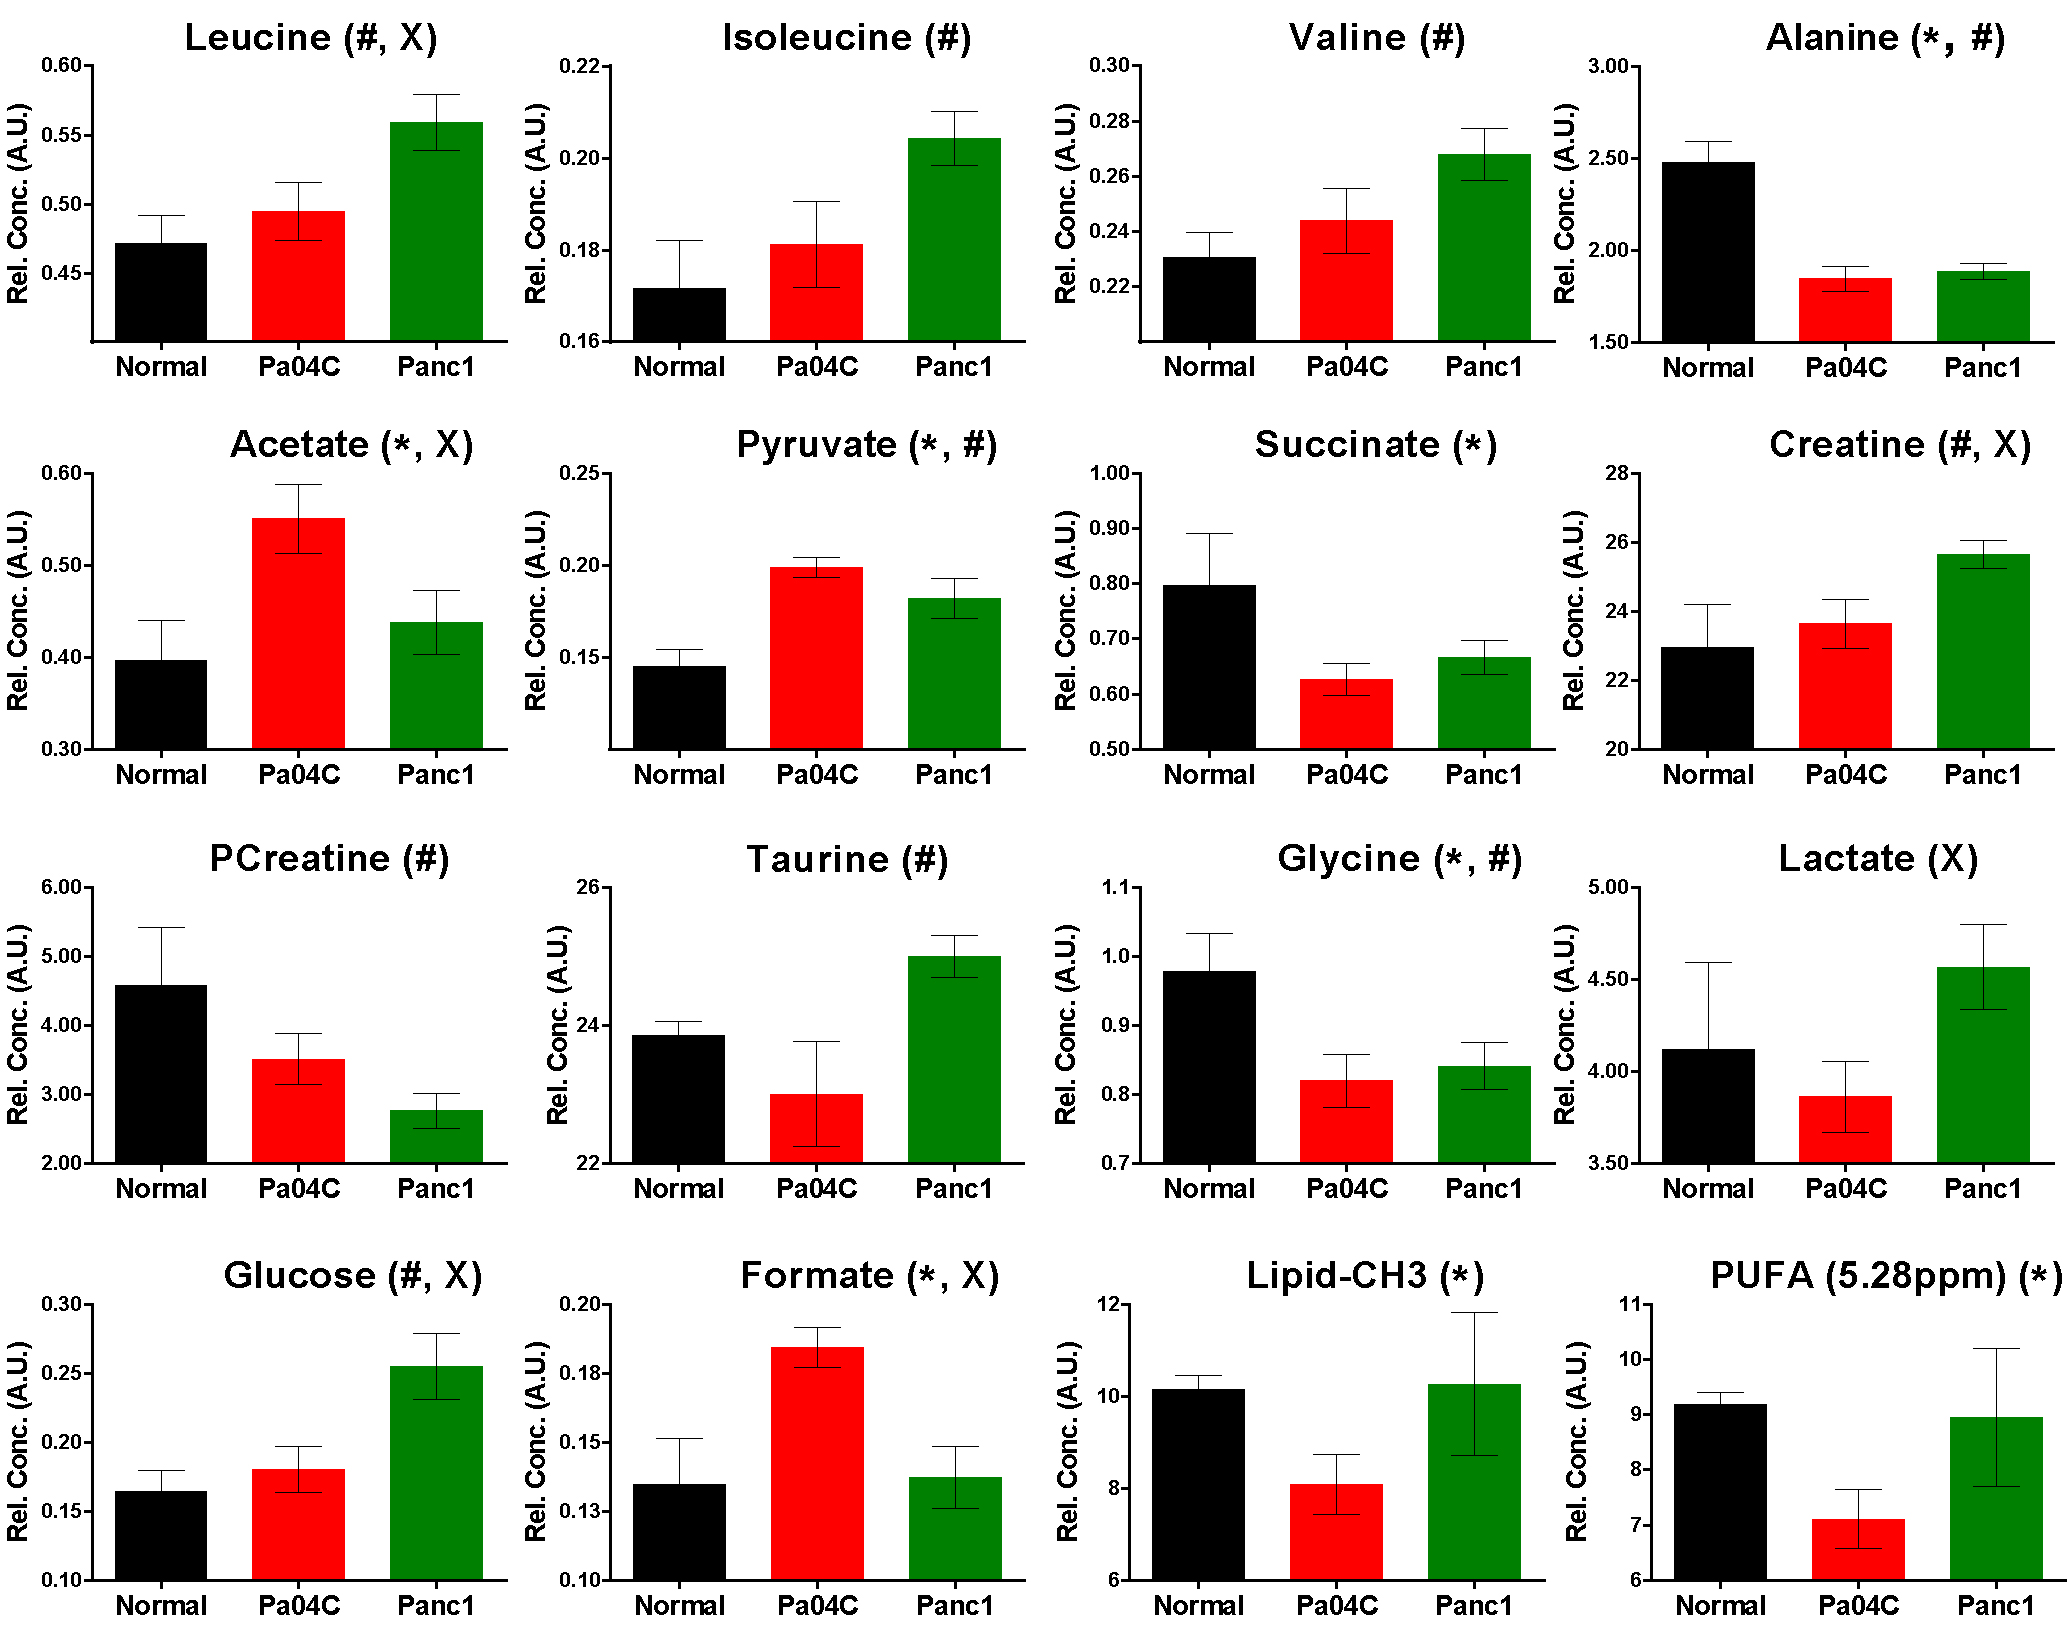
Figure 2: Quantitative values of metabolites in muscle tissue
obtained from normal mice (n=5) and Pa04C (n=13) and Panc1 (n=8) tumor bearing
mice. An unpaired two tailed student-t
test was performed; p value <0.05 considered significant. Bar plots represent Mean ± SEM. * Represents
significant difference between Normal vs
Pa04c, # represents significant
difference between Normal vs Panc1,
and X represents significant
difference between Pa04C vs Panc1
respectively. PUFA; polyunsaturated
fatty acid peak at 5.28ppm was quantified. Lipid-CH3; -CH3 peak at 0.9ppm was
quantified.
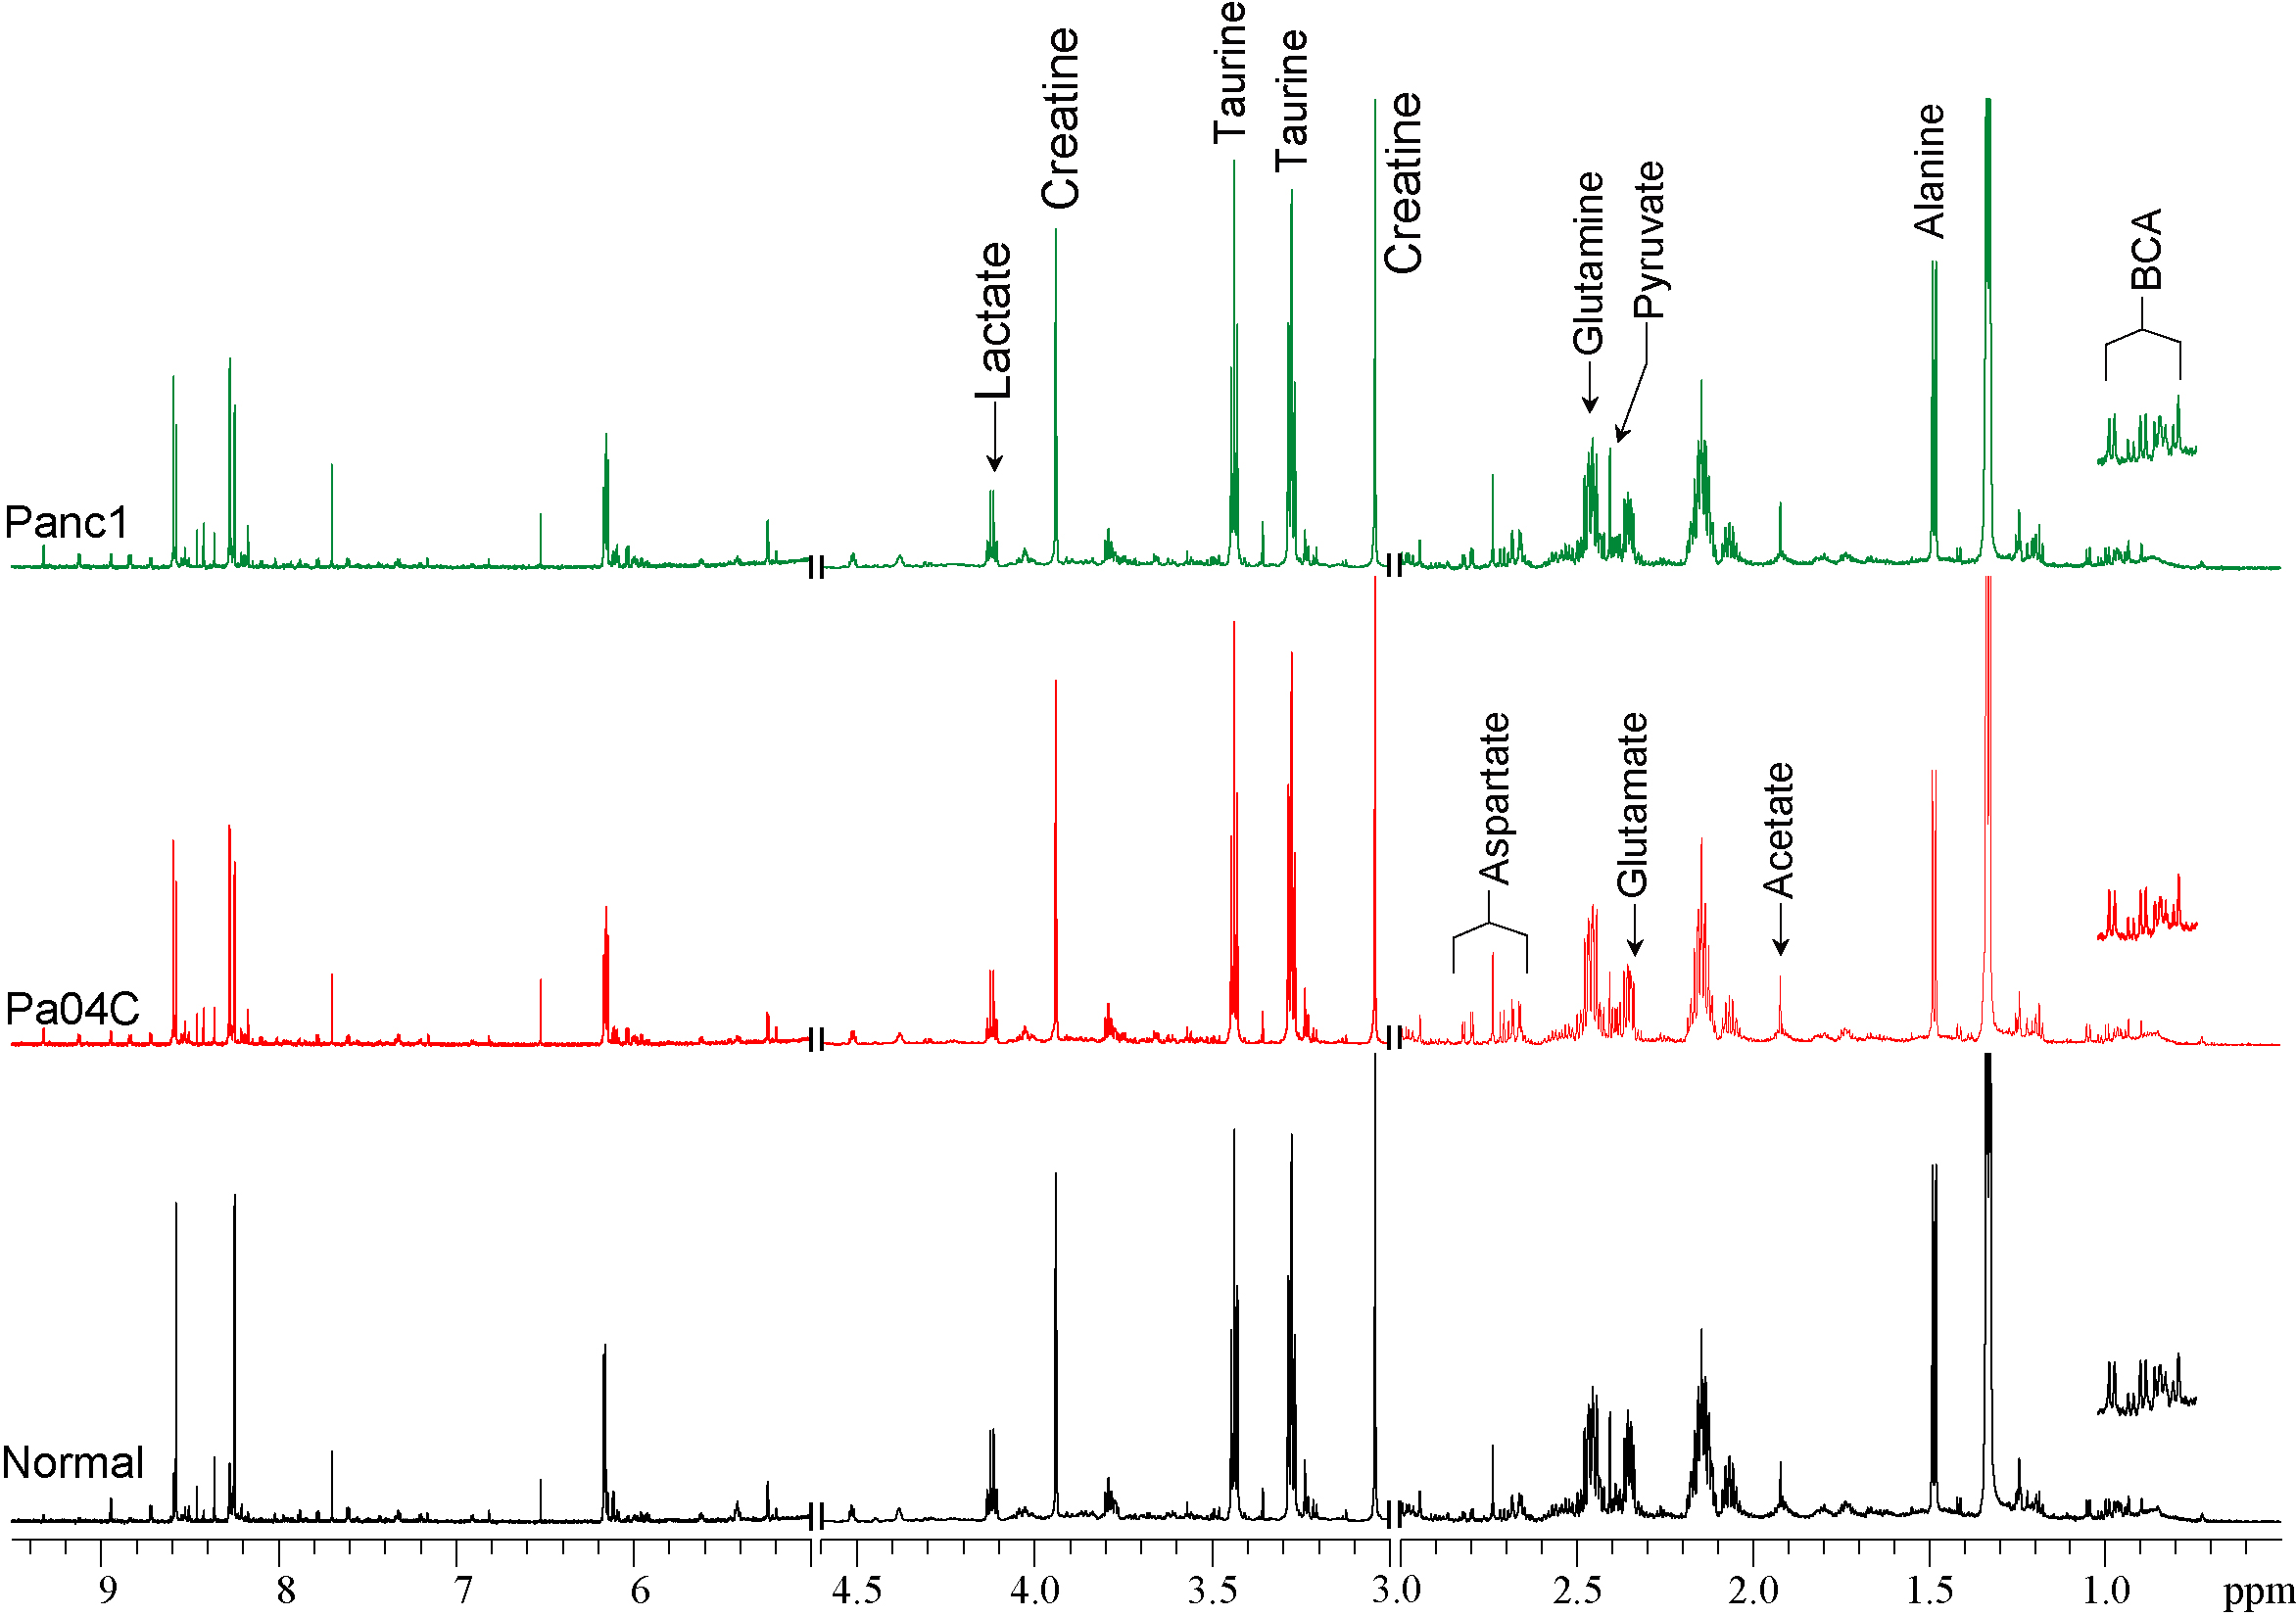
Figure 3: Representative
high-resolution 1H MR spectra of water soluble extracts from the hearts
of normal mice (black)) and Panc1 (green) and Pa04C (red) tumor bearing mice.
BCA; Branch Chain Amino acids.
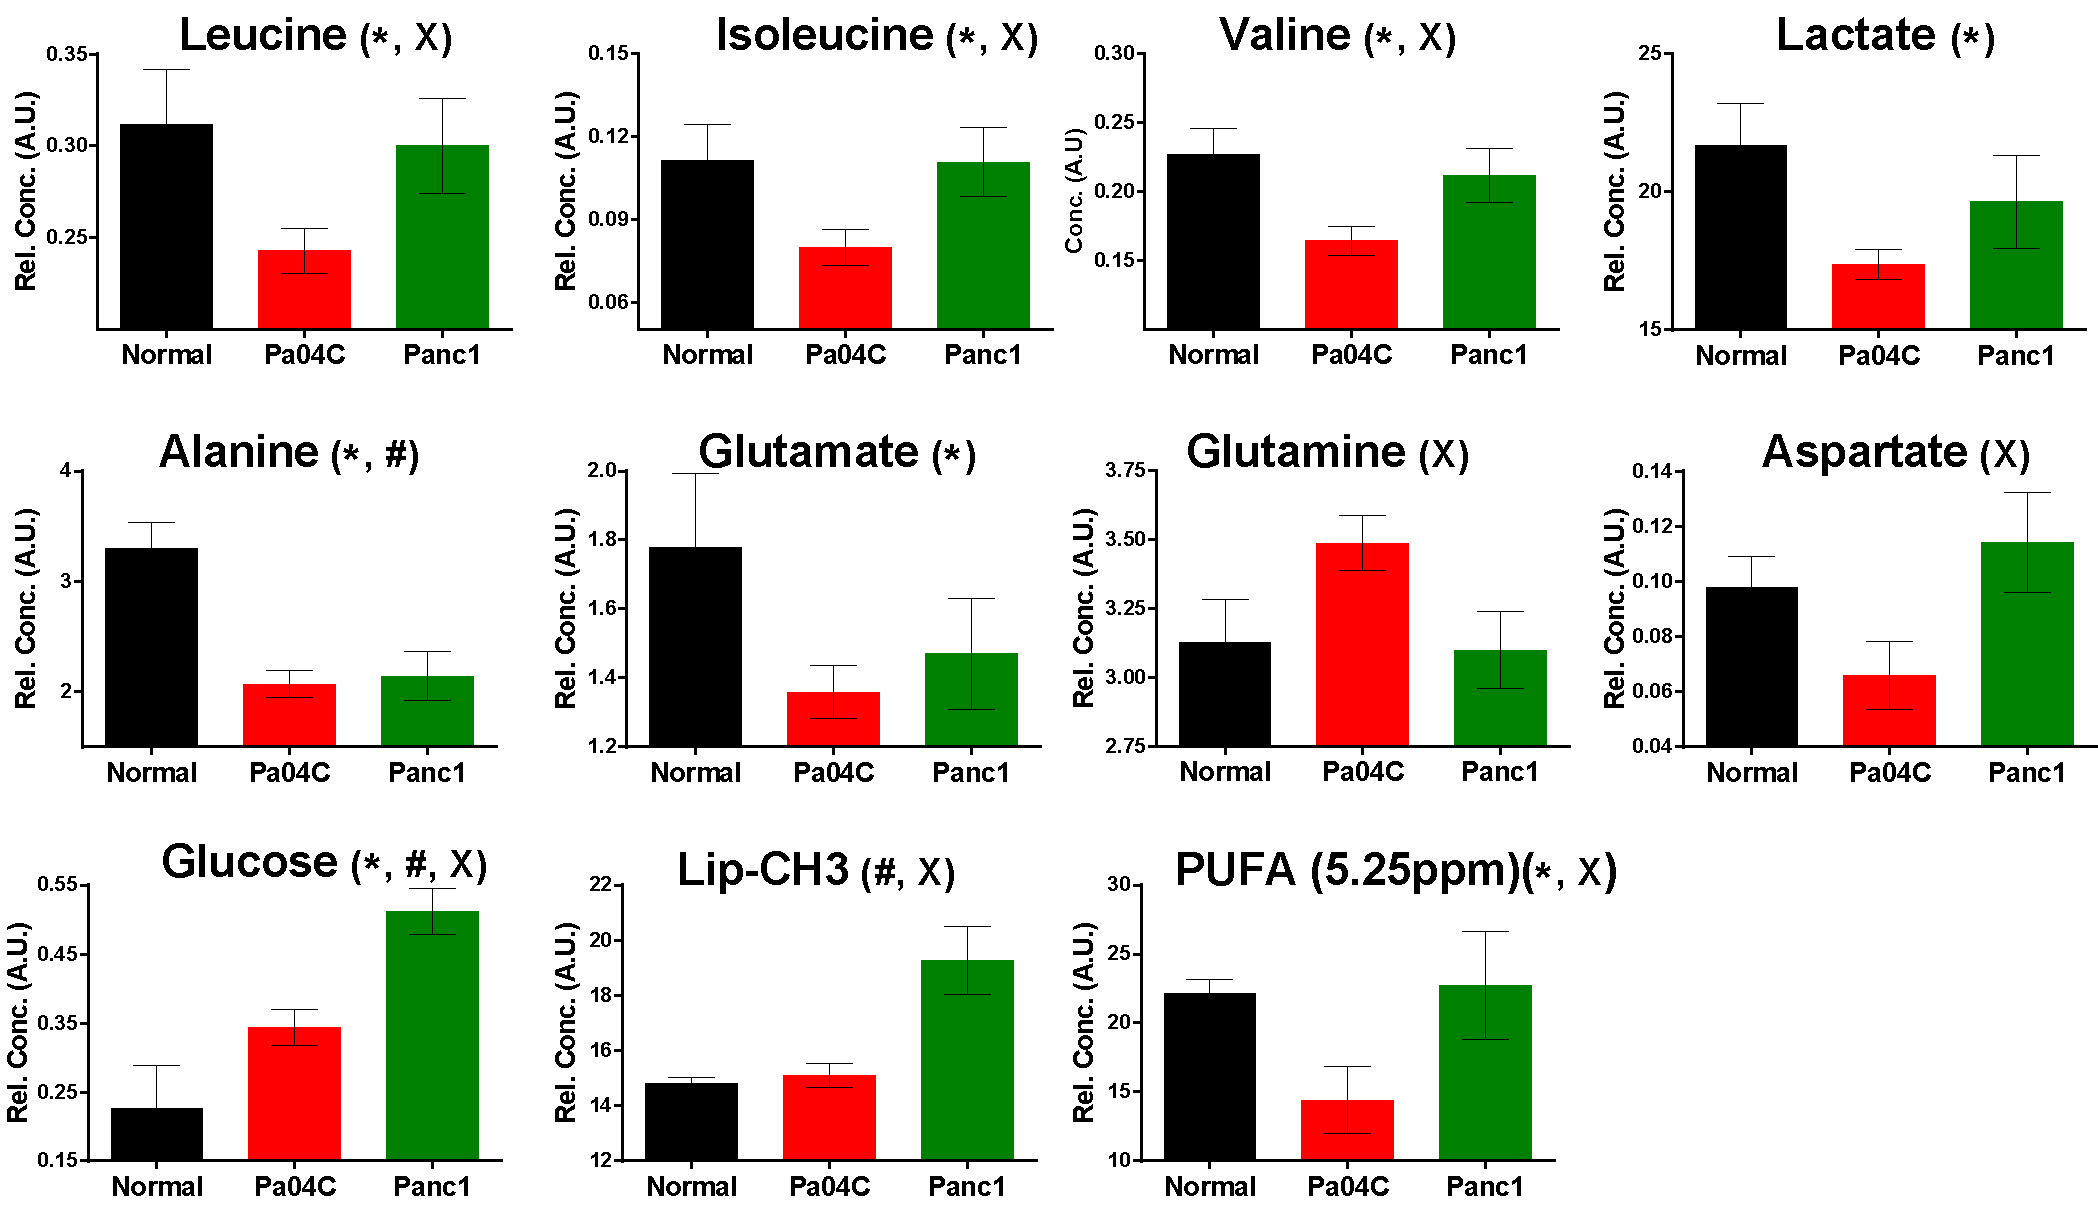
Figure 4: Quantitative
estimation of metabolites in hearts obtained from normal mice (n=5) and Pa04C
(n=13) and Panc1 (n=8) tumor bearing mice.
Values represent Mean + SEM. *
Represents significant difference between Normal vs Pa04c, # represents
significant difference between Normal vs
Panc1, and X represents significant
difference between Pa04C vs Panc1
respectively. PUFA; polyunsaturated
fatty acid peak at 5.28ppm was quantified. Lipid-CH3; -CH3 peak at 0.9ppm was
quantified.