1362
Comparison of in vivo MRS and ex vivo HR-MAS MRS for assessment of metabolite content in the GOT1 small intestine neuroendocrine tumour model1Dept. of Radiation Physics, University of Gothenburg, Gothenburg, Sweden, 2University of Gothenburg, Gothenburg, Sweden, 3Swedish NMR Center, University of Gothenburg, Gothenburg, Sweden, 4Dept. of medical physics and biomedical engineering, Sahlgrenska University hospital, Gothenburg, Sweden
Synopsis
In vivo characterisation of tumour metabolism using MRS would facilitate tumour therapy response assessment, but in vivo conditions may obscure the metabolic information acquired. In this study we investigate the information contained in in vivo MRS spectra of a neuroendocrine tumour model by correlating it to ex vivo HR-MAS MRS on excised tumour samples. Effects of post-mortem tissue degradation and tumour sample site on in vivo–ex vivo correlations are evaluated, and interpretation of in vivo data is discussed.
Introduction
Ex vivo high resolution magic angle spinning (HR-MAS) MRS of excised tumour tissue provides detailed information on tumour metabolic composition. However, non-invasive tumour therapy response assessment requires in vivo characterisation. This can be accomplished by in vivo MRS, but in vivo conditions limit the spectral quality, and make spectral information difficult to interpret.
The aim of this study was to evaluate the metabolic information offered by in vivo MRS of a human neuroendocrine tumour (NET) model, by comparing it to the information acquired from ex vivo HR-MAS MRS of the same tumour after excision, and to investigate if tissue sample site and post-mortem metabolic degradation influence ex vivo spectra.
Materials & Methods
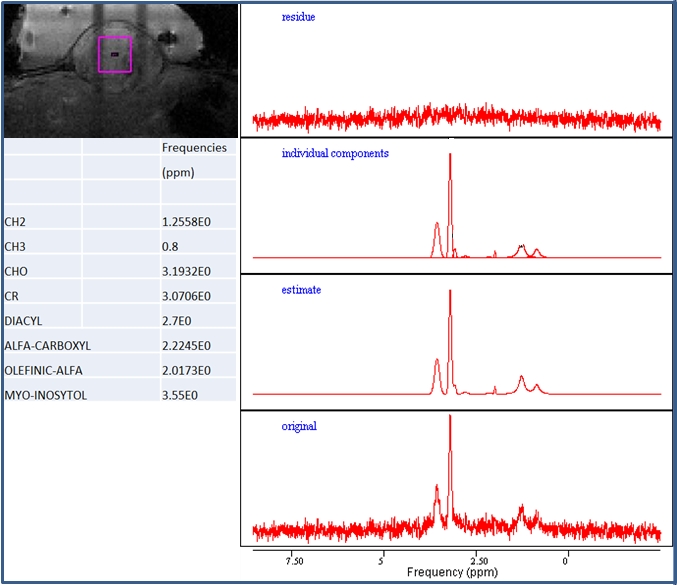
In vivo experiments were performed at 7T (Bruker, 4-ch phased array receiver coil) on mice (n=9) with subcutaneous xenografts of human NET. Animals were included in another study and had been subjected to a non-therapeutic amount of 177Lu-octreotate 14 days earlier. At study inclusion, tumour growth curves were similar to those of untreated tumours. MRS was performed in central tumour (3x3x3 mm3 volume, PRESS, TR/TE/NSA=30ms/2500ms/128 NA). Data were processed using jMRUI package with AMARES algorithm1. After MRS, the tumours were excised and central and peripheral tumour tissue was sampled for the HR-MAS experiment. Forty-five minutes after excision, central samples were transferred to a 3.2mm zirconia rotor for 1D HR-MAS experiments at room temperature (600 MHz Agilent, spinning speed: 5 kHz, TR: 5s, presat-pulse: 2s, water suppression). Matlab was used to process time-domain data using moderate exponential window function. Peripheral samples were run approximately 1-2 hours later. For tissue degradation assessment, two identical HR-MAS experiments, separated by 12h, were run on one sample. Fitted spectra were normalised to total peak area, and correlation between ex vivo and in vivo metabolite content was evaluated using linear regression and Bland-Altman plots. Influence of tissue sample position was evaluated by visually comparing spectra from central and peripheral tumour parts.Results
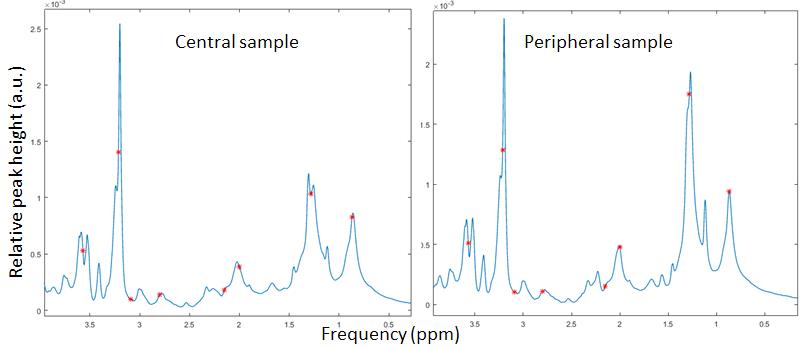
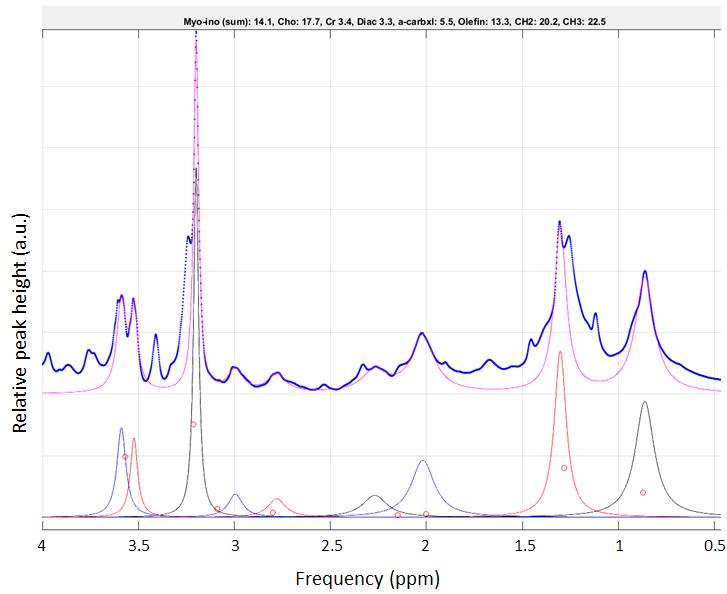
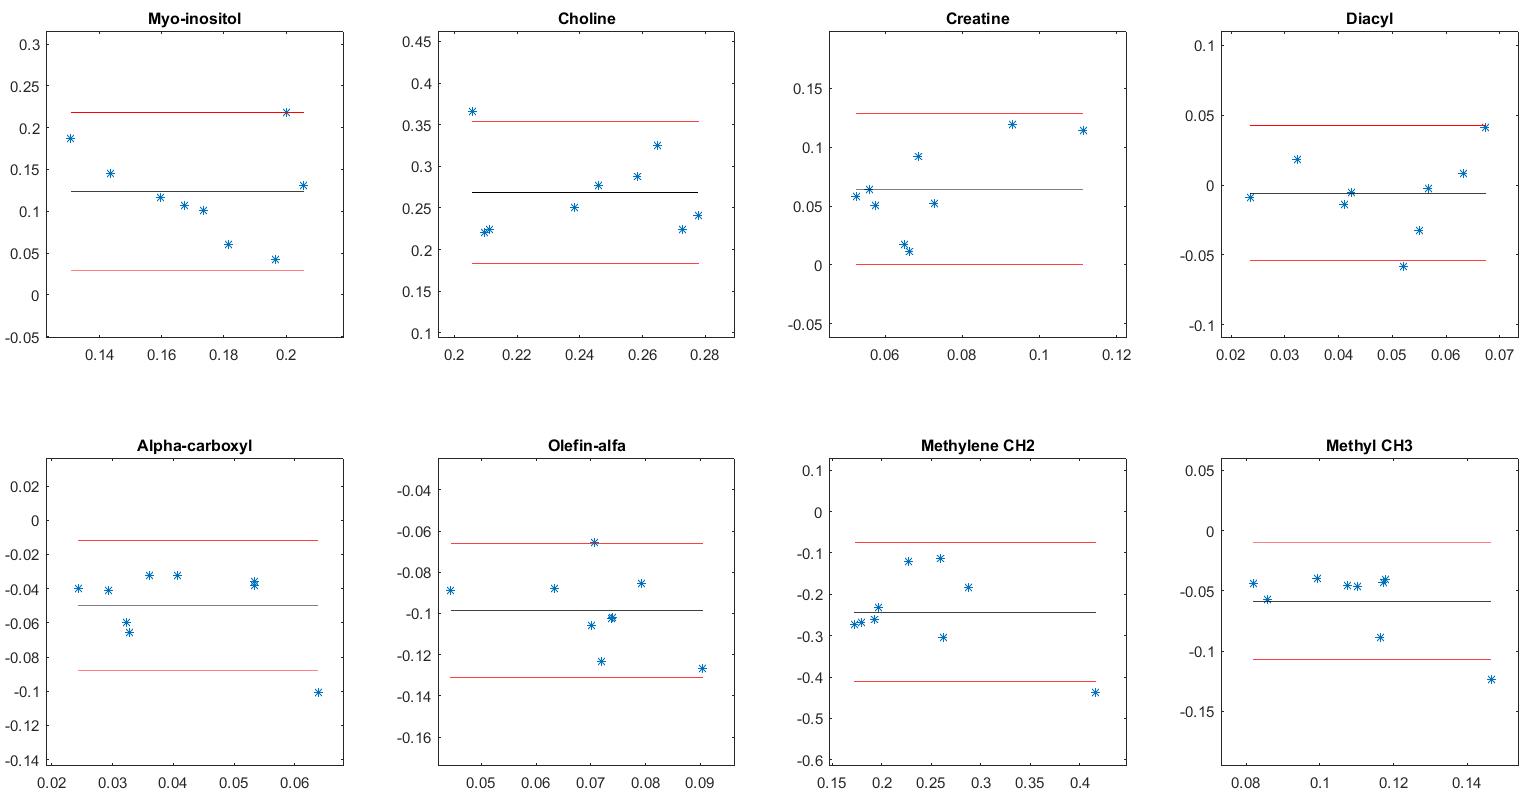
Nine metabolites were identified from in vivo MRS: methylene CH2, methyl CH3, choline, creatine, diacyl, alpha-carboxyl, olefin-alpha and myo-inosytol. In general, choline and myo-inositole were most prominent (Fig.1). Tissue sample site had considerable effect on some metabolite signals, most likely due to tumour heterogeneity. In the studied tumour, the relative CH2 and CH3 signal amplitudes were higher in peripheral tumour (Fig.2). Metabolite degradation was not observed for the 12h separated acquisitions (not shown). Signals observed in vivo were visible also ex vivo (Figs.2-3). However, ex vivo spectra often revealed several overlapping peaks, which probably added to the corresponding signal observed in vivo. No statistically significant correlation was found between in vivo and ex vivo relative peak areas for the investigated metabolites (not shown), but this was probably an effect of the qualitative method of analysis. Bland-Altman plots showed relatively good agreement between in vivo and ex vivo measured diacyl, alpha-carboxyl, olefin-alpha and methyl (~5% limits-of-agreement), whereas e.g. methylene varied substantially (~15% limits-of-agreement) (Fig.4).Discussion
In this study, we used literature-based prior knowledge to evaluate in vivo signal amplitudes. The positions of signals were then used as prior knowledge to fit components of ex vivo data, and relative signal amplitudes were compared. Although substantial similarities were observed between in vivo and ex vivo spectra, we could not demonstrate statistically significant correlations. The lack of correlation is probably attributable to the qualitative approach, and absolute quantification should be considered for this type of study. Tumour heterogeneity should also be considered when tumour tissue samples are analysed. We saw substantial differences in ex vivo spectra of central and peripheral tumour tissue, although not all metabolite signals were affected. The repeated, 12h separated HR-MAS acquisition of a tumour sample did not reveal substantial differences in relative metabolite concentration, which implies that differences between central and peripheral tumour were in fact due to intra-tumour heterogeneity, and not different post-mortem time to experiment. Metabolite degradation is probably more pronounced immediately after death, when e.g. continued glucose consumption under anaerobic conditions would increase lactate levels. Temperature and pH differences between ex vivo and in vivo conditions may impose frequency shifts on certain metabolites, but the temperature difference in our study (~17°C) should have negligible effects2.Conclusion
In vivo MRS of the studied NET model show similar metabolic profile as ex vivo HR-MAS MRS, and in vivo characterisation of this tumour model using MRS should be possible. However, knowledge about post-mortem stability of evaluated metabolites, as well as a quantitative assessment of the correlation between in vivo and ex vivo spectra should reduce the ambiguity of in vivo metabolite evaluation. In vivo identified signals should always be carefully interpreted, since they almost certainly represent several different metabolites.Acknowledgements
No acknowledgement found.References
1 Naressi A et al., Magma, Java-based graphical user interface for the MRUI quantitation package, 2001, 12(2-3) p. 141-152
2 Wermter FC et al., Magnetic Resonance Materials in Physics, Biology and Medicine, Temperature dependence of 1H NMR chemical shifts and its influence on estimated metabolite concentrations, 2017, p.
Figures