1361
Opto-functional Magnetic Resonance Spectroscopy (O-fMRS): investigating brain energetics under optogenetic and sensory stimulation1AG Experimentelle Magnetische Kernresonanz Translational Research Imaging Center (TRIC) Institut für, University Hospital Münster, Germany, Münster, Germany
Synopsis
For a better understanding of metabolic processes underlying neurovascular mechanisms, fMRS represents a suitable technique. The combination of fMRS and optogenetics (O-fMRS) should allow targeting the metabolism of specific cell populations during their activation. Our study aims at developing O-fMRS methodology in rat to provide further insight into brain energetics during activation. Here we establish a comparison between O-fMRS and sensory-fMRS in the rat forepaw cortex to investigate whether energetic demands are similar.
Purpose
The combination of optogenetics and functional MRI (Opto-fMRI) offers a non-invasive means to investigate the impact of defined cellular populations on local and global networks of the brain. BOLD responses based on the neurovascular coupling (NVC) were shown to be highly similar in the rat somatosensory cortex under either optogenetic or sensorystimulation(1). However, for a deeper understanding of NVC mechanisms, the underlying metabolism must be probed. The purpose of this work is to explore the potential of the combination of optogenetics and functional MR spectroscopy (O-fMRS) in the rat somatosensory cortex and to verify whether metabolic changes resulting from optogenetic stimulation of glutamatergic neurons are comparable to those of sensory stimulation.
Methods
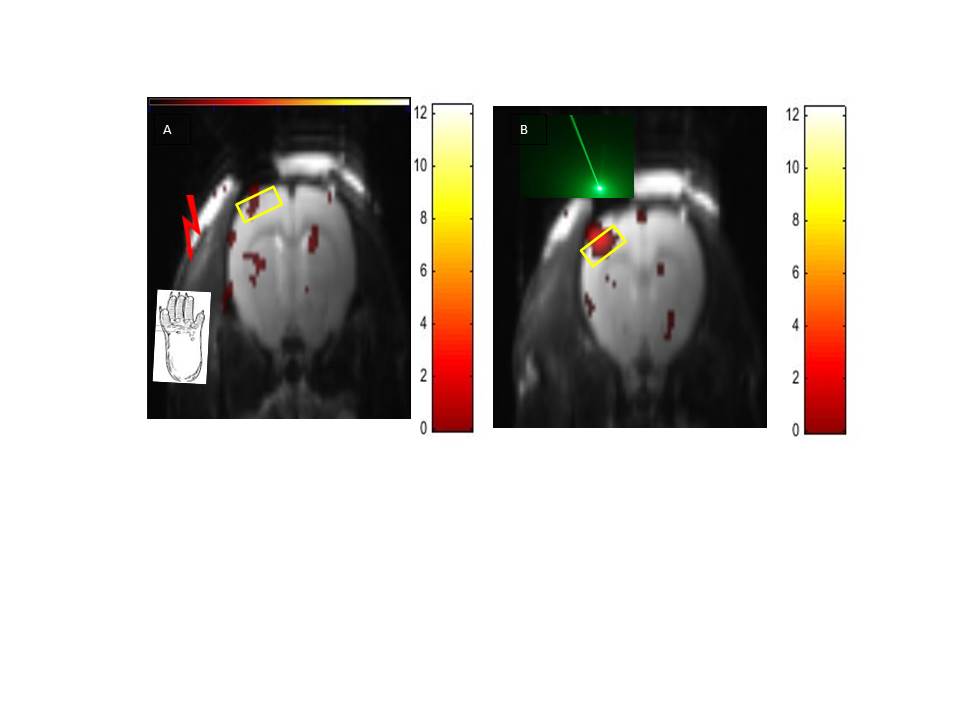
An optical fiber (OF) was implanted on the day of fMRS into the S1FL of virally transduced Fisher rats (injection of AAV2-CamKII-C1V1 four weeks prior). Animals (N=8) were intubated and placed in a stereotactic cradle. All measurements were performed on a 9.4T small animal MR scanner (Bruker Biospin, Germany) using a volume coil for transmission (Rapid Biomedical, Germany.) and a 20mm single loop surface coil for reception under medetomidine sedation. Body temperature (37°±1°C) and respiration rate were continuously monitored. Optogenetic (1ms, 9Hz) and electrical (1ms, 9Hz, 1-1.2mA) stimulations were performed using a repeated 5minOFF-5minON block paradigm (repeated up to 4 times) in an interleaved manner for each rat. Green laser light was delivered through the OF. STEAM 1H-fMRS was conducted with optimized OVS and VAPOR pulses. FASTMAP-shimmed spectra were acquired in a 10µl VOI localized over the activated S1FL region previously determined with BOLD fMRI encompassing the tip of the OF. Unsuppressed water spectra were also acquired. BOLD fMRI series were analyzed using SPM12 (Fig1). 1H-MR spectra were processed using in-house written Matlab routines. Finally, a moving average allowing the temporal resolution to be reduced to 42s was used to obtain [lactate] (Lac), [glutamate] (Glu), [glutamine](Gln) and [aspartate] (Asp) time courses: 4 blocks of 8 successive FIDs were summed per paradigm resulting in 128 FIDs per timepoint that were averaged for each rat after careful phasing and realignment, and transferred to LCModel for quantification. Cramer-Rao Lower bounds (CRLB) <40% were deemed acceptable for low concentrated metabolites such as [Lac] and [Asp] and <20% for all other metabolites. Time- averaged concentrations were compared using a one-way ANOVA followed by a Tukey post-hoc test. Changes between rest and stimulation were considered significant for a p-value < 0.05.Results
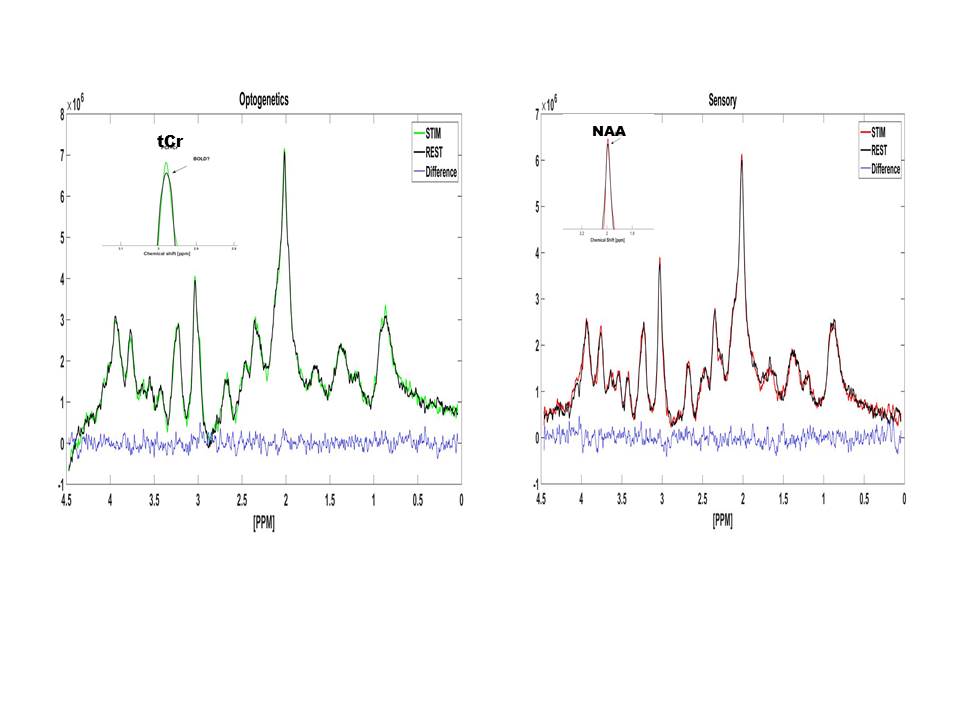
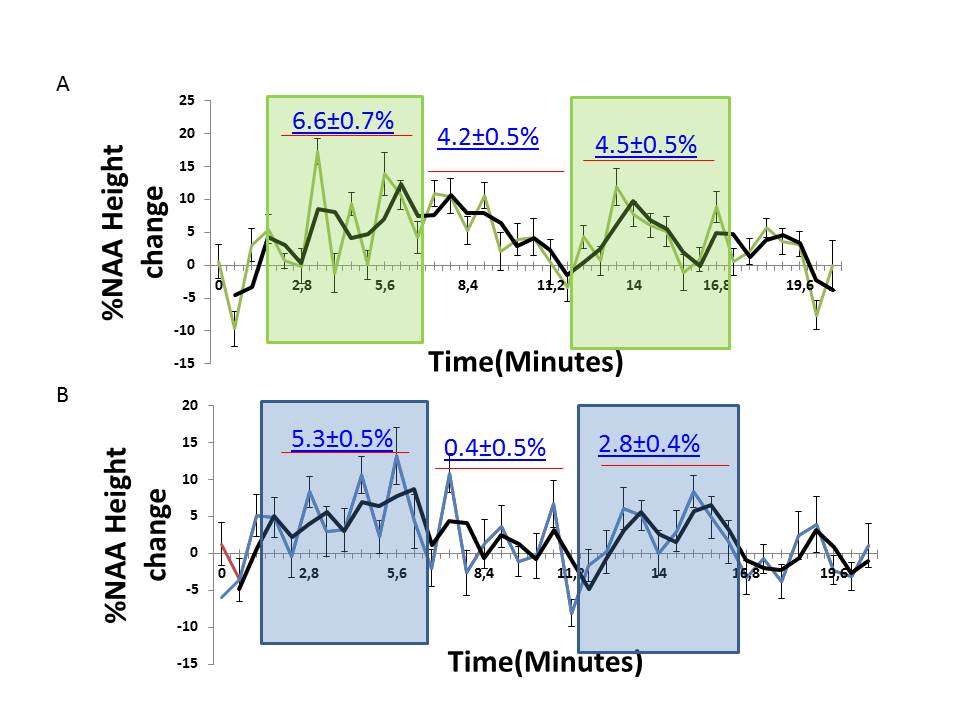
Fig.2A and Fig.2B show stimulated spectra acquired during optogenetic (green) and sensory stimulation (red) overlaid with their respective spectra acquired at rest (black) for 7 rats. Spectra acquired with either optogenetic or sensory stimulation both demonstrated an increase in mean NAA and tCr peak amplitudes due to the BOLD effect ranging between 2±1% and 7±2% respectively (Insets). The relative change in NAA peak amplitude followed the stimulation paradigm for both optogenetic and sensory stimulations (Fig3).
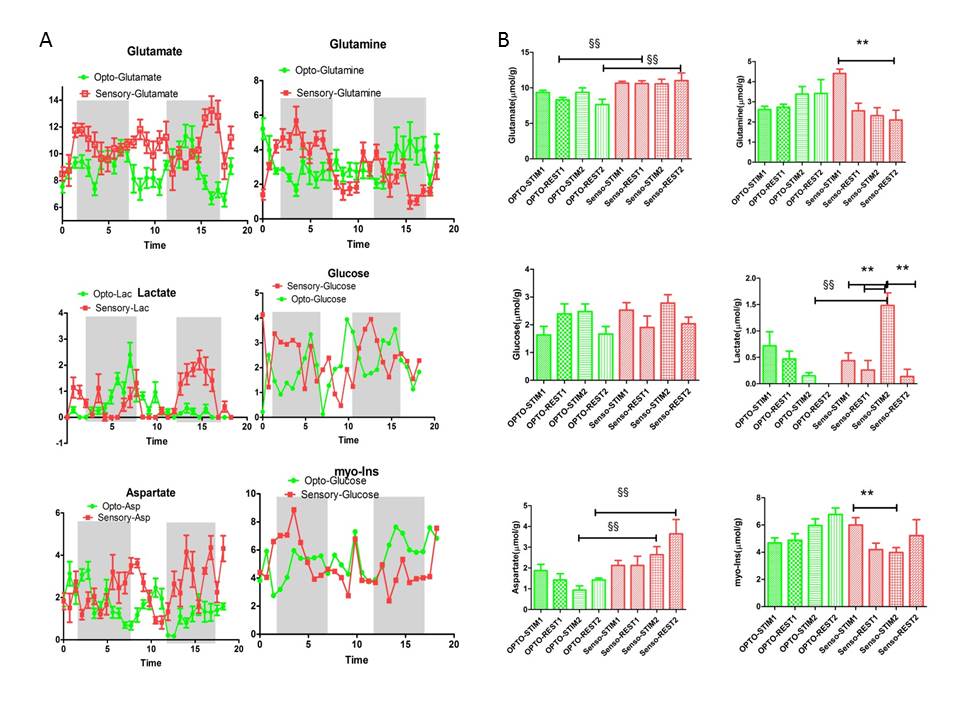
Glu, Gln, Glc, Asp, Lac and myo-Ins timecourses were obtained for both optogenetic and sensory experiments in the same rats (Fig 4A). Upon optogenetic stimulation, [Glu] (+12% and +22%) and [Lac] (+53%) showed tendencies (p>0.05) to increase relative to rest periods (Fig4.B) while [Gln] (p=0.0002), [Lac] (p=0.0003) and [myo-Ins] (p<0.04) were significantly increased upon sensory stimulations. Moreover significant differences were found between optogenetic and sensory procedures for Glu, Lac and Asp (p<0.002) (Fig4.B).
Discussion and Conclusion
In this study, O-fMRS and sensory–fMRS were compared for the first time in the rat primary somatosensory cortex. Although, O-fMRS did not reveal significant metabolic changes, time courses show interesting patterns such as increased Glu and Lac levels during stimulations matching previous findings(2). Moreover Glu and Gln timecourses reveal shifted patterns of activation in line with Glu-Gln cycle theories while short episodes of Asp decreases can be seen particularly for optogenetic stimulations. In addition, significant differences between metabolite levels between optogenetic and sensory stimulations suggest that further investigations together with a larger population size are needed to confirm current findings.
Although challenging in rats, fMRS demonstrates potential in combination with optogenetics for a better understanding of brain energetics during brain activation. Our study shows the necessity to further develop fMRS methodology for improved assessment of metabolic changes during brain activation.
Acknowledgements
No acknowledgement found.References
(1) Schmid F, Wachsmuth L, Schwalm M, Prouvot PH, Jubal ER, Fois C, Pramanik G, Zimmer C, Faber C, Stroh A.Assessing sensory versus optogenetic network activation by combining (o)fMRI with optical Ca2+ recordings.J Cereb Blood Flow Metab. 2016 Nov;36(11):1885-1900.
(2) Just N, Xin L, Frenkel H, Gruetter R.Characterization of sustained BOLD activation in the rat barrel cortex and neurochemical consequences.Neuroimage. 2013 Jul 1;74:343-51. doi: 10.1016/j.neuroimage.2013.02.042.
Figures