1360
13C Magnetic Resonance Spectroscopy: Study of sperm metabolism under a hypoxic atmosphere.1Academic Unit of Radiology, University of Sheffield, Sheffield, United Kingdom, 2Faculty of Health Science, Universiti Sultan Zainal Abidin, Terengganu, Malaysia, 3Academic Unit of Reproductive & Developmental Medicine, University of Sheffield, Sheffield, United Kingdom
Synopsis
Studying energy metabolism in sperm may be helpful in understanding the relationship between motility and infertility. To understand sperm metabolism, we acquired 13C MR spectra during incubation with 13C-glucose in a normal and hypoxic atmosphere. Studies suggested that glycolysis is the main pathway for energy metabolism in sperm but whether glycolysis or oxidative phosphorylation(OXPHOS) dominates varies among species. This study examined the effect of hypoxia on sperm energy metabolism, with a secondary aim to observe Krebs cycle intermediates in the MR spectrum. Lactate signal in the hypoxia group was significantly higher than in the normoxia group. No Krebs cycle intermediate was detected.
Introduction
1 in 5 young men have poor semen quality, including low motility. An understanding of energy metabolism may play an important role in understanding male infertility. Some studies have suggested that glycolysis is the main pathway required for sperm energy production1 but whether glycolysis or oxidative phosphorylation dominates varies among species2. Sperm also have a capability to shift between these pathways when oxygen availability has changed3. In order to understand sperm metabolism, we acquired 13C Magnetic Resonance (MR) spectra incubated with 13C labelled glucose both in a normal and hypoxic atmosphere, with a secondary aim to observe Krebs cycle intermediates in the MR spectrum.Methods
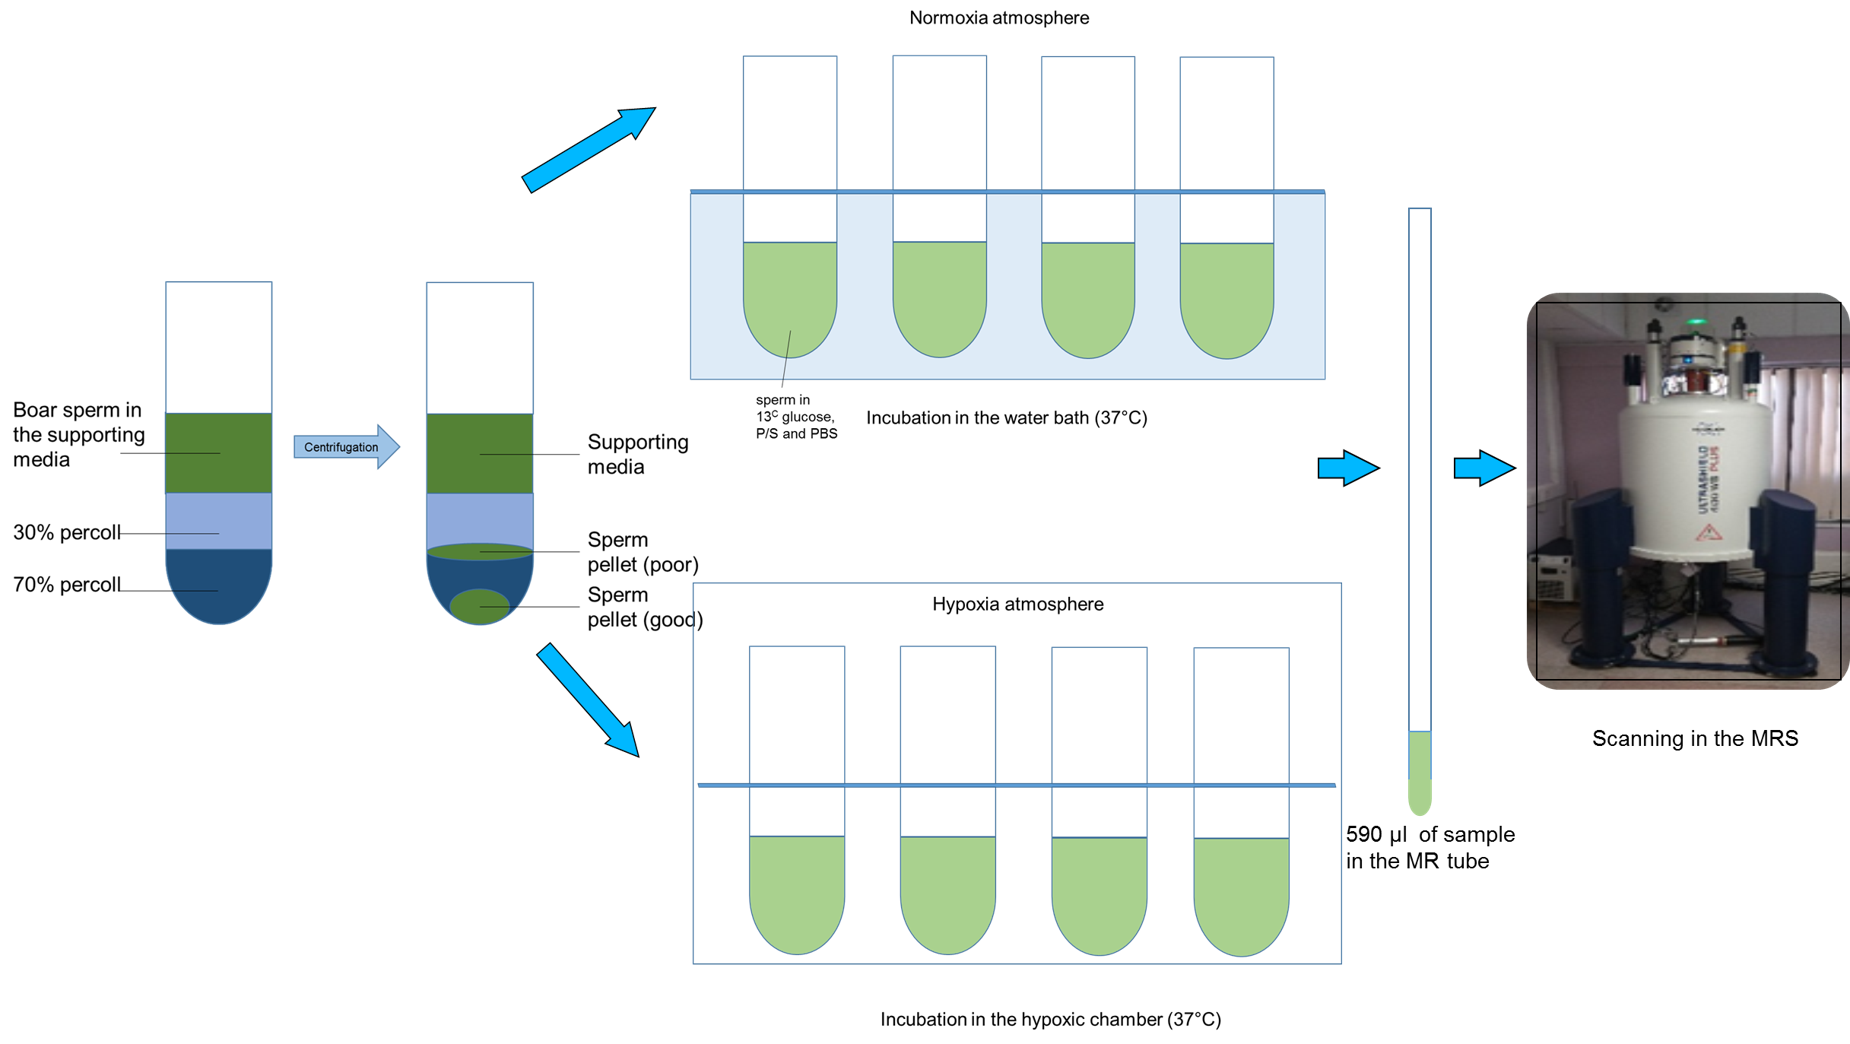
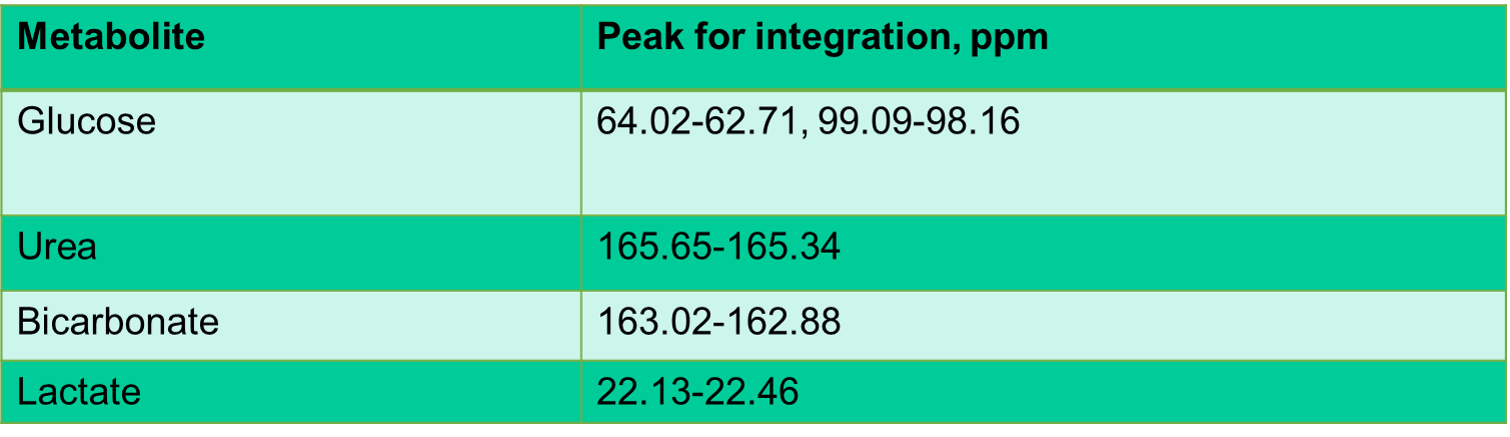
Boar sperm (n=13 ejaculates) were pelleted from supporting fluid using a 30/70% Percoll density centrifugation method4. For the hypoxia group, 100µl of sperm pellet was added to media (398µl of 1xPBS, 60µl of 100mM 13Cu-glucose, and 12µl penicillin/streptomycin) that had been equilibrated for >19h prior to the day of the experiment, in a hypoxic chamber (0.8% oxygen, 5% carbon dioxide and 94.2% nitrogen). For the normoxia group, 100µl of sperm sample was added to media, as above, at atmospheric oxygen concentration. Both groups were incubated for 4 hours at 37oC after which the samples were frozen (without preservative)(Figure 1). Thawed samples were added to a 5mm MR tube with 10µl of 200mM 13C urea (frequency/concentration reference), 10µl D2O and scanned using a 9.4T MR spectrometer with a 5mm BBO probe at 21°C. 13C spectra were acquired using a 13C{1H} inverse-gated pulse sequence (SW=239ppm, NS=4096, AQ=0.5s, TR=2s, flip angle=16°). Spectra were phase and baseline corrected using Bruker Topspin v2.1 software. Peak integrals and integration range were determined for metabolite based on pre-defined chemical shift ranges (Table 1). To normalize the spectra, the glucose integrals were divided by the urea integrals and the lactate was divided by the urea and sperm concentration. Sperm count and motility assays were carried out in each sample for normalization and quality assessment5. A paired t-test was used for comparison between lactate and glucose integrals, for the control and hypoxia groups. The significance value for all tests was p <0.05. Values are quoted are mean±SD.Results
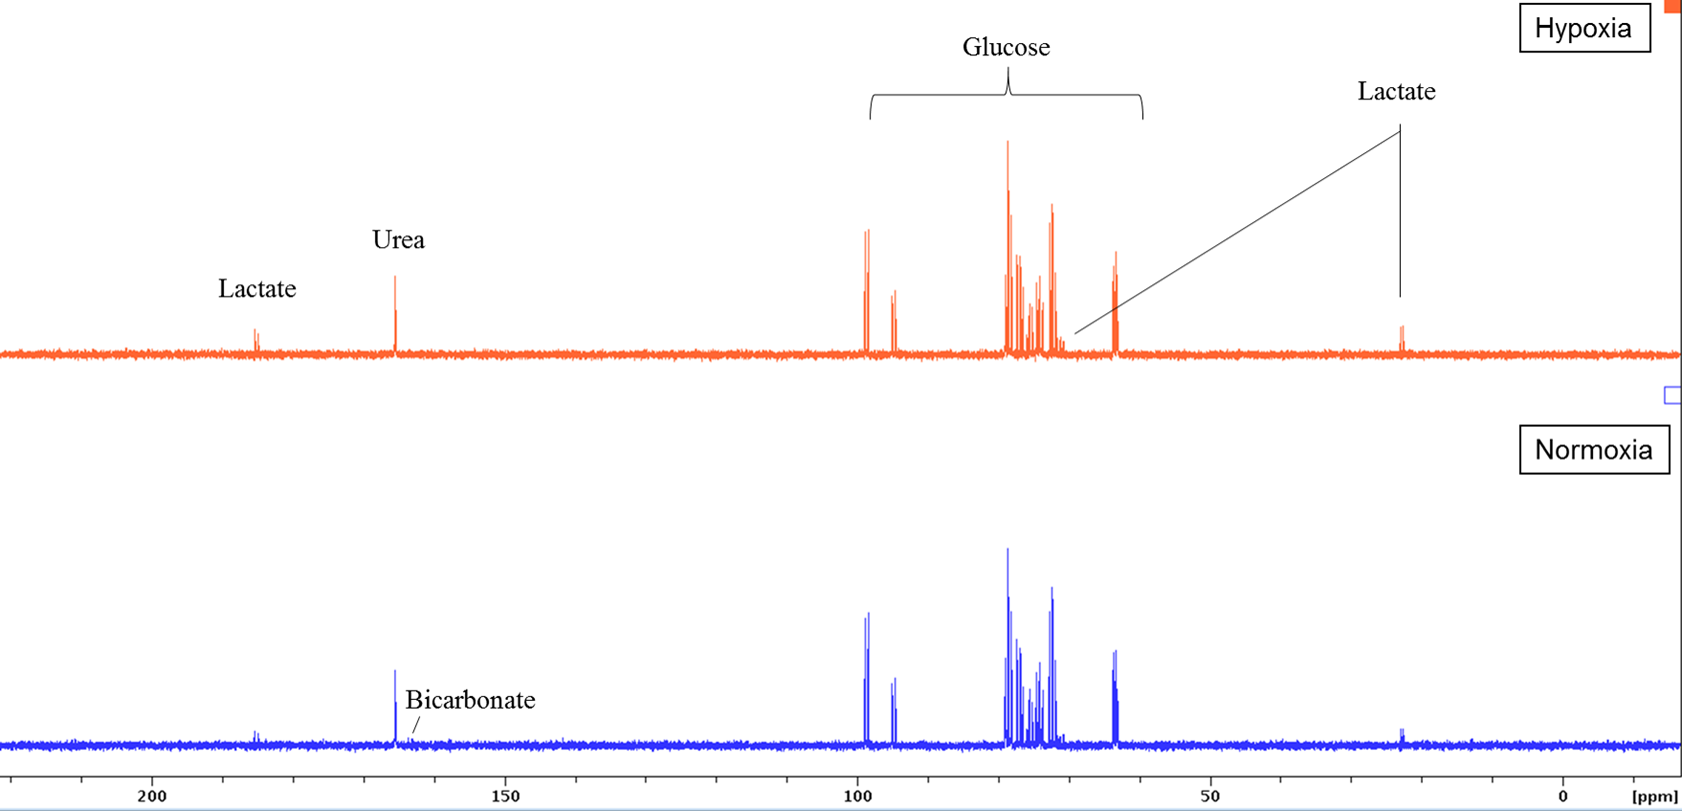
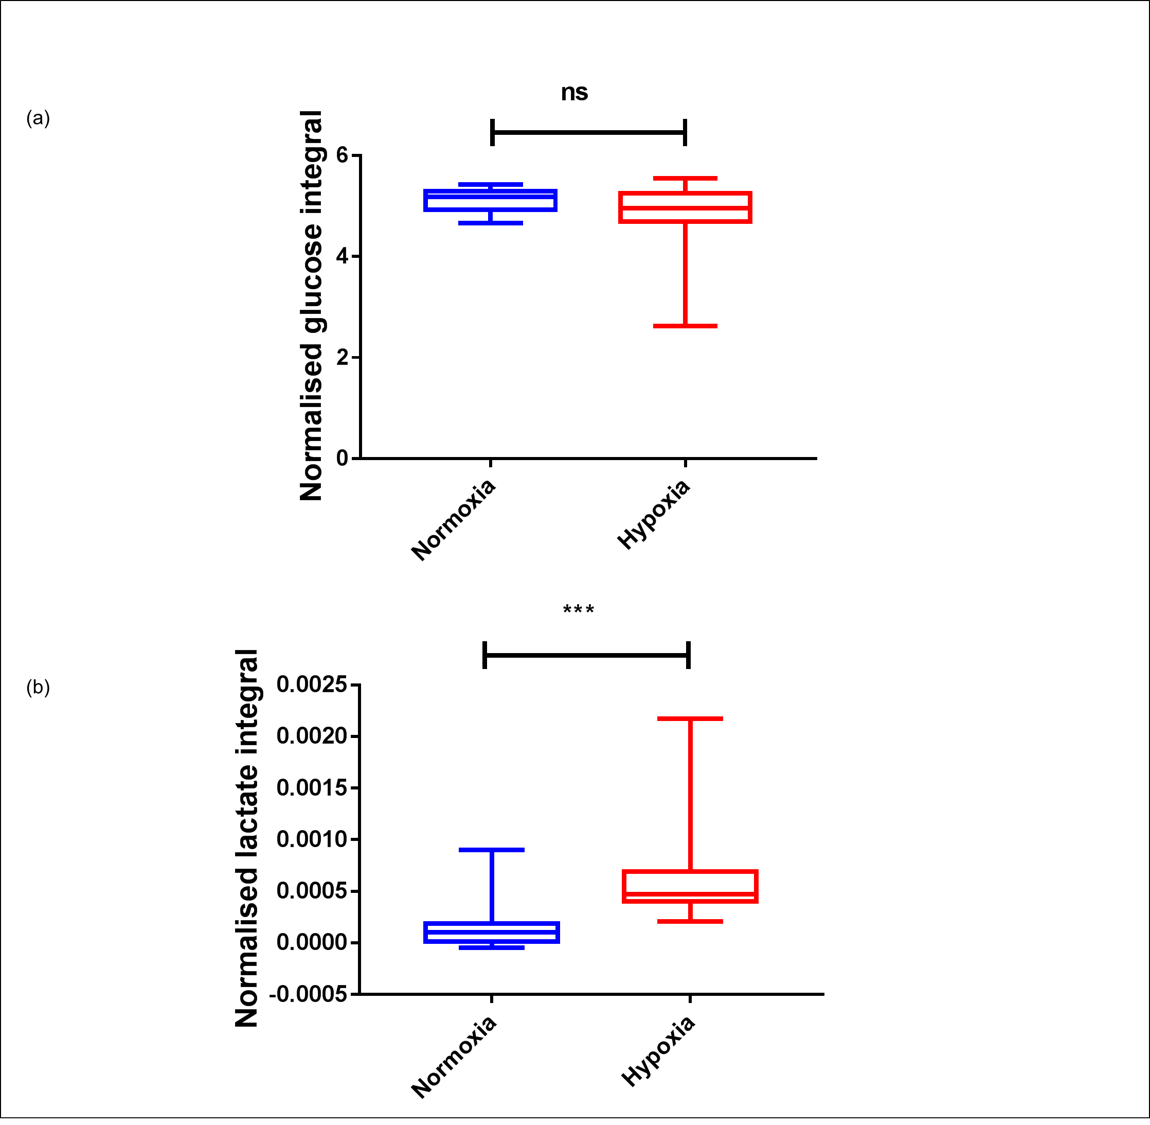
Sperm concentrations used for MRS experiments were 107.5-364.3 x10⁶/ml with progressive motility between 2.7 and 27.9%. No Krebs cycle intermediates were observed but lactate and bicarbonate were detected in the spectra of both group (Figure 2). Although a bicarbonate peak was detected (n=3) it was not included in the statistical analysis because in the remaining spectra the signal to noise was less than 3:1. There was no significant difference between glucose uptake in the normoxia and hypoxia groups (p=0.19) (Figure 3a). However, lactate integral in the hypoxia group was significantly higher (0.0006±0.0005) than in the normoxia group (0.0001± 0.0002) (p=0.0002) (Figure 3b).Discussion
The presence of lactate may be a marker of anaerobic glycolysis whereas bicarbonate represents OXPHOS. However, without observation of Krebs cycle intermediates, we were unable to demonstrate that the bicarbonate was from OXPHOS or another pathway. There was no difference in glucose level probably because the starting concentration of glucose was high so that the MR signal was not sufficiently changed. The high lactate integral compared to low bicarbonate levels, in both groups, suggests the main energy pathway was anaerobic glycolysis. The levels of lactate increased under hypoxic atmosphere indicating that pyruvate was derived more rapidly from glycolysis than in a normal oxygen atmosphere. Further study, including the effect of hyperoxia and the use of Dynamic Nuclear Polarisation methodology, are needed to confirm this preliminary finding.Acknowledgements
No acknowledgement found.References
1. Miki K. S. Reprod Fertil. 2007;65:309-325.
2. Makler A et al. Syst Biol Reprod Med. 1992;29(3):255-261.
3. Nelson DL. Lehninger Principles Of Biochemestry, 2008;Vol. 53(9)
4. Lessley BA et all. Gamete Res. 1983;7(1):49-61.
5. World Health Organization. 2010;5th:286.
Figures