1356
Exploring metabolite profiling of patients with secondary progressive multiple sclerosis1Department of Brain and Behavioural Sciences, University of Pavia, Pavia, Italy, 2Queen Square MS Centre, UCL Institute of Neurology, Faculty of Brain Sciences, University College London, London, United Kingdom, 3Brain Connectivity Center, C.Mondino National Neurological Institute, Pavia, Italy, 4Centre for Clinical Brain Sciences, University of Edinburgh, Edinburgh, United Kingdom, 5Dental Translational and Clinical Research Unit, School of Dentistry, Faculty of Medicine and Health, University of Leeds, Leeds, United Kingdom, 6Department of Neurology, Barts and the London NHS Trust, London, United Kingdom, 7Edinburgh Clinical Trials Unit, Usher Institute of Population Health Sciences and Informatics, University of Edinburgh, Edinburgh, United Kingdom, 8Division of Health Sciences, University of Warwick, Coventry, United Kingdom, 9Institute for Science and Technology in Medicine, Keele University, Keele, United Kingdom, 10Academic Department of Neuroscience, Royal Hallamshire Hospital, Sheffield, United Kingdom, 11Brain MRI 3T Research Centre, C. Mondino National Neurological Institute, Pavia, Italy
Synopsis
Proton magnetic resonance spectroscopic imaging (MRSI) quantifies brain metabolism in vivo and has the potential of uncovering the mechanism of action of therapeutic drugs. In this study, we assessed the baseline metabolic profile of 161 patients with secondary progressive multiple sclerosis (SPMS) against a control population by applying a short TE PRESS MRSI protocol at 3T. Based on the results the SPMS population could be divided into different groups (normal/biochemically abnormal) suggesting biochemical heterogeneity within SPMS patients.
Introduction
Secondary progressive multiple sclerosis (SPMS) is a highly disabling condition currently untreatable. In order to develop effective therapies for SPMS, a better understanding of the mechanisms underlying its pathophysiology is required. Proton magnetic resonance spectroscopic imaging (MRSI) offers a tool to investigate alteration or preservation of metabolite concentrations. In this study, we explored a novel approach for assessing the metabolic profile of a cohort of SPMS patients enrolled in a single centre multi-arm drug trial, against controls.Methods
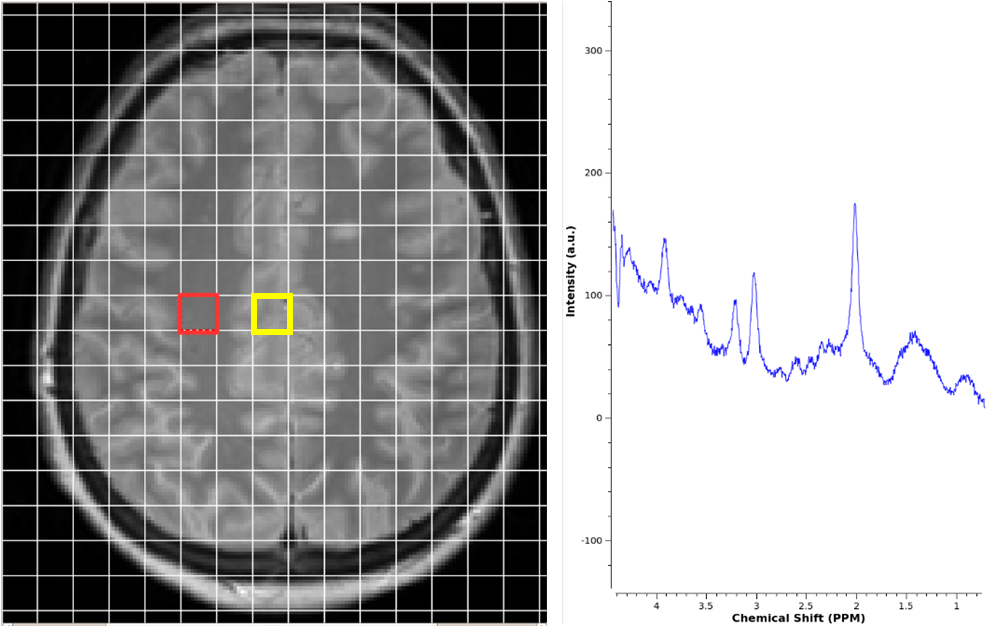
Acquisition: 161 patients (age 55±10yrs) with SPMS (Expanded Disability Status Scale score 4.0-6.5) and 9 healthy controls (HC) (age 48±6yrs) underwent a proton MRSI protocol at 3T (Philips Achieva). A 2-dimensional chemical shift imaging matrix, using short-TE PRESS (TR/TE 2000/35 ms), FOV=210x160mm, 15mm slice, matrix 21x16, 10-minute sequence and 15mL voxels, was acquired through the cerebral hemispheres, with CHESS water suppression.
Data Processing: Data were processed using LCmodel1 and included N-acetyl aspartate (NAA), Glutamate+glutamine (Glx), Myo-inositol (mIns), total choline (Cho) and total creatine (Cr). Absolute concentrations were found using a water reference scan. Two voxels in the parietal normal appearing white and grey matter (NAWM and NAGM) were selected for each subject (Fig. 1), overlapping the CSI matrix with a corresponding T2w image and taking into account the quality of spectra (peaks shapes, signal to noise ratio>14, FWHM<0.122ppm). The fit of the spectrum was assessed based on the Cramer Rao Lower Bounds values and found to be robust only if CRLB’s of reported metabolites were <20%. The mean and standard deviation of the HCs were found in order to help assess deviation from “normal” in the SPMS group.
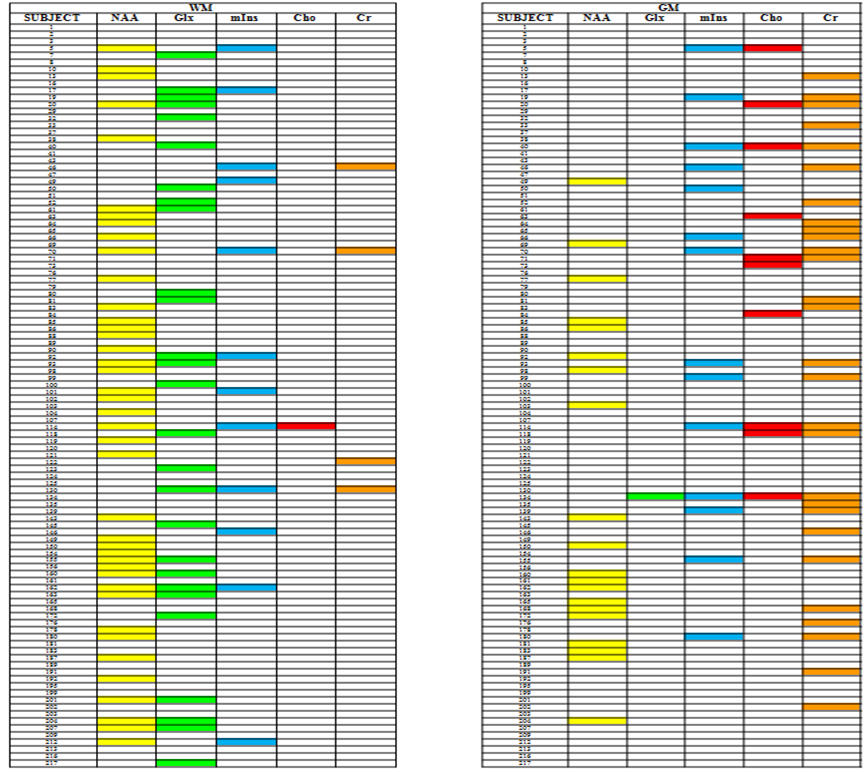
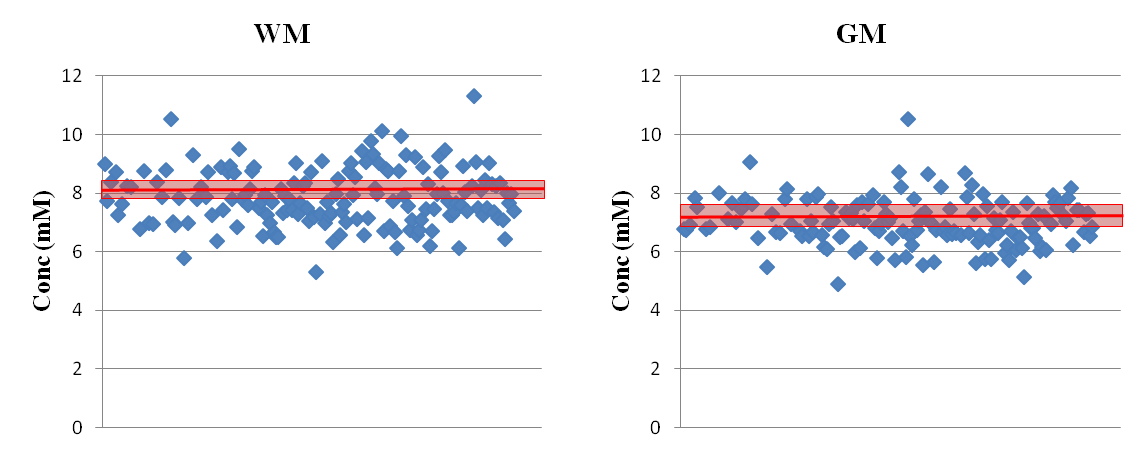
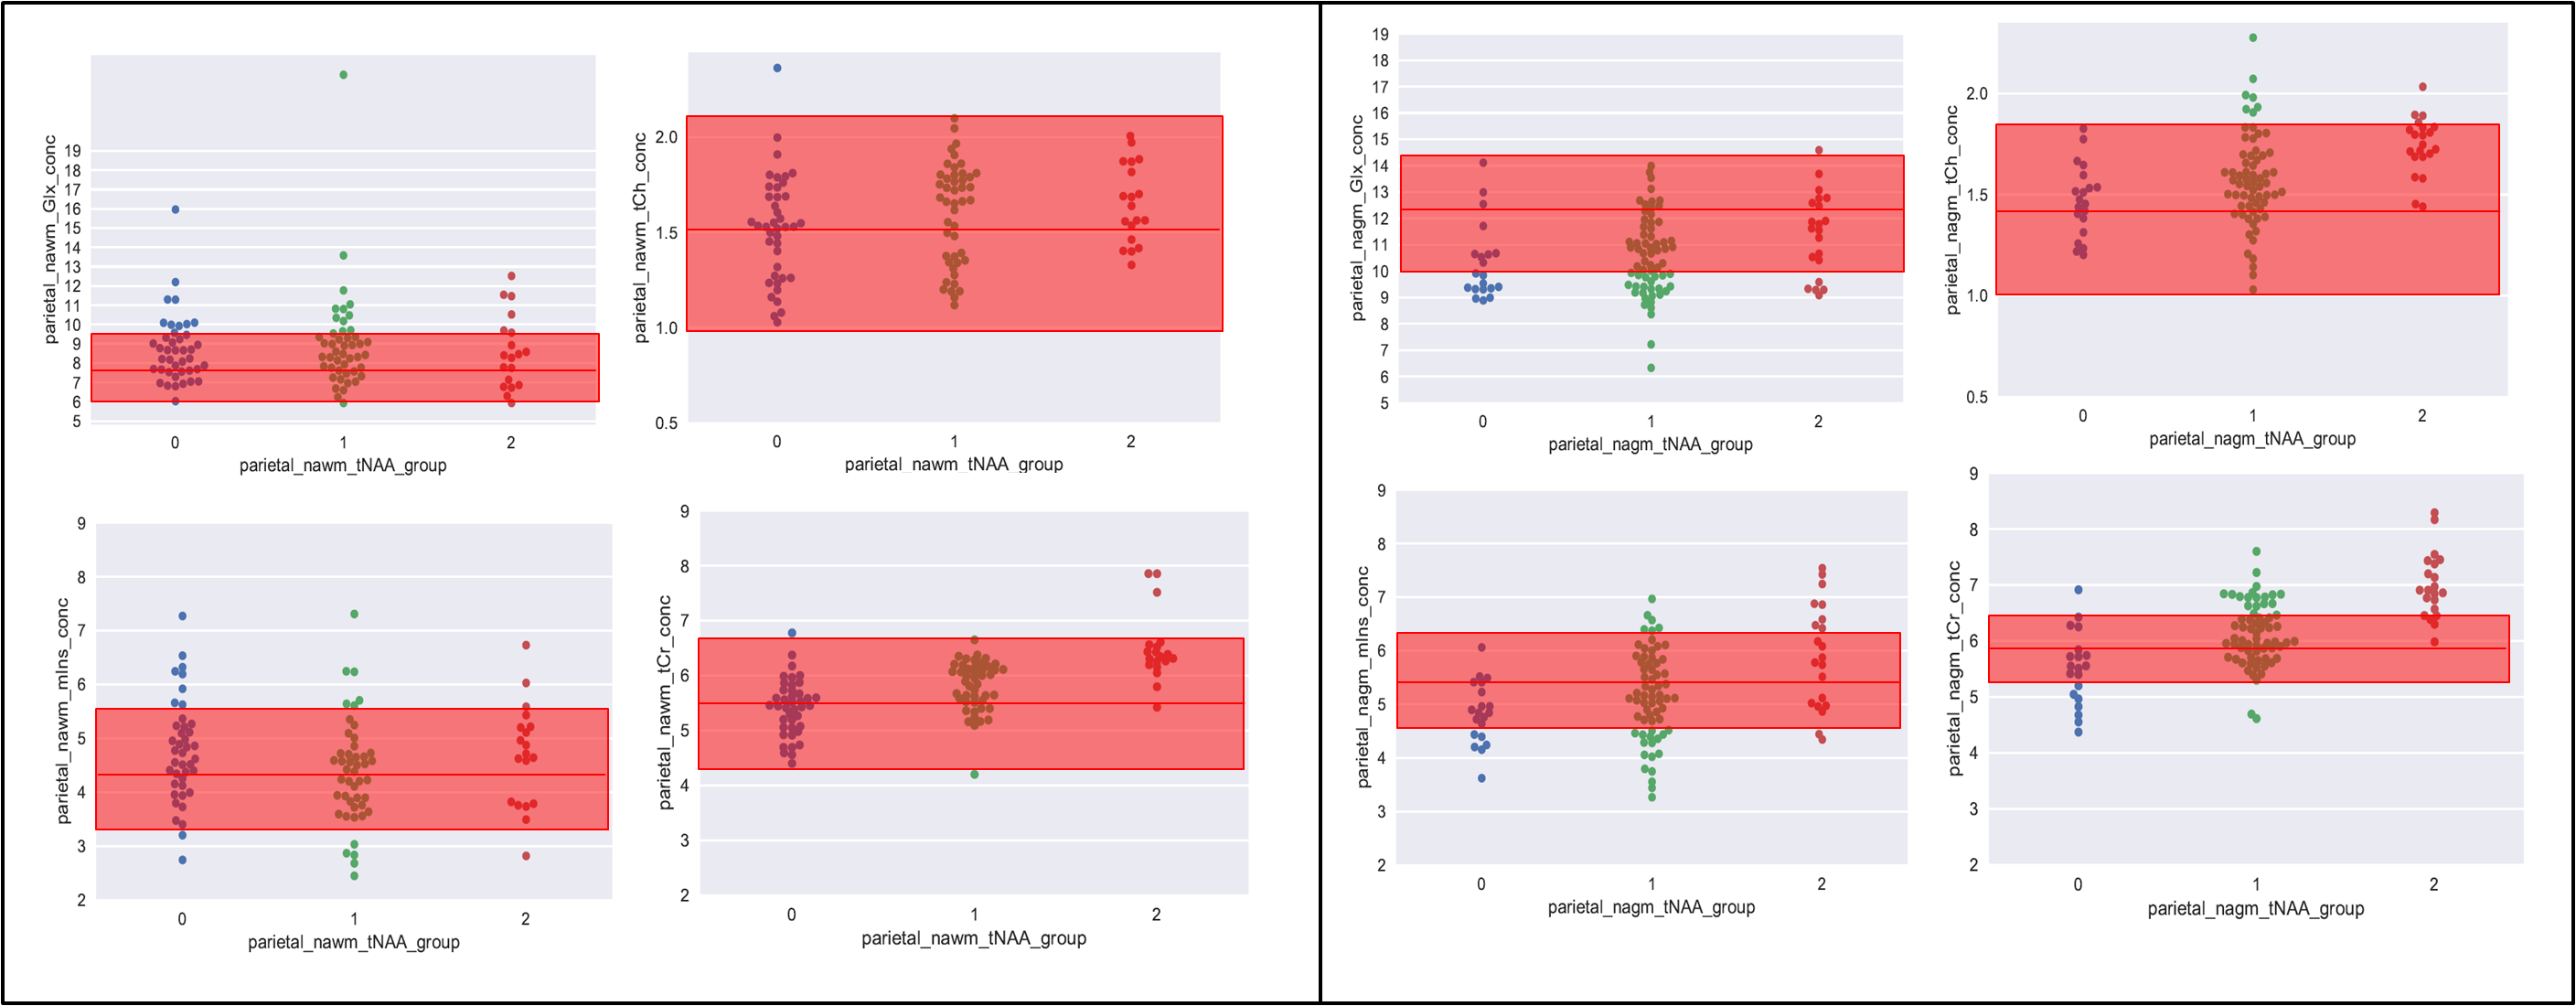
Analysis: The method establishes the metabolic profile of each SPMS patient, by applying an iterative assessment of each metabolite in turn. Firstly, for each patient i, with i=1 to 161, the NAA (SPMSi) concentration was compared to the (mean±2std) of the NAA(HC) distribution (Fig. 2). In-house software allowed us to assign patient i to either of three groups: 0) NAA(SPMSi) < NAA(HC); 1) NAA(SPMSi) = NAA(HC); 2) NAA(SPMSi) > NAA(HC). This process determined three clusters of patients. The second iteration assessed for each i whether the concentration of the other metabolites (Glx, mIns, Cho, Cr) was within, above or below the mean±2std for the corresponding HCs metabolite. (Fig. 3). Alterations were summarised in table 1, highlighting the presence/absence of subject-specific alterations.
Results
The scatterplot in fig.2 shows the distribution of NAA concentration in SPMS subjects compared to HCs. Patients could be divided into different groups, with metabolic concentrations either close to normal or biochemically altered. Fig 3 shows that within each NAA group (represented by a different colour: group 0 in blue, group 1 in green and group 2 in red) there was a distribution of alterations, with several combinations of normal and altered metabolites. Table 1 summarises the findings of alterations at population level, where NAA and Glx are most likely to be altered in NAWM, mIns, Cho and Cr are altered more often in NAGM.Discussion
This study presents a novel way to interrogate the metabolic profile of an SPMS population. Despite standard clinical criteria, the metabolic profiles are broad, presumably indicating different pathological evolutions. This evidence is particularly important because it means that SPMS could potentially present different mechanisms of action in different subjects as each metabolite is known to have a main specific role in MS pathology: increased concentration of Glx suggests Glx-mediated cells toxicity2; the alteration of mIns can be associated both to a glial cells activation and an attempt of neuronal osmoregulation3; NAA is synthesised in neuronal cells and mitochondria and its decrease reflects neuronal loss and energetic dysfunction4; Cho can be connected to an active phase of demyelination5; and finally Cr can relate to energy storage during mitochondrial failure6 and to glial proliferation7. Potentially, this methodology might predict responsiveness to different drug classes in this trial, where the patients are randomised to one of three different drugs or control over a 2 year period. Further analysis will extend this work to the wider CSI matrix, including tissue-type partial volume correction, and the development of an automatic classification software based on machine learning algorithms to attempt to develop patient-specific MRS profiles.Acknowledgements
This independent research is awarded by the Efficacy and Mechanism Evaluation Programme (EME), funded by the Medical Research Council (MRC) and the Multiple Sclerosis Society (MS Society), and managed by the National Institute for Health Research (NIHR) on behalf of the MRC-NIHR partnership. The group also received funding from the MS Society of the UK, and the Department of Health’s NIHR Biomedical Research Centres funding scheme (NIHR BRC UCLH/UCL High Impact Initiative-BW.mn.BRC10269).References
- Provencher SW (1993) Estimation of metabolite concentrations from localized in vivo proton NMR spectra. Magn Reson Med 30; 672-679.
- Miljković, D. & I. Spasojević (2013) Multiple sclerosis: molecular mechanisms and therapeutic opportunities. Antioxid Redox Signal, 19, 2286-334.
- Fisher, S. K., J. E. Novak & B. W. Agranoff (2002) Inositol and higher inositol phosphates in neural tissues: homeostasis, metabolism and functional significance. J Neurochem, 82, 736-54.
- Mostert, J. P., P. E. Sijens, M. Oudkerk & J. De Keyser (2006) Fluoxetine increases cerebral white matter NAA/Cr ratio in patients with multiple sclerosis. Neurosci Lett, 402, 22-4.
- Rudkin, T. M. & D. L. Arnold (1999) Proton magnetic resonance spectroscopy for the diagnosis and management of cerebral disorders. Arch Neurol, 56, 919-26.
- Andres, R. H., A. D. Ducray, U. Schlattner, T. Wallimann & H. R. Widmer (2008) Functions and effects of creatine in the central nervous system. Brain Res Bull, 76, 329-43.
- Tartaglia, M. C., S. Narayanan, N. De Stefano, R. Arnaoutelis, S. B. Antel, S. J. Francis, A. C. Santos, Y. Lapierre & D. L. Arnold (2002) Choline is increased in pre-lesional normal appearing white matter in multiple sclerosis. J Neurol, 249, 1382-90.
Figures