1355
7T Magnetic Resonance Spectroscopy in the Hippocampus of MRI Normal Temporal Lobe Epilepsy Patients1Department of Medical BioPhysics, University of Western Ontario, London, ON, Canada, 2Centre for Functional and Metabolic Mapping, Robarts Research Institute, University of Western Ontario, London, ON, Canada, 3Department of Physics and Astronomy, University of California, Irvine, CA, United States, 4Department of Neurobiology and Behavior, University of California, Irvine, CA, United States, 5Center for the Neurobiology of Learning and Memory, University of California, Irvine, CA, United States, 6Epilepsy Program, London Health Sciences Centre, London, ON, Canada, 7Department of Clinical Neurological Studies, University of Western Ontario, London, ON, Canada
Synopsis
The utility of magnetic resonance spectroscopy for studying temporal lobe epilepsy (TLE) has been limited by magnetic field inhomogeneities. Using a 7T head-only MR system, we have successfully measured a number of metabolites which are challenging to measure in the hippocampus, including glutamate and glutathione, and we have observed a trend suggesting a decrease in creatine between contralateral and ipsilateral hippocampi in patients with unilateral, 1.5T MRI normal TLE.
Introduction
Pre-surgical identification of epileptic regions in patients has been shown to improve post-surgical outcomes for patients who require such procedures to control their seizures. However, many patients who require such surgery have normal appearing clinical MRI brain scans. Magnetic resonance spectroscopy (MRS) has previously been explored as a technique to identify metabolic changes indicative of epileptic tissue in this patient population. However, MRS is difficult to acquire in the hippocampus due to magnetic field inhomogeneities, making it difficult to study the full range of detectible metabolites in one of the most common forms of intractable epilepsy, temporal lobe epilepsy (TLE). Studies examining this region in TLE patients have mostly been limited to measuring N-acetylaspartate, choline, and creatine. These studies have largely shown reduced ratio of N-acetylaspartate/creatine ipsilateral to seizure focus 1-4. The improved signal to noise ratio (SNR), and spectral dispersion that comes with ultra-high field strengths, along with improved shimming hardware on 7T systems, combine to produce high quality spectra in the hippocampus. The purpose of the current study was to examine MRI normal TLE patients on a 7T MRI system to evaluate the utility of 7T MRS in identifying epileptic tissue within the hippocampus.Methods
Eight unilateral focal TLE patients (4 female, 4 male, average age= 36± 13 years) were recruited though the Epilepsy Program at London Health Sciences Centre, London, ON, Canada. Eleven age, sex, and handedness matched healthy participants were recruited to serve as a control group (5 female, 6 male, average age= 29± 8 years). All patients were diagnosed with drug resistant TLE and were deemed to have normal MRI brain scans when imaged on a 1.5T clinical system as part of routine clinical care. Seizure lateralization for each patient was determined using a combination of clinical EEG recordings and seizure semiology.
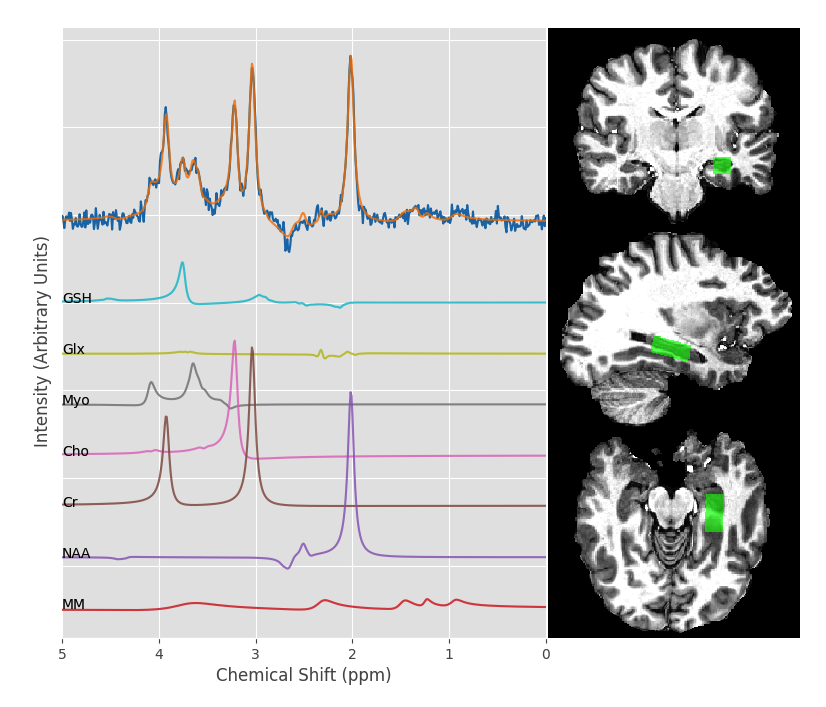
All participants were scanned on a 7T Siemens head-only MR system. T1- weighted full brain images were collected using an MP2RAGE sequence (TE= 2.83 ms, TR= 6 s, slice thickness = 0.75 mm), followed by semi-LASER localized single voxel MRS measurements of each hippocampus (TE= 60 ms, TR= 7.5s, voxel size 2.7x1.7x1.7 cm3) (Figure 1). Both a water suppressed metabolite spectrum (64 averages) and a water unsuppressed spectrum (4 averages) were acquired.
QUECC lineshape corrections were applied to all spectra 5; each spectrum was then fit in the time domain using a prior knowledge template derived from simulated spectra. Fitting was performed using the analysis software fitMAN 6, which was created by our lab in IDL (version 5.4 Research Systems Inc., Boulder, CO, USA). Peak areas from the fitted spectra were used to calculate metabolite concentrations presented as both as ratios to creatine (X/Cre) and as absolute concentrations (mM) 7. A one-way ANOVA analysis was used to compare metabolite levels from hippocampi ipsilateral to seizure focus, contralateral to seizure focus, and from healthy controls.
Results
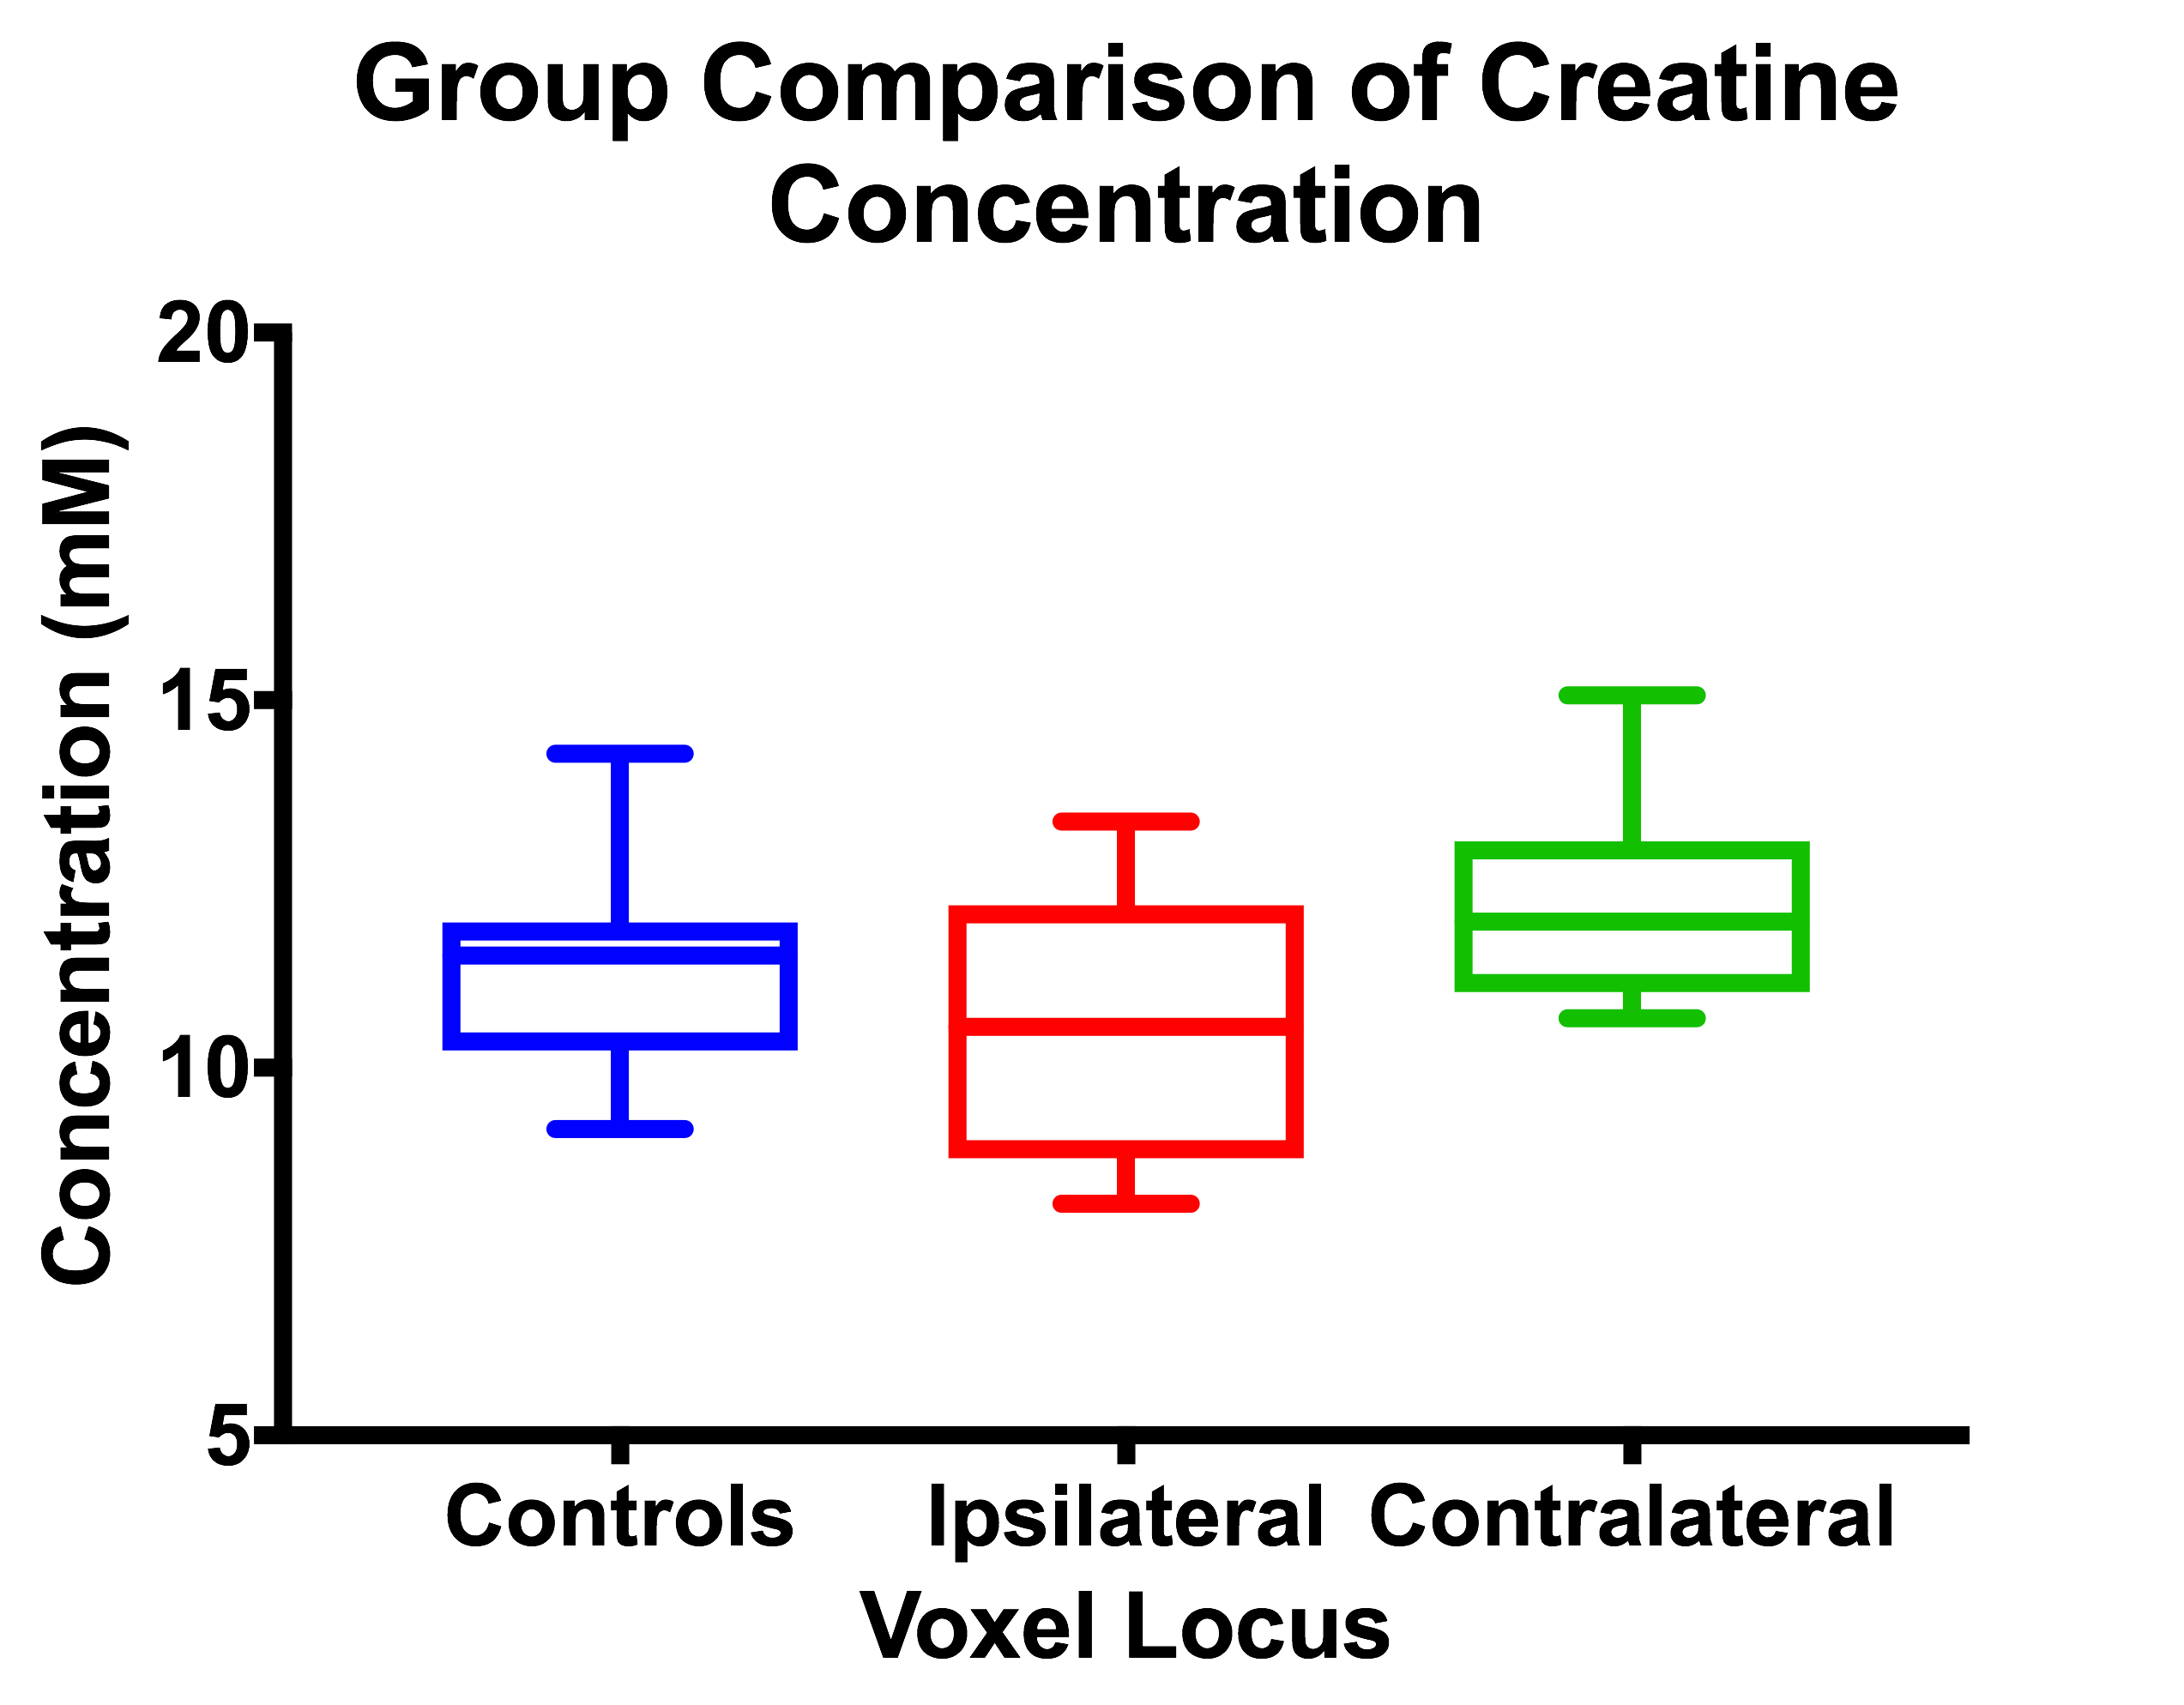
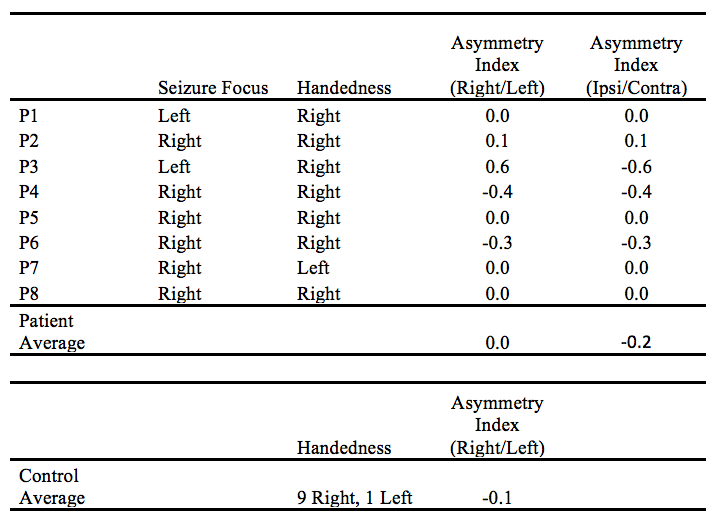
Metabolites with a coefficient of variation of less than 35% in our control group were included in our statistical analysis; the metabolites which met this criterion were N-acetylaspartate, total creatine, total choline, myoinostol, glutathione, and combined glutamate/glutamine. In our ANOVA analysis, we saw a trend in the absolute concentration of creatine, which trended lower in hippocampi ipsilateral to seizure focus compared to the contralateral side (p = 0.067)(Figure 2). No other noteworthy metabolite changes were found, either between ipsilateral and contralateral hippocampi or either patient group and healthy controls. Using an asymmetry index, we compared the asymmetry of creatine levels within our patients and healthy controls (Figure 3).Discussion and Conclusion
While disruption of energy metabolism in TLE is commonly observed in FDG-PET images8, and a reduction of phosphocreatine/ATP has been reported in epilepsy by 31P-MRS9, an absolute reduction in the concentration of total creatine has not been reported using 1H-MRS. This is in part due to the common use of creatine as a reference signal for measuring the concentration of other metabolites. This result is at odds with prior 1H-MRS studies of TLE, where the observed decreased N-acetylaspartate/ creatine ratio implies creatine is increasing ipsilaterally to seizure focus.Acknowledgements
This research was made possible by funding from the Ontario Brain Institute and the Brain Canada Foundation.References
1. Pan J, et al. 7T MR Spectroscopic Imaging in the Localization of Surgical Epilepsy. Epilepsia. 2013;54(9): 1668-1678.
2. Wellard M et al. Myoinositol Abnormalities in Temporal Lobe Epilepsy. Epilepsia. 2003;44(6): 815-821.
3. Xu M, et al. Proton MR Spectroscopy in patients with Structural MRI-Negative Temporal Lobe Epilepsy. J Neuroimaging. 2015;25: 1030-1037.
4. Chernov M, et al. Role of Proton Magnetic Resonance Spectroscopy in Preoperative Evaluation of Patients with Mesial Temporal Lobe Epilepsy. Journal of the Neurological Sciences. 2009;285: 212-219.
5. Bartha R, Drost DJ, Menon RS, Williamson PC. Spectroscopic lineshape correction by QUECC: combined QUALITY deconvolution and eddy current correction. Magn Reson Med. 2000;44: 641-645.
6. Bartha R, Drost DJ, Williamson PC. Factors affecting the quantification of short echo in-vivo 1H MR spectra: prior knowledge, peak elimination, and filtering. NMR Biomed. 1999;12: 205-216.
7. Rupsingh R et al. Reduced hippcampal Glutamate in Altzheimer Disease. Neurobiology of Aging. 2011;32: 802-810
8. Cendes, Fernando. Neuroimaging in Investigation of Patients With Epilepsy. Continuum. 2013;19(3): 623-642.
9. Park EJ, et al. Extratemporal Abnormalities in Phosphorus Magnetic Resonance Spectroscopy of Patients with Mesial Temporal Sclerosis. Arq Neurosiquiatr. 2016;74(2): 93-98.
Figures