1352
Characterizing altered glucose and glutamine metabolism in castration-resistant prostate cancer using high-resolution NMR1UC Berkeley – UCSF Graduate Program in Bioengineering, University of California, San Francisco, San Francisco, CA, United States, 2Department of Radiology and Biomedical Imaging, University of California, San Fracisco, San Francisco, CA, United States
Synopsis
This study demonstrates significant increases in flux through aerobic glycolysis, oxidative phosphorylation, and glutaminolysis with development of therapeutic resistance to androgen deprivation therapy using patient-derived cell lines and a transgenic murine model. Based on these metabolic differences between androgen-sensitive and insensitive prostate cancer, a combination of hyperpolarized [1-13C]pyruvate, [2-13C]pyruvate and [5-13C]glutamine can be used to noninvasively predict therapeutic resistance in future patient studies using HP 13C MRI.
Introduction
Mainstay treatment for patients with metastatic prostate cancer is androgen deprivation therapy (ADT). However, almost all patients eventually develop androgen-insensitive prostate cancer, or castration-resistant prostate cancer (CRPC). Currently there is no reliable clinical method to predict response to ADT, which is critical in guiding treatment decisions. While previous hyperpolarized 13C MR studies have shown that pyruvate-to-lactate ratio and the kinetic rate of conversion of 13C pyruvate to 13C lactate increases as prostate tumors become more aggressive,1,2 the precise metabolic profile of CRPC remains unknown. The goal of this research was to identify changes in metabolism associated with the development of resistance to ADT using high resolution NMR metabolomics techniques in order to determine the best combination of hyperpolarized 13C MRI probes that can predict resistance to treatment in future patient studies. The experimental approach was to characterize fluxes through aerobic glycolysis, amino acid synthesis, oxidative phosphorylation, and glutaminolysis, initially using patient derived cell lines that are androgen-sensitive (LnCaP) and insensitive (PC3), and then using a transgenic adenocarcinoma of the mouse prostate (TRAMP) model that is known to mimic the development of therapeutic resistance in patients.3Methods
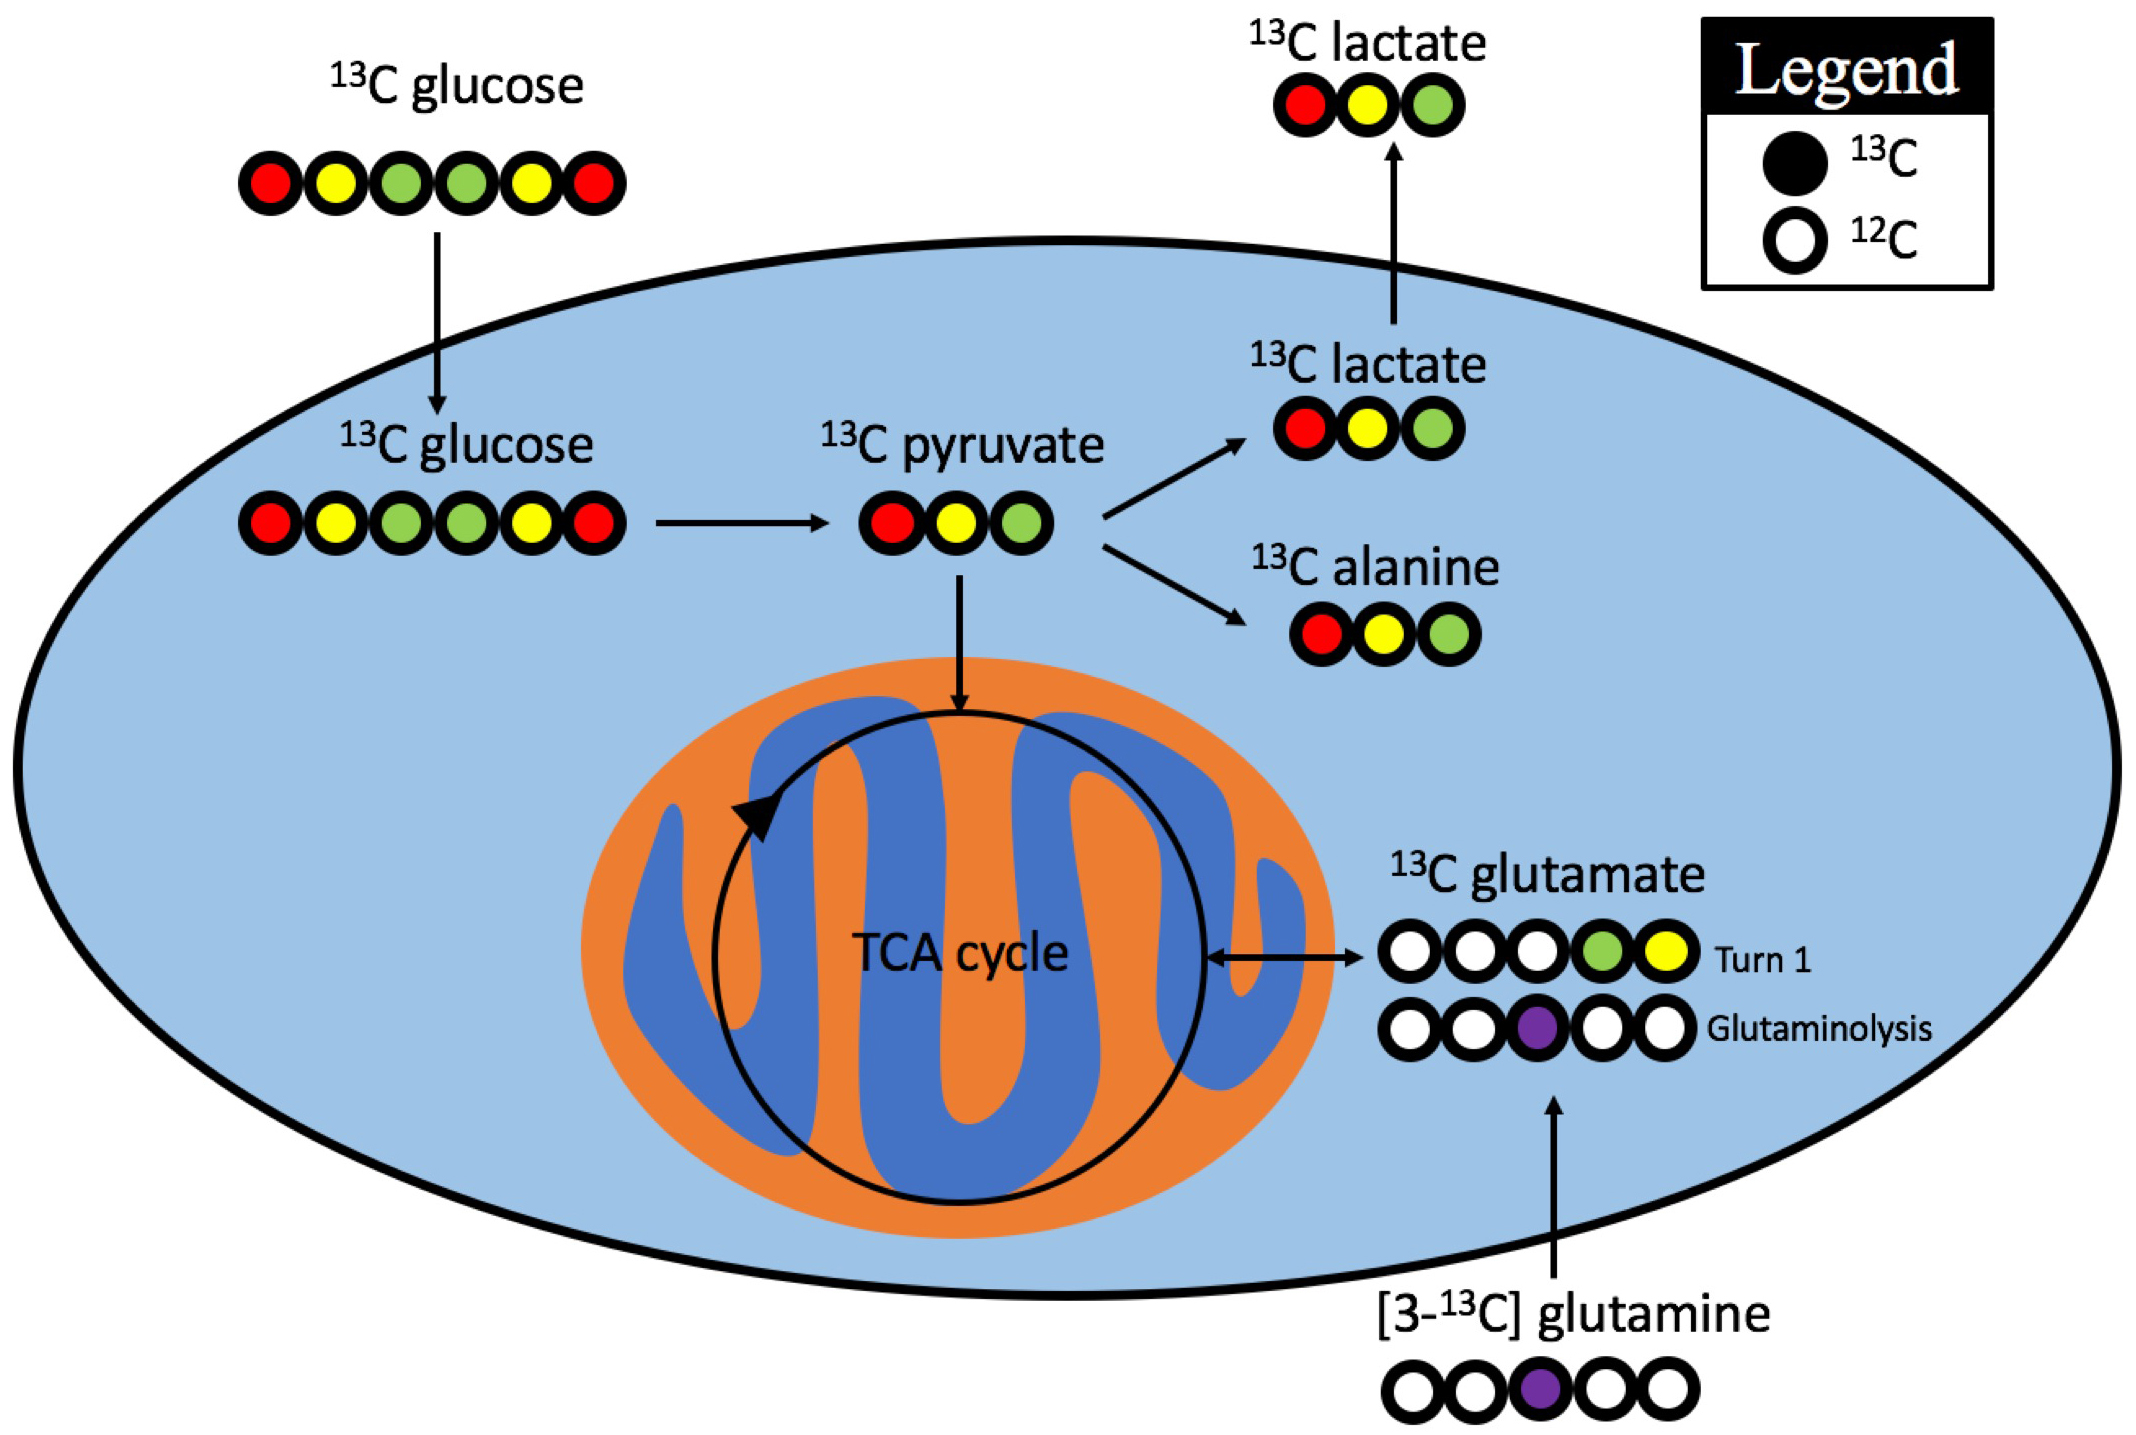
Cell labeling: LnCaP (n=4) and PC3 (n=3) cells were incubated in RPMI containing either 25 mM [1,6-13C2]glucose or 10 mM [3-13C]glutamine for 24 hours (Figure 1). Steady-state metabolism was achieved by 6hrs (not shown). NMR analysis was performed on 8-15 million cells.
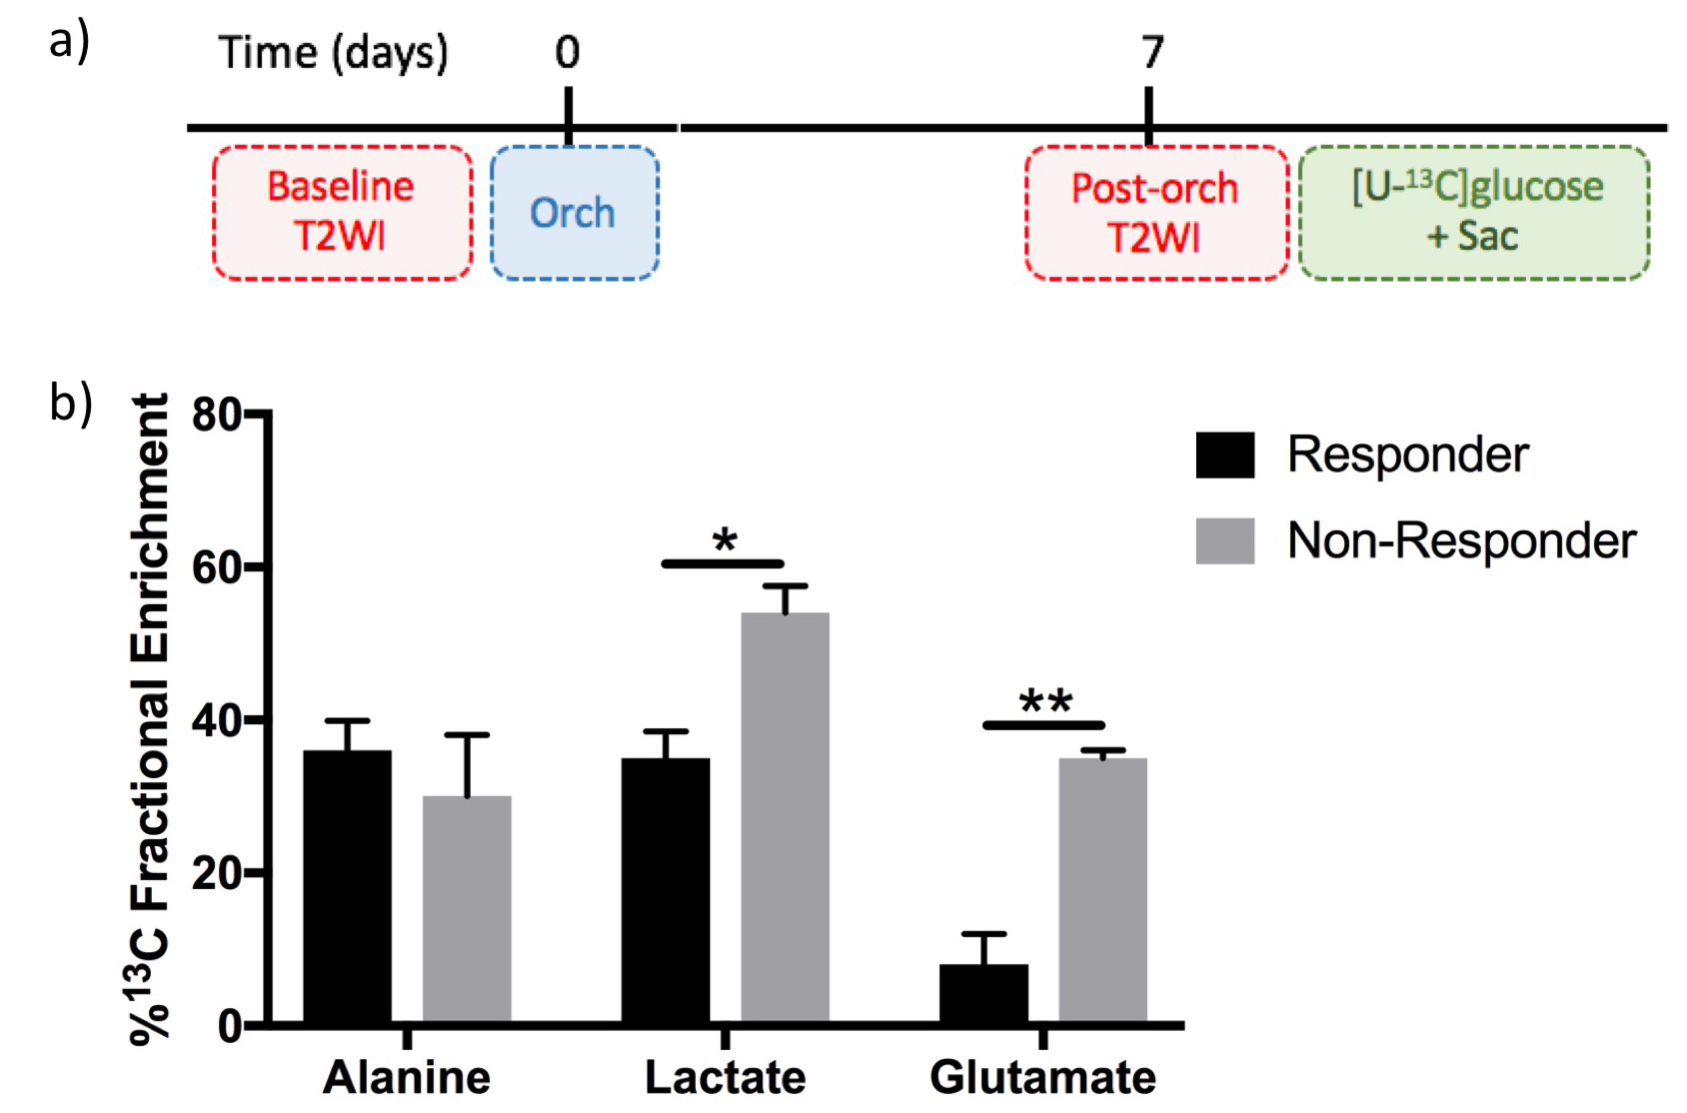
TRAMP treatment and labeling: Adult male transgenic adenocarcinoma of the mouse prostate (TRAMP) with a solid tumor mass between 0.1 – 2 cc underwent orchiectomy (equivalent to chemically induced ADT in patients) (Figure 3a). Mice with <25% increase in tumor volume one week post-orchiectomy were defined as responders (n=3) ,and mice with ≥25% increase in tumor volume were defined as non-responders (n=3). Tumor volume was monitored using T2-weighted spin echo MRI prior to orchiectomy and one week post-treatment. 25%wt [U-13C]glucose was injected in the tail vein at 15 minute intervals 3 times as previously described.4 Tissue collected immediately upon sacrifice was flash-frozen in LN2 for NMR analysis. NMR analysis was typically performed on 30 mg of tissue.
Metabolite extraction: Metabolites were extracted from the aqueous layer of a cold methanol:water:chloroform protocol,5 then lyophilized and resuspended in D2O for NMR analysis.
NMR: 1D direct-detect 1H with and without 13C-decoupling and 2D 1H-1H total correlation spectroscopy (TOCSY) were acquired on a Bruker 800 MHz AvanceI spectrometer equipped with a multichannel cryo-probe in order to quantify fractional enrichment (FE). FE was calculated as (13C-labeled metabolite concentration)/(total metabolite concentration)
Results and Discussion
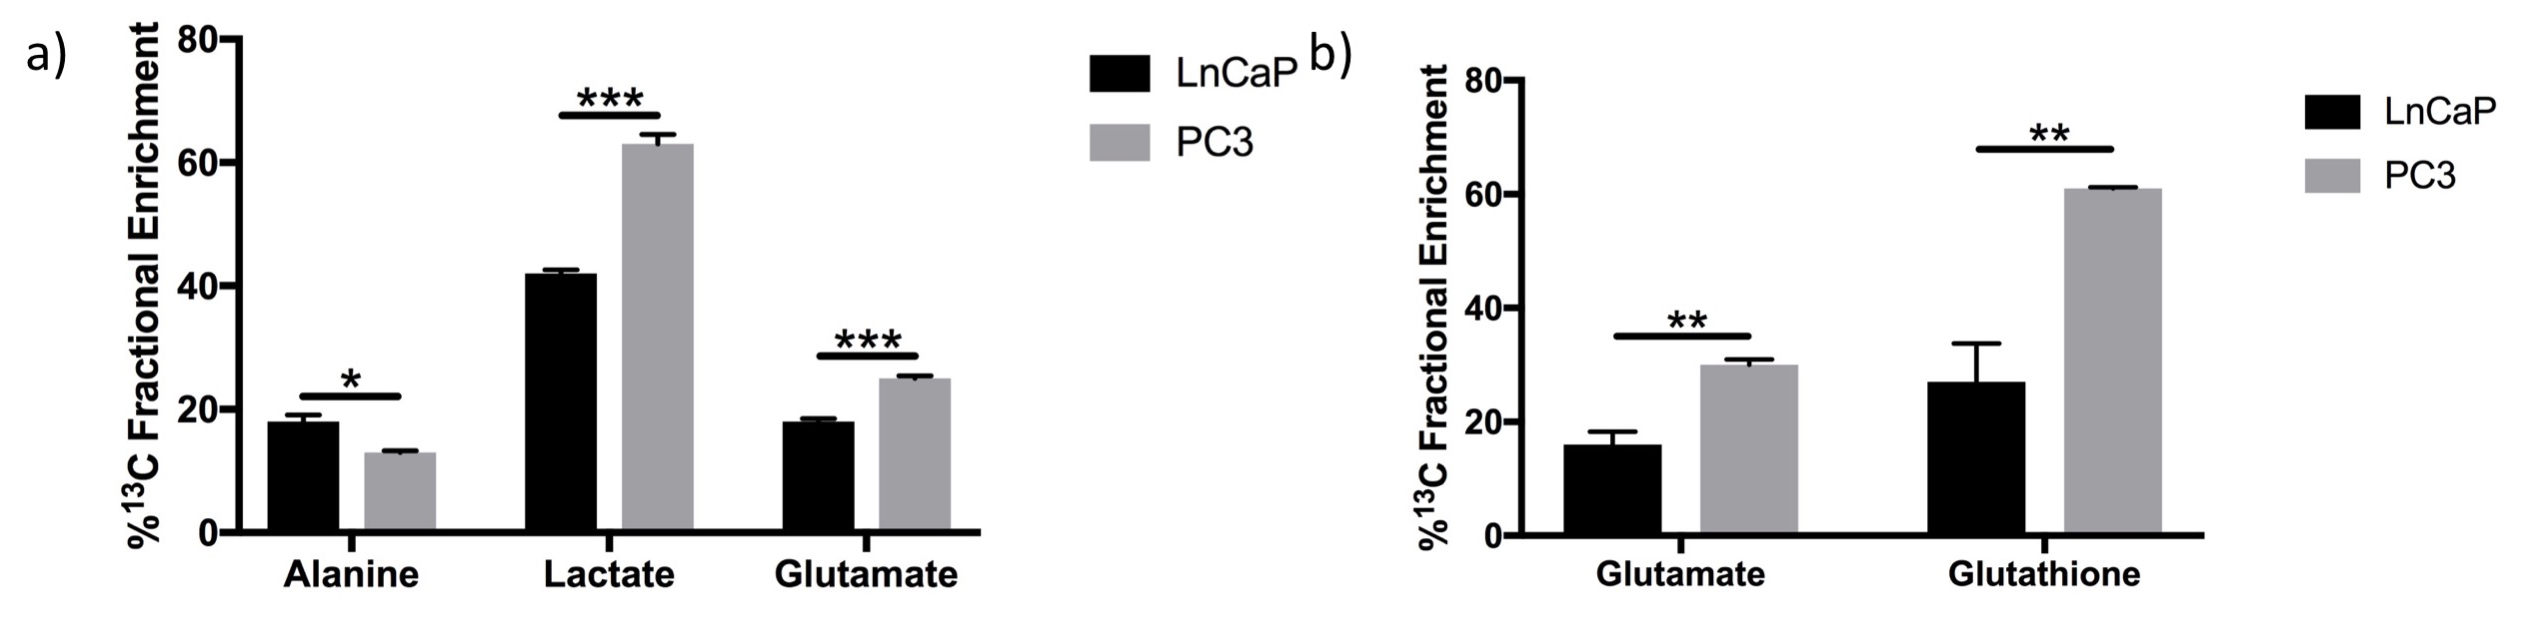
After labeling with [1,6-13C2]glucose, PC3 cells had a significant decrease in alanine FE (13±0.33% vs 18±1.09%, p<0.05), increase in lactate FE (63±1.55% vs 43±0.82%, p<0.001) and increase in glutamate FE (25±0.41% vs 18±0.1.09%, p<0.001) compared to LnCaP cells (Figure 2a). Furthermore in [3-13C]glutamine labeling studies, elevated glutamate FE (30±0.97% vs 16±2.33%, p<0.01) and glutathione FE (61±0.23% vs 27±6.79%, p<0.01) were observed in PC3 cells compared to LnCaP cells (Figure 2b). Together these results indicate that the androgen-insensitive cells exhibit increased 13C-glucose flux through aerobic glycolysis and oxidative phosphorylation, decreased 13C-glucose flux through amino acid synthesis, and increased 13C-glutamine flux through glutaminolysis. In the TRAMP mice, following orchiectomy (Figure 3a), non-responders had elevated lactate FE (54±3.5% vs 35±3.5%, p<0.05) and glutamate FE (35±1% vs 8±4%, p<0.01) compared to responders (Figure 3b), but no difference in the alanine FE. These results support our findings in the cell model that glucose metabolism is diverted towards aerobic glycolysis and oxidative phosphorylation in androgen-insensitive prostate tumors.Conclusion
This study demonstrated similar alterations in glucose and glutamine metabolism between androgen-sensitive and insensitive prostate cancer using human prostate cancer cell lines and a transgenic murine model. Flux through aerobic glycolysis, oxidative phosphorylation, and glutaminolysis were significantly higher in the androgen-insensitive PC3 cells compared to androgen-sensitive LnCaP cells. We also observed an increase in glucose flux through aerobic glycolysis and oxidative phosphorylation in ADT resistant TRAMP tumors. Ongoing studies are investigating glutaminolysis using [U-13C]glutamine labeling in the TRAMP model. Based on these metabolic differences between androgen-sensitive and insensitive prostate cancer, a combination of hyperpolarized [1-13C]pyruvate, [2-13C]pyruvate and [5-13C]glutamine can be used to noninvasively predict therapeutic resistance in future patient studies using HP 13C MRI.Acknowledgements
This work has been supported by NIH Grants R01CA166655, NIH R01CA215694, NIH P41EB013598, and W81XWH-17-1-0471.
References
1. Albers MJ, Bok R, Chen AP, et al. Hyperpolarized 13C Lactate, Pyruvate, and Alanine: Noninvasive Biomarkers for Prostate Cancer Detection and Grading. Cancer Research. 2008;68(20):8607-8615.
2. Chen HY, Larson PEZ, Bok RA, et al. Assessing Prostate Cancer Aggressiveness with Hyperpolarized Dual-Agent 3D Dynamic Imaging of Metabolism and Perfusion. Cancer Research. 2017;77(12):3207-3216.
3. Gingrich JR, Barrios RJ, Kattan MW, Nahm HS, Finegold MJ, Greenberg NM. Androgen-independent Prostate Cancer Progression in the TRAMP Model. Cancer Research. 1997;57(21):4687-4691.
4. Lane AN, Yan J, Fan TWM. 13C Tracer Studies of Metabolism in Mouse Tumor Xenografts. Bio-protocol. 2015;5(22).
5. Prasad Maharjan R, Ferenci T. Global metabolite analysis: the influence of extraction methodology on metabolome profiles of Escherichia coli. Analytical Biochemistry. 2003;313(1):145-154.
Figures