1349
Magnetization transfer among non-aqueous species and between them and water in spinal cord1School of Chemistry, Tel Aviv University, Tel Aviv, Israel, 2SQITS/NICHD, NIH, Bethesda, MD, United States
Synopsis
Previous publications demonstrated that the intensity of white matter (WM) images of spinal cord stem from aqueous and non-aqueous protons (having a peak at 3.5ppm). The peak of the non-aqueous protons was analyzed to be a superimposition of signals with a distribution of T2* (10-1000μs). Questions unanswered by these studies are whether the peaks with short and long T2* exchange magnetization among themselves, and whether they transfer magnetization (MT) to water. In the present publication these questions are addressed by combining double quantum filtering with magnetization transfer. The results demonstrate exchange between non-aqueous species and between them and water.
Introduction: In previous publications it was demonstrated that white matter (WM) intensity in spinal cord’s images stem from aqueous and non-aqueous protons having a peak at 3.5ppm1,2. This latter peak was analyzed to be a superimposition of signals with a distribution of T2* (10-1000μs). The questions left unanswered by these studies are whether the peaks with short and long T2* exchange magnetization among themselves, and whether they transfer magnetization (MT) to water. Such exchange affects our understanding of these systems and the models of the non-aqueous protons one uses to describe them.
Materials and Methods: The above questions were studied by a double quantum filter combined with magnetization transfer (DQF-MT, DQ double quantum coherence). In this pulse sequence: 90°-τ/2-180°-τ/2-90°-tDQ-90°-τ/2-180°-τ/2-90°-tLM-90°-acq, (90° pulse was 19 μs) τ, tDQ and tLM are the double quantum coherence creation, evolution and longitudinal magnetization evolution times, respectively. This approach enables one to select the protons to be excited on the basis of the strength of their dipolar interactions, ωD, and thus is more sensitive to the properties of the non-aqueous species, enabling one to resolve spectra that are observed to overlap in spectra acquired following a single pulse. Spectra were obtained using a 14T Bruker BioSpin μMRI system with an Avance III console. Porcine spinal cords were obtained from freshly sacrificed animals and soaked in saline.
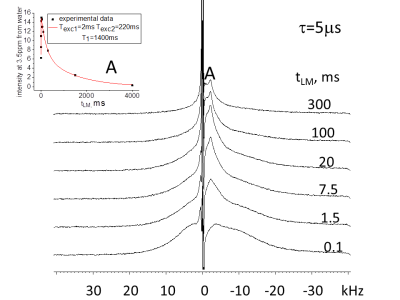
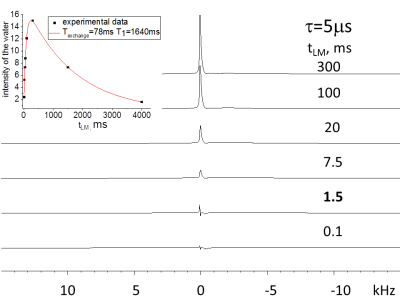
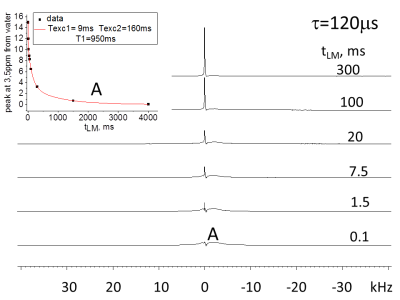
Results: In Figs. 1-3 we show spectra acquired as a function of the MT time interval, tLM, for two creation times, t, values (tDQ =2.5μs ). In spectra acquired with short τ (5 μs, Figs. 1 and 2) three types of spectra are observed: (1) a broad component of ~20kHz linewidth (2) a spectrum with linewidth of ~4kHz with peak position at 3.5ppm from the water, and (3) a narrow peak (~30 Hz linewidth) at the water resonance. Component (1) can be observed at very short tLM time interval (as short as 0.1 ms) and decays for longer times (Fig. 1). Component (2) is noticeable for tLM≥1.5ms as it starts to build up and gets its maximum intensity for tLM=20ms. Component (3) buildup time is significantly longer and achieves a maximum intensity at tLM=300ms (Fig. 2). The integral over the entire spectrum for tLM period ≤300ms has changed by less than 13% although the intensities of components (1)-(3) has changed by a much larger percentage (Figs. 1 and 2), showing that the dominant process is MT. For τ = 120 μs only components (2) and (3) are observed with MT between them. For τ>500 μs no signal could be observed.
Discussion: The dependence of the magnetization of the non-aqueous species on τ (see DQF-MT above) is determined by dipolar interactions (ωD~1/τ, tLM <0.1 ms) among their protons. Thus, for τ=5 μs only species with ωD larger than 10 kHz were observed while for τ = 120 μs ωD of ~2kHz were measured (see Fig.3 tLM=0.1 ms). The selection of the DQ coherence is achieved by phase-cycling of the r.f. pulses proceeding the tLM period. As a result, the observed signal stems from magnetizations present in the system at tLM <0.01ms and those that are obtained from them by MT. For τ=5 μs the peaks of the water and the one at 3.5ppm are formed by MT (Figs. 1 and 2) from species having the spectrum with linewidth of ~20 kHz. Measurements with τ = 120μs and tLM≤0.1ms show only component (2) and monitoring its peak intensity dependence on tLM indicates it decays by MT to the water and the peak of the ~20 kHz width. Wilhelm et al.1 using ultra-short time to echo (UTE) method to image spinal cord, isolated the peak at 3.5ppm from the water and demonstrated that the majority of its magnetization stems from the WM. On the basis of their study1 and the present study we conclude that the spectrum with 20 kHz linewidth and the water signal obtained from it by MT are present in the WM. In previous studies of MTC only one type of non-aqueous species was considered to exchange magnetization with water2. The current study results suggest that it is important to check the effect that more than one type of non-aqueous species exchange magnetization with water and consider the impact their MT processes have on their own and the Z spectra. Similar conclusion was recently reached using a method that combines MTC and selective-saturation of water3.
Conclusion: In spinal cord more than one type of non-aqueous species transfer magnetization to water.
Acknowledgements
Acknowledgement: US-Israel Binational Science Foundation grant number 2013253 and the IRP of the Eunice Kennedy Shriver National Institute of Child Health and Human Development supported this study.References
1. Wilhelm MJ, Ong HH, Wehrli SL, Li C, Tsai PH, Hackney DB, Wehrli FW. Direct magnetic resonance detection of myelin and prospects for quantitative imaging of myelin density. Proc. Natl. Acad. Sci. 2012:109;9605-9610.
2. Stanisz GJ, Recojervic A, Bronskill MJ, Henkelman RM. Characterizing white matter with magnetization transfer and T2. Magn. Reson. Med. 1999;42:1128-1136.
3. Eliav U, Navon G. The role of magnetization transfer in the observed contrast in T1 weighted imaging under clinical setups. NMR Biomed. DOI: 10:1002/nbm.3792
Figures


