1347
Hippocampal metabolite changes in response to chronic corticosterone exposure: in vivo magnetic resonance spectroscopy at 9.4T1The Catholic University of Korea College of Medicine, Seoul, Republic of Korea, 2Asan Institute for Life Sciences, Asan Medical Center, Seoul, Republic of Korea, 3Lee Gil Ya Cancer & Diabetes Institute, Gachon University School of Medicine, Incheon, Republic of Korea
Synopsis
The purpose of the study is to investigate neurochemical changes in a mouse model using proton magnetic resonance spectroscopy. Animals received 1% of ethanol drinking water solution or 100μg/mL of corticosterone dissolved in 1% of ethanol drinking water for 4 weeks. MRS spectra were acquired at the end of the experiment. Mice that ingested corticosterone show elevated glutamate, glycerophosphocholine and taurine levels in the hippocampus compared with those shown by the control group. Increased corticosterone levels are considered a sign of stress or metabolic disturbance. Therefore we suggest that chronic corticosterone exposure can affect the hypothalamic-pituitary-adrenal dysregulation and neurochemical alteration.
Purpose
Chronic glucocorticoid exposure has been shown to exert adverse effects on numerous regions of the brain. The sustained high level of corticosterone in rodents is associated with the regression of synapses and a decrease in dendritic spines in hippocampal and prefrontal neurons [1]. Elevated corticosterone levels were observed during the sequence of changes in response to exposure to stress. In addition, evidence emerged that the disruption of the adrenal hormone, corticosterone, can also result in numerous metabolic changes. In this study, we have investigated the alterations of hippocampal metabolites in an oral administration of corticosterone mouse model.Materials and Methods
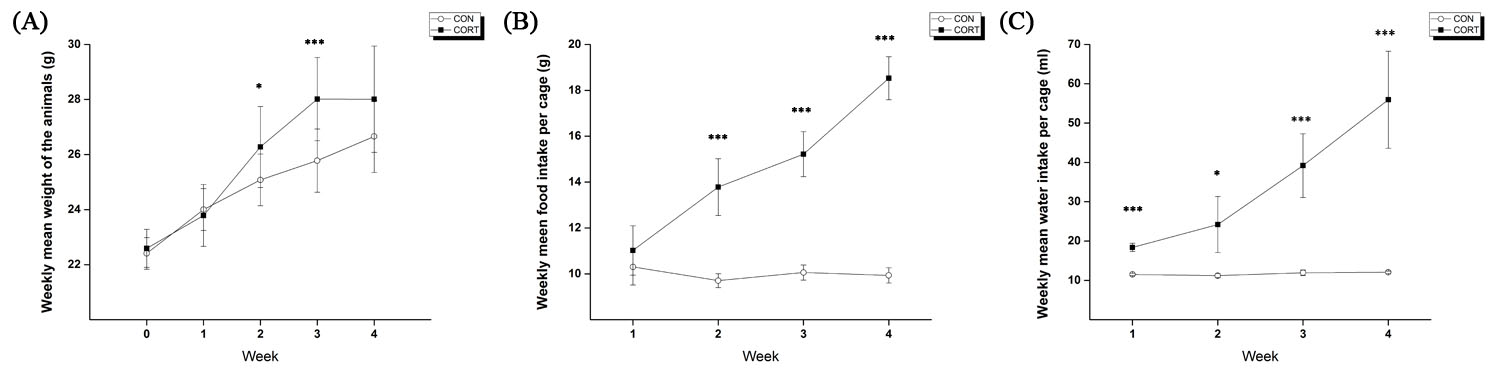
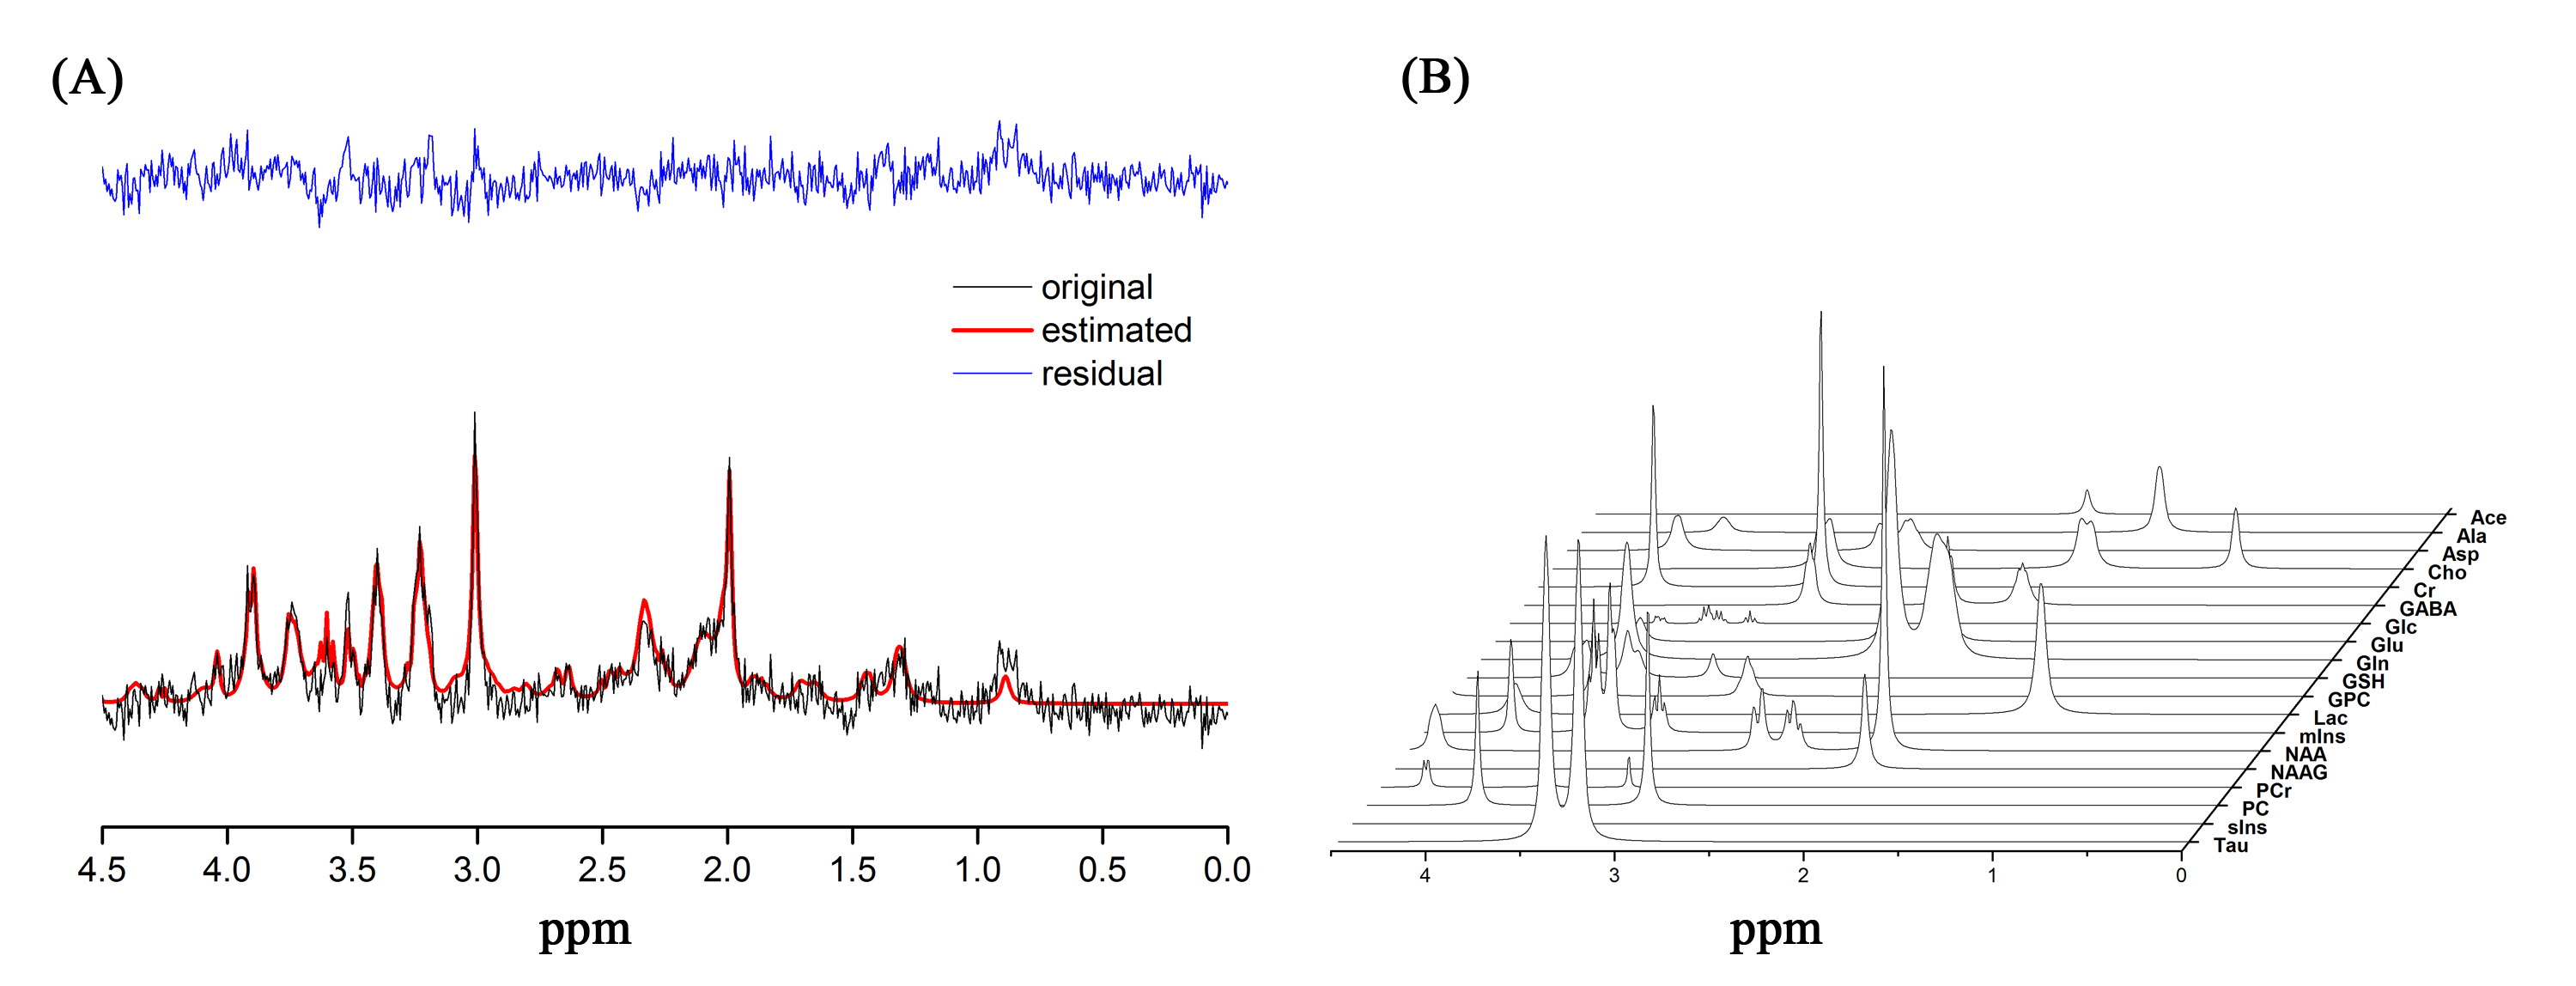
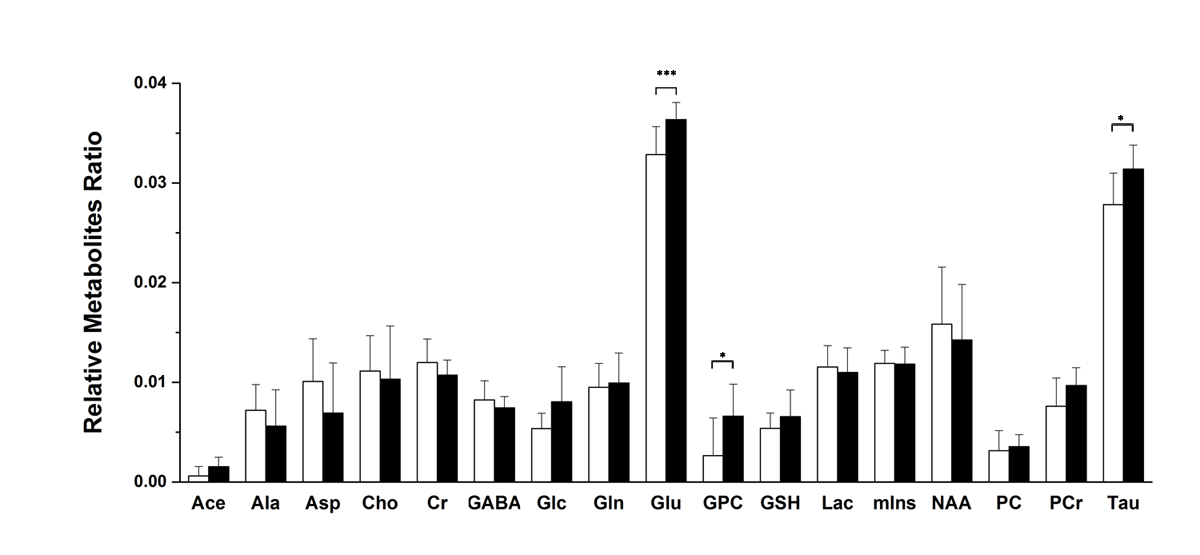
C57BL/6 mice were randomly assigned into two groups: control (CON; n = 8), corticosterone (CORT; n =8). After a 1-week of assimilation period, animals in the CON group were provided with 200mL water supplemented with 1% (v/v) ethanol, whereas, the animals in the CORT group were provided with 200mL water supplemented with 100μg/mL of corticosterone diluted in 1% (v/v) of ethanol for 4 weeks [2]. The water bottles were replaced every 3-4 days, and water intake was recorded at the same time. Food intake and body weight were measured once each week during the experiment. Proton magnetic resonance imaging and spectroscopy (1H MRI/S) acquisitions were performed using a 9.4T/20 MRI scanner (Bruker, Avance 400 MHz). Anatomical MR images were acquired with T2-weighted RARE (TR/TE=6469/56ms, RARE factor = 8, field of view = 30×30mm2, average = 1, matrix 256×256, number of slices = 16 (axial, sagittal, coronal), slice thickness = 1mm). PRESS sequence (TR/TE = 5000/13ms, spectral width = 5000Hz, average = 256, VOI = 1.8×2.5×1.5mm3, number of data points = 2048) with VAPOR water suppression and outer volume suppression was used. All first and second order shim terms were automatically adjusted using FASTMAP and then MAPSHIM. For B0 homogeneity in the voxel, the line width of the unsuppressed water peak was adjusted within the range of 10–13 Hz. The spectra were analyzed by jMRUI software package version 5.2 with simulated basis set using VeSPA (http:// scion.duhs.duke.edu/vespa/). The following 19 metabolites were included in the basis set: Acetate (Ace), alanine (Ala), aspartate (Asp), creatine (Cr), γ-aminobutyric acid (GABA), glucose (Glc), glutamate (Glu), glutamine (Gln), glutathione (GSH), glycerophosphorylcholine (GPC) phosphorylcholine (PCh), myo-inositol (mIns), lactate (Lac), N-acetylaspartate (NAA), N-acetylaspartylglutamate (NAAG), phosphoryl-choline (PC), phosphocreatine (PCr), scyllo-inositol (sIns), and taurine (Tau). Spectral apodization was performed at 2 Hz before fitting. Preprocessing was performed using the hankel-lanczos singular value decomposition (HLSVDS) filter for subtracting water signal (4.7ppm) and automatic frequency-shifting. The quantification method used for jMRUI was the time-domain semi-parametric algorithm QUEST. The software package SPSS 21 was used for statistical analysis. The data for each metabolite were tested using an independent t-test, and the significance level was set at p < 0.05.Results
The weekly mean for body weight, and food, and water intake of both groups are illustrated in Figure 1. Figure 2 shows the (a) axial and (b) coronal T2-weighted images of the animal with voxel plans in magenta. Figure 3 shows representative (a) spectrum with residue and fitted line, and (B) individual metabolite spectra. The total metabolite levels, with statistical significance indicated by the stars, are shown in Figure 4. In week 4, Glu, GPC, and Tau levels in the CORT group were significantly higher than those of CON group (p values of 0.009, 0.040 and 0.024, respectively.Discussions and Conclusion
In this in vivo experiment, it was clear that the exogenous administration of glucocorticoid for several days, in the absence of concurrent stress, inhibited the basal activity in the hypothalamic-pituitary-adrenal axis [3]. Glucocorticoids act on tissue throughout the body and cross the blood-brain barrier to act on multiple regions of the brain via both membrane and intracellular neuronal receptors. In this study, animals in the CORT group showed hyper-glutamatergic activity and membrane turnover in the hippocampus as a consequence of chronic corticosterone exposure. Therefore, we suggest that these findings can contribute to the investigation of the effect of chronic steroid treatment on the brain and neurometabolism, in addition to the study of stress and depression.Acknowledgements
This study was supported by grants (2012-007883) from the Mid-career Researcher Program though the National Research Foundation (NRF) funded by the Ministry of Science, ICT & Future Planning (MSIP) of Korea.References
[1] N. Processes, I.N. The, E.O.F. Psychosis, Stress and Neurodevelopmental Processes in the, (2014) 172–191. doi:10.1016/j.neuroscience.2012.12.017.STRESS.
[2] J. Yu, B. Yu, J. He, P. Zheng, X. Mao, G. Han, D. Chen, Chronic glucocorticoid exposure-induced epididymal adiposity is associated with mitochondrial dysfunction in white adipose tissue of male C57BL/6J mice, PLoS One. 9 (2014) 1–8. doi:10.1371/journal.pone.0112628.
[3] B.H. Levy, J.G. Tasker, Synaptic regulation of the hypothalamic–pituitary–adrenal axis and its modulation by glucocorticoids and stress, Front. Cell. Neurosci. 6 (2012) 1–13. doi:10.3389/fncel.2012.00024.
Figures