1344
On spectrally selective measurements of irreversible and reversible transverse relaxation rates from single voxel, single echo time PRESS acquisitions1Radiology, Children's Hospital, Boston, Boston, MA, United States
Synopsis
We developed a methodology to measure
the reversible and irreversible transverse relaxation rates R2' and R2,
respectively, of multiple spectral peaks from spectroscopic sampling of both sides of a single spin echo. The methodology was applied to resonances in muscle and brain and the irreversible relaxation rates R2 were compared with conventional measurements made from right side only spectra acquired at multiple PRESS echo times.
Introduction
We had previously shown that for Lorentzian frequency distributions governing reversible relaxation, separate Fourier Transformations (FT) of the left and right sides of a spectroscopically sampled spin echo yield absorption-mode spectra whose left over right peak height ratio α, and whose right side spectral width πFWHM = R2* = R2 + R2’, may be used to extract the reversible and irreversible relaxation rates R2’ and R2, respectively, for each peak (1). A limitation of this prior work lies in the reduced spectral resolution of the left side data due to truncated readouts. Furthermore, in the limit where R2 ~ R2’, the underlying lineshapes of left side spectra become absorption- and dispersion-mode sinc functions (1). Limited spectral resolution and sinc-like spectra can conspire to make left side peak height measurements problematic. In this work, a major improvement is proposed wherein the ratio β of the peak height of the magnitude of the full asymmetric echo readout and the right side spectral peak height may be combined with the right side R2* measurement to extract spectrally selective R2 and R2’ values. Since the asymmetric echo has the longest readout and so the highest spectral resolution, the left side only spectral resolution problem is eliminated. The method is demonstrated by comparing spectral R2 values measured from single PRESS echoes and those obtained via right side only spectra acquired using multiple PRESS echo times, with the latter referred to as Hahn R2 values.Theory
For the PRESS sequence 90y-τ1-180y-τ2-180y-t phased absorption-mode spectra may be separately generated from the left and right sides of the echo center at t = τ2 - τ1 and can be used in conjunction with the FWHM of the right side absorption spectrum to disentangle the separate contributions of R2 and R2’ to R2* via the following transcendental equation:
α = R2* [1 − exp(−(R2* − 2R2)(τ2-τ1))]/(R2* − 2R2) [1]
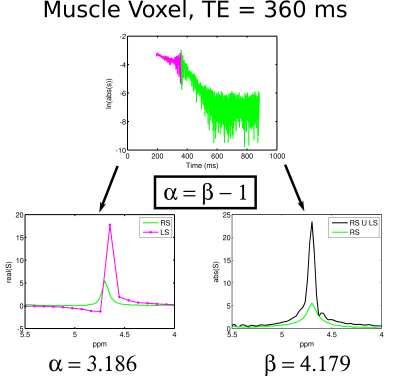
where R2* is measured experimentally as πFWHM and α is the ratio of left over right side peak heights (1). Furthermore, the ratio β obtained from the peak height of the magnitude-mode spectrum from the full asymmetric readout divided by the peak height of the right side only magnitude-mode spectrum obeys the simple relation:
β = 1 + α [2]
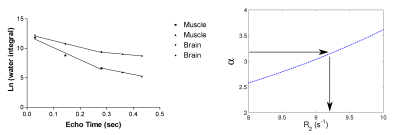
so that a measure of β is equivalent to a measure of α, allowing the use of Eq [1] to graphically extract R2 and hence R2’ = R2* - R2.
Methods
Muscle spectra without water suppression and brain spectra with and without water suppression were collected from two healthy adult males at 1.5T and 3T, respectively, using single voxel (2 cm3) PRESS sequences at echo times of 30, 144, 288, 360 and 432 ms. Left and right time-domain signals on either side of the echo centered at t = τ2-τ1 after the 2nd refocusing pulse were collected and processed separately for estimating α while magnitude-mode full asymmetric vs right side echo were used to estimate β. Subjects provided informed written consent per local IRB requirements.Results
Figure 1 shows time-domain data for muscle water from a TE = 360 ms PRESS sequence and spectral reconstructions of left and right absorption mode vs full echo and right side magnitude mode. The α and β values calculated from the two different reconstructions differed by ~1, as expected from theory. Figure 2a shows the water decays with TE in muscle and brain from the multiple PRESS acquisitions. The decays are clearly biexponential and fits (solid lines) to the muscle and brain fast (first three echoes) and slow (last three echoes) components yielded Hahn R2 values of 20.5 s-1 and 8.9 s-1 (muscle) and 11.2 s-1 and 4.3 s-1 (brain). These values are in good agreement with single echo R2 values measured at TE’s of 144 ms and 360 ms (Figure 2b) which were 17.9 s-1 and 9.2 s-1 (muscle) and 9.1 s-1 and 3.7 s-1 (brain). Hahn brain metabolite R2 values were approximately 4.5 s-1 (Cho), 6.9 s-1 (Cr) and 4.0 s-1 (NAA). The R2 values evaluated from single, later echoes yielded values of 3.1 s-1 (Cho), 5.8 s-1 (Cr) and 3.1 s-1 (NAA), somewhat lower but similar to Hahn R2 values.Discussion
The methodology described allows for spectrally selective R2 and R2’ measurements. It is a generalization to the spectroscopic domain of the gradient echo sampling of spin echo (GESSE) imaging sequence which assumes a single resonance (2). The method offers some intriguing possibilities including serial measurements of the sensitivity of the transverse relaxation properties of major and minor resonances to changes in oxygenation accompanying functional activity or exercise.Acknowledgements
The authors gratefully acknowledge the assistance and friendships of the MR technologists at Boston Children's Hospital throughout the course of this work.References
1) Mulkern RV, Balasubramanian M. Spectroscopic sampling of the left side of long-TE spin echoes: a free lunch? Magn Reson Mater Phy DOI:10.1007/s10334-017-0647-7.
2) Yablonskiy DA, Haacke EM. An MRI method for measuring T2 in the presence of static and RF magnetic field inhomogeneities. Magn Reson Med 1997;872-876.
Figures

