1343
Comparing the Reproducibility of Commonly Used Magnetic Resonance Spectroscopy Techniques to Quantify Cerebral Glutathione at 3 TAndrea Wijtenburg1, Jamie Near2, Stephanie Korenic1, Frank Gaston1, Hongji Chen1, Mark Mikkelsen3,4, Robert McMahon1, Peter Kochunov1, Elliot Hong1, and Laura Rowland1,5
1Psychiatry, University of Maryland School of Medicine, Baltimore, MD, United States, 2Centre d’Imagerie Cérébrale, Douglas Mental Health Institute, Montreal, QC, Canada, 3Russell H. Morgan Department of Radiology and Radiological Science, Johns Hopkins University School of Medicine, Baltimore, MD, United States, 4F. M. Kirby Research Center for Functional Brain Imaging, Kennedy Krieger Institute, Baltimore, MD, United States, 5Russell H. Morgan Department of Radiology and Radiological Sciences, Johns Hopkins University School of Medicine, Baltimore, MD, United States
Synopsis
Cerebral glutathione (GSH), a marker of oxidative stress processes, has been quantified in neurodegenerative diseases and psychiatric disorders using proton magnetic resonance spectroscopy. However, no studies to date have compared the reproducibility of the most commonly used magnetic resonance spectroscopy techniques for GSH quantification. Here, we scanned ten healthy adults twice and acquired spectroscopic data using PRESS, PR-STEAM, SPECIAL, and MEGA-PRESS at 3 Tesla. We assess reproducibility via mean coefficients of variation (CV) and mean absolute difference (AD).
Target Audience
Researchers
interested in studying brain glutathione using MRS.Introduction
Using proton magnetic resonance spectroscopy at 3 Tesla, brain glutathione (GSH), a marker of oxidative stress, has been quantified in a multitude of neurodegenerative diseases and psychiatric disorders. Historically, GSH has been difficult to quantify due to the overlapping resonances of other metabolites within the human brain such as myo-Inositol, creatine, glutamate, glutamine, glucose, and GABA1. However, with the advent of improved hardware, higher field strengths, and newly improved shimming and localization techniques, quantification of cerebral glutathione has been possible. Currently, the most commonly utilized MRS localization techniques to quantify GSH are: PRESS, PR-STEAM, SPECIAL, and MEGA-PRESS; however, there have been no studies conducted to compare reproducibility of these four techniques to quantify glutathione using a within-subject design. Here, we assess reproducibility of the 4 techniques to measure GSH in ten healthy adults, each scanned twice. Phantom work was conducted to determine the validity of the quantification of GSH.Methods
All studies were conducted on a 3T Siemens Magnetom TIM Trio 3T MR system with a 32-channel head coil. The study protocol was approved by the UMB IRB, and all participants provided written informed consent. A 24-cm3 MRS voxel was placed in the medial frontal lobe, which included the anterior cingulate (Figure 1). Each of the 10 participants completed two MRS sessions with a short break between sessions, during which the participant was removed from the scanner. Automatic shimming was performed followed-up by manual adjustments if needed. Each MRS session included a PRESS (TE=30ms, NEX=256, 16-step phase cycle), MEGA-PRESS (TE=120ms, 128 ‘on’ and 128 ‘off’ acquisitions, editing pulse bandwidth=62.7Hz, editing pulse frequency=4.56ppm), PR-STEAM (TM/TE=10/6.5ms, NEX=256, RF phases: φ1=135°, φ2=22.5°, φ13=112.5°, φADC=0°), and SPECIAL (TE=8ms, NEX=256, 16-step phase cycle) localization technique applied in a randomized order. The following parameters were identical for all 4 sequences: TR=2000 ms, spectral width = 2.5kHz, and 2048 complex points. A water reference (NEX=16) was acquired with each of the 4 sequences for phase and eddy current correction as well as quantification. PRESS, SPECIAL, and PR-STEAM data were fit using LCModel2, and GSH levels with Cramer Rao Lower Bounds (CRLB) cutoff of less than or equal to 20% were included in statistical analyses. For MEGA-PRESS, data were analyzed using Gannet 3.03, and only GSH/Water ratios with fit errors below 15%, similar to GABA, were used for further analyses. GSH levels from all four sequences were corrected for the proportion of gray matter, white matter, and CSF within the spectroscopic voxel using Matlab code based directly from Gasparovic et al4. All GSH levels are reported in institutional units. To test the accuracy of GSH quantification of each of the 4 sequences, six phantoms were built with varying concentrations of GSH: 0 mM, 1 mM, 1.75 mM, 2.5 mM, 5 mM, and 10 mM. Each phantom also contained metabolites with overlapping resonances at neurobiological concentrations. Reproducibility between sessions was assessed via mean coefficients of variation (CVs in %), mean absolute differences (ADs in %), and standard error of measurement (SEM).Results
Representative spectra acquired from each of the four sequences are shown in Figure 2. Data from all the sequences were of excellent quality, and the CV of shim FWHM across sequences was 0.60% with a range of 0-1.2% for session 1 and 0.73% with a range of 0.33-1.68% for session 2. A one-sample Wilcoxon test revealed that the CVs between sessions were not significantly different (p=0.441); thus, spectral quality was consistent across sessions. All GSH data were included in reproducibility analyses since all data were below goodness of fit thresholds. In terms of mean CV, PR-STEAM had the lowest CV of 5.4% followed by PRESS at 7.0%, SPECIAL at 8.0%, and finally MEGA-PRESS with a CV of 13.0%. For mean AD, PR-STEAM had the lowest AD of 7.5% whereas SPECIAL and PRESS had nearly identical mean AD of 10.1% and 10.2%, respectively. MEGA-PRESS had the highest mean AD of 18.4%. SEM was lowest for PRESS followed by PR-STEAM, SPECIAL, and MEGA-PRESS. Linear regressions between actual and detected GSH levels in phantoms for all sequences were excellent at r2=0.983-999.Discussion
In this study, we compared the reproducibility of four commonly used techniques to quantify cerebral GSH in vivo. Of the four techniques, PR-STEAM had the lowest mean CV and AD followed by PRESS, SPECIAL, MEGA-PRESS. The reproducibility between PRESS and SPECIAL was comparable and only slightly higher than PR-STEAM. MEGA-PRESS had the highest mean CV and AD as well as SEM. Phantom studies showed that GSH quantification from the 4 techniques is valid. Overall, these data suggest that GSH can be reliably quantified without the use of spectral editing.Acknowledgements
This study was supported by the National Institute Health: R01MH094520References
1Govindaraju V, Young K, Maudsley AA. Proton NMR chemical shifts and coupling constants for brain metabolites. NMR Biomed 2000;13(3):129-153. 2Provencher SW. Estimation of metabolite concentrations from localized in vivo proton NMR spectra. Magn Reson Med 1993;30(6):672-679. 3Edden RA, Puts NA, Harris AD, Barker PB, Evans CJ. Gannet: A batch-processing tool for the quantitative analysis of gamma-aminobutyric acid-edited MR spectroscopy spectra. J Magn Reson Imaging 2014;40(6):1445-1452. 4Gasparovic C et al. Use of tissue water as a concentration reference for proton spectroscopic imaging. Magn Reson Med 2006; 55(6): 1219-1226.Figures
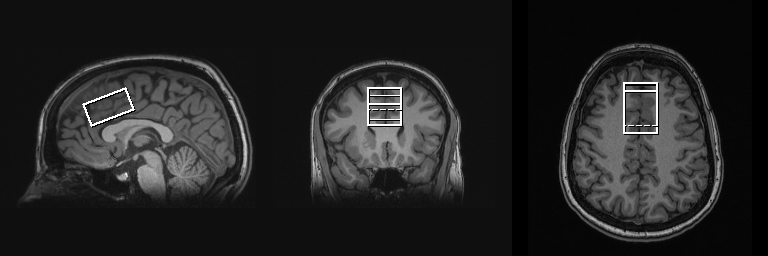
Three T1-weighted images showing voxel placement in the medial frontal lobe, including the anterior cingulate.
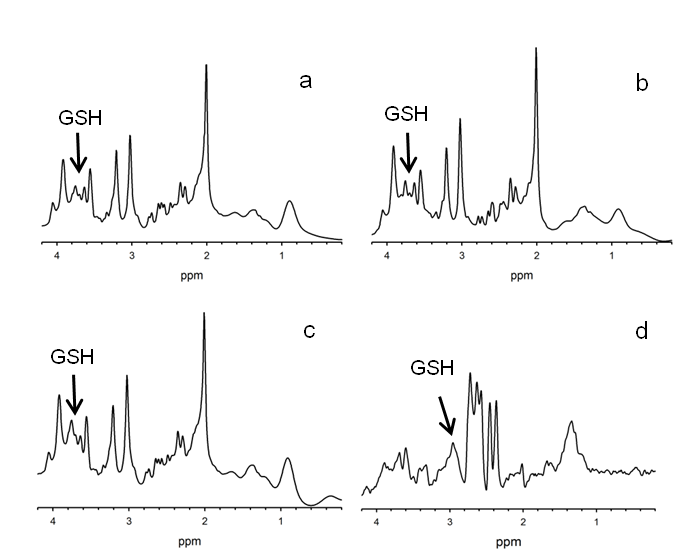
Representative spectra acquired in one session using SPECIAL (a), PRESS (b), PR-STEAM (c), and MEGA-PRESS (d). Data acquired using PRESS, SPECIAL, and PR-STEAM were
analyzed in LCModel, and the MEGA-PRESS data was analyzed in Gannet.