1342
Non-invasive mapping of glutathione levels in mouse brains by electron paramagnetic resonance (EPR) imaging1Sapporo Medical University, Sapporo, Japan, 2Osaka University, Toyonaka, Japan
Synopsis
Glutathione (GSH) is an important antioxidant that can protect cells under oxidative stress. Thus, a non-invasive method to measure GSH levels in live animals is needed. To map the levels of GSH in mouse brains, a new method using electron paramagnetic resonance (EPR) imaging with nitroxide imaging probes was developed. By analyzing the relationship between reduction rates for nitroxides in brains measured by EPR and brain GSH levels measured by biochemical assay, pixel-based mapping of brain GSH levels was successfully obtained. The newly developed method was applied to a kindling mouse model of epilepsy to clarify the role of GSH.
Purpose
Glutathione (GSH) is an important antioxidant that can protect the cell against reactive oxygen species under oxidative stress. Several studies have reported decreased levels of brain GSH in rodent models of epilepsy and Alzheimer’s disease; thus, a non-invasive method to measure GSH levels is needed for monitoring and evaluating its antioxidant capacity in those models. Recently, in our electron paramagnetic resonance (EPR) imaging studies on GSH-depleted mouse brains, we found that the reduction rate constants of nitroxide imaging probes depend on the levels of GSH in mouse brains1. Using this relationship, GSH levels in mouse brains can be estimated and visualized from the pixel-based map of reduction rate constants of nitroxides distributed in mouse brains. In the present study, using the mouse model of GSH depletion with diethyl maleate (DEM), three-dimensional (3D) mapping of GSH levels in mouse brains was examined non-invasively by EPR imaging with the nitroxide 3-methoxycarbonyl-PROXYL (MCP). Furthermore, we applied this method to a pentylenetetrazole (PTZ)-induced kindling model of epilepsy and visualized GSH levels in kindled mouse brains.
Materials and Methods
Chemicals: MCP was obtained from NARD Chemicals, Ltd. (Osaka, Japan). DEM was obtained from Wako Pure Chemicals (Osaka, Japan). PTZ was from Sigma-Aldrich (St. Louis, MO). Animals: Male C57BL/6 mice aged 6 to 10 weeks with body weights of 20–25 g were used. For DEM treatment, mice were given a single injection of DEM (4 mmol/kg) intraperitoneally. To prepare kindled mice, sub-convulsive doses (35 mg/kg) of PTZ were intraperitoneally injected once a day. MRI measurements: MRI of mouse heads was acquired using an MRmini scanner (MR Technology, Tsukuba, Japan) with a 0.5 T permanent magnet. EPR imaging: All EPR images were acquired using an in-house built 750 MHz CW-EPR imager. Using the rapid magnetic field scan system, the fastest data acquisition time for 3D-EPR images is about 9 s for 50 ms field scanning (6 mT field scan) and 181 projections. Brain GSH level: GSH levels were measured using high-performance liquid chromatography (HPLC) with electrochemical detection.Results and Discussion
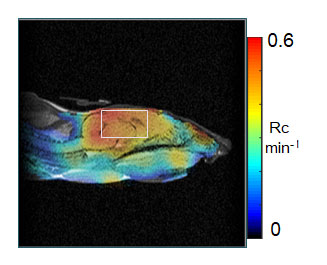
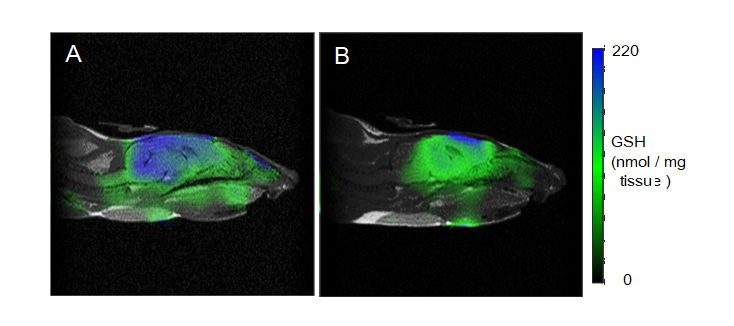
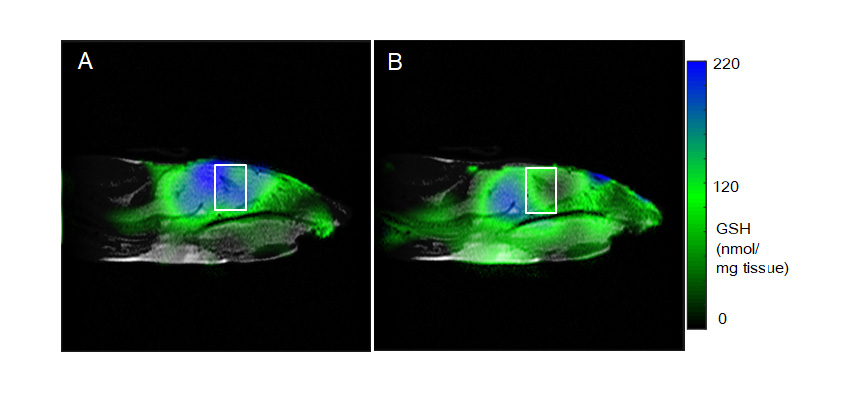
After infusion of MCP to control (n=8) and DEM-treated (n=8) mice through the tail vein, temporal EPR images of mouse heads were measured every 9 s. Based on the pharmacokinetics of the MCP reduction reaction, the pixel-based rate constant of its reduction reaction was calculated and mapped as a redox map. The redox map of the examined mouse head was co-registered to its MRI (Fig. 1). The average rate constants within selected ROI in the brain were calculated for control and GSH-depleted mice. After imaging experiments, brain GSH levels were measured in vitro by HPLC. The reduction rate constant (Rc) for MCP in each mouse with or without DEM treatment was plotted against brain GSH level ([GSH]). Rc in mouse brain increased linearly with [GSH] for each mouse, and the following linear relationship between Rc and [GSH] was obtained: Rc = 0.0021 × [GSH, mmol/g tissue] + 0.1368, where R2 = 0.9812 for 16 mice. By converting the value of Rc to [GSH] at each pixel of a redox map using this equation, a GSH map of examined mouse brains was obtained from their redox maps for control and DEM-treated mice (Fig. 2). In control mouse brains, GSH was distributed throughout the brain, and more GSH was found in the cerebellum and hippocampus than in the cerebrum. GSH distribution in these regions of mouse brains was significantly reduced by DEM treatment. The distribution pattern of GSH described in Fig. 2 was similar to that obtained by previously published invasive methods such as auto-radiographic imaging and histochemical staining. Next, we attempted to estimate the change in GSH levels in PTZ-induced kindled mouse brains. A redox map of PTZ-induced kindled mouse brains was obtained by EPR imaging with MCP, and this redox map was converted to a GSH map of kindled mice. Figure 3 shows GSH maps of control and kindled mouse brains, and clearly reveals a remarkable change in GSH levels around the hippocampal region. These results also indicate that the hippocampus was susceptible to oxidative damage with PTZ treatment, which was followed by the decrease in GSH levels.Conclusion
This study shows that the EPR imaging method with the nitroxide MCP can visualize brain GSH levels in mice non-invasively. The brain GSH map in PTZ-kindled mice obtained by EPR imaging clearly indicates the decreased level of GSH in the hippocampal region. The method of mapping GSH levels developed in this study will contribute to further clarifying the role of GSH in neurodegenerative disease.Acknowledgements
This work was supported by a grant from the Japanese Society for the Promotion of Science (24791318).References
1 Proc. Intl. Soc. Mag. Reson. Med. 25 5594 (2017)Figures