1339
1H MRS Reveals Major Changes in Brain Metabolites Induced by Human Pancreatic Cancer XenograftsSantosh Kumar Bharti1, Paul T Winnard Jr.1, Yelena Mironchik1, Marie-France Penet1, Anirban Maitra2, and Zaver M Bhujwalla1,3
1Division of Cancer Imaging Research, Department of Radiology, Johns Hopkins University, School of Medicine, Baltimore, MD, United States, 2Department of Pathology, The University of Texas MD Anderson Cancer Center, Houston, TX, United States, 3Department of Oncology, Johns Hopkins University, School of Medicine, Baltimore, MD, United States
Synopsis
Our ongoing efforts are focused on understanding systemic metabolic changes that occur during cancer-induced cachexia using human pancreatic ductal adenocarcinoma (PDAC) xenografts, since the syndrome occurs with the highest frequency and severity in PDAC. We used 1H MRS to analyze brain metabolite levels in mice with and without cachexia inducing human PDAC xenografts. Spectra revealed depletion of several metabolites, including neurotransmitters, in cachectic mice. These findings provide new insights into disruption of brain metabolism that may compromise central nervous system (CNS) function. Identifying alterations of brain metabolism may provide novel interventions to prevent or reduce CNS injury and cachexia.
Introduction
Cancer-induced cachexia accounts for approximately 20% of all cancer deaths [1]. In pancreatic cancer, the syndrome affects nearly 80% of patients [2, 3]. The uncontrollable extreme weight loss due to cachexia results in a particularly poor quality of life causing profound weakness, listlessness, and an inability to function. In pancreatic cancer especially, where resection is not possible for a majority of patients, palliation with chemotherapy is the only option of prolonging life, and cachexia results in lower tolerance to chemotherapy. Cachectic patients experience a wide range of symptoms affecting the function of several organs such as, muscle, liver, brain, and heart, which decrease the quality of life and worsens prognosis. A major characteristic of cachexia is accelerated skeletal muscle and storage fat wasting causing nutrient mobilization both directly as lipid and amino acids and indirectly as ketone bodies and glucose derived from liver keto- and gluconeogenesis with systemic distribution including to the tumor through the bloodstream [4]. Patients with cachexia develop extensive metabolic stress from increased proteins and fat tissue burning resulting in increased energy expenditure. Previously, we have reported the initial characterization of a myoblast optical imaging reporter that allowed real-time longitudinal monitoring of the early onset of cancer induced wasting and measured plasma metabolic changes associated with PDAC-induced cachexia [5]. Here, for the first time, we have performed high-resolution quantitative 1H magnetic resonance spectroscopy (MRS) of brain tissue obtained from normal mice and mice with human PDAC xenografts that induce cachexia (Pa04C) or are noncachectic (Panc1). Profound alterations in 1H MRS derived metabolite profiles specific to the brains of cachectic mice were detected.Methods
Human pancreatic cancer cell lines, Panc1 and Pa04C were obtained from ATCC or provided by Dr. Maitra [6] respectively. Generation of the dual fluorescence myoblast cell line has been described in our previous report [5]. Male severe combined immunodeficient (SCID) mice were inoculated in the right flank with cancer cells (2 × 10⁶) and in the right hind leg muscle with reporter myoblasts (2×10⁶). Once the mice were sacrificed, brains were harvested, freeze clamped and stored in -80°C until 1H MRS analysis. Dual phase solvent extraction was performed on brain tissues. The water phase was separated, freeze dried, reconstituted in D2O PBS and transferred to a 5mm NMR tube for spectral acquisition. All 1H MR spectra were acquired on an Avance III 750 MHz (17.6T) Bruker NMR spectrometer equipped with a 5 mm broadband inverse (BBI) probe. 1H MR spectra with water suppression were acquired using a single pulse sequence with the following experimental parameters: spectral width of 15495.86 Hz, data points of 64 K, 90° flip angle, relaxation delay 10 sec, acquisition time 2.11 sec, 64 scans with 8 dummy scans, receiver gain 80.6. Spectral acquisition, processing and quantification were performed using TOPSPIN 2.1 software.Results and Discussion
As anticipated, mice with cachexia-inducing Pa04C tumors showed significant weight loss over time. No significant change in average brain weights was observed between the normal, cachectic and noncachectic groups. For the first time, we found that brains from Pa04C tumor bearing mice exhibited a profound reduction in water soluble metabolites as compared to Panc1 and nontumor bearing normal mice. Representative spectra from normal, Panc1 and Pa04C are displayed in Figure 1. Significant decreases in neurotransmitters: g-aminobutyric acid (GABA), N-acetyl aspartate (NAA), and taurine as well as lactate, myo-inositol, phosphocholine, glycerophosphocholine (GPC), creatine, formate, and essential amino acids: Leu, ILe, Val, and Phe were observed in brains from cachectic (Pa04C) mice compared to noncachectic (Panc1) and healthy Normal mice (Figure 2). A heat map display of brain metabolites from normal mice and Panc1, and Pa04C tumor bearing mice is presented in Figure 3. Non-cachexia inducing Panc1 tumors also induced a significant decrease of brain GABA, glutamate, aspartate, total choline and tyrosine compared to normal brains. Although this decrease was not as profound as in the cachectic mice, it highlighted the potential for systemic changes induced in the brain by cancers. These results provide new insights into profound changes in brain metabolism during cachexia that are likely indicative of compromised CNS function and may be a major contributing factor to the systemic control of cachectic wasting. These data provide strong evidence to support investigating new metabolic interventions to reverse CNS injury and cachexia as well as providing new CNS targets for early detection using in-vivo MRS techniques.Acknowledgements
This work was supported by NIH R01 CA193365, NIH R35CA209960, and NIH P30CA06973.References
- Argiles JM, Busquets S et al: Cancer cachexia: understanding the molecular basis. Nature reviews Cancer 2014, 14(11):754-762.
- Fearon KC, Baracos VE: Cachexia in pancreatic cancer: new treatment options and measures of success. HPB (Oxford) 2010, 12(5):323-324.
- Ozola Zalite I, Zykus R et al: Influence of cachexia and sarcopenia on survival in pancreatic ductal adenocarcinoma: a systematic review. Pancreatology 2015, 15(1):19-24.
- Porporato PE: Understanding cachexia as a cancer metabolism syndrome. Oncogenesis 2016, 5:e200.
- Winnard PT, Bharti S et al: Detection of Pancreatic Cancer-induced Cachexia using a Fluorescent Myoblast Reporter System and Analysis of Metabolite Abundance. Cancer Research 2015.
- Penet MF, Shah T et al: Metabolic imaging of pancreatic ductal adenocarcinoma detects altered choline metabolism. Clin Cancer Res 2015, 21(2):386-395.
Figures
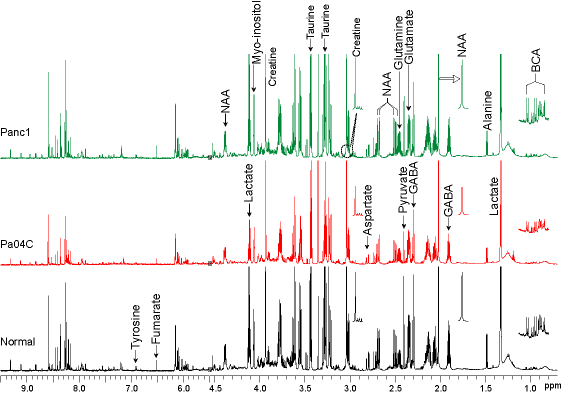
Figure 1: Representative 1H MR spectra of aqueous extracts
of brain tissue obtained from Panc1 and Pa04C tumor bearing mice, and normal
mice. Relative to normal mice, significant alterations in metabolite levels
were identified in brains from Panc1 and Pa04C tumor bearing mice. (BCA;
branched chain amino acid)
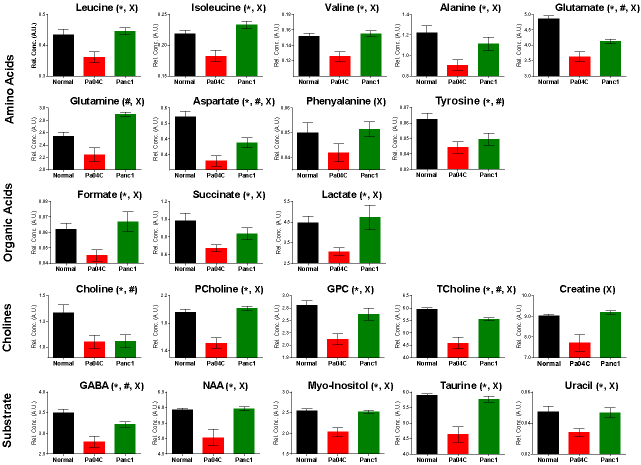
Figure 2: Quantitative estimation of metabolites in water soluble
extracts from brains. Unpaired two tailed Student t-tests were performed
between Pa04C (n=13) and Panc1 (n=8), Pa04C
and Normal (n=5), and Panc1 and Normal brains; p <0.05was considered
significant. Bar plots represent Mean±SEM. Areas under the peaks were normalized to
references and sample weights. * Represents significant difference
between Normal vs Pa04C, # represents significant difference
between Normal vs Panc1, and X represents significant difference
between Pa04C vs Panc1
respectively.
Figure 3: Metabolic heat maps representing brain metabolites in water-soluble
extracts obtained from Normal, Panc1, and Pa04C tumor bearing mice. The maximum
level of a metabolite present in any of the groups is taken as 100% and its
corresponding level in the other groups was normalized. (N: Normal n=5; PC:
Pa04C n=13; PN: Panc1 n=8)