1338
Gene Expression Profiling to Understand the 1H MRS Characterization of the VEGF Metabolic Secretome from a Triple Negative Human Breast Cancer XenograftSantosh Kumar Bharti1, Balaji Kirshnamachary1, Louis Dore-Savard2, Brett Stark1, Aleksander S. Popel3, and Zaver M Bhujwalla1,4
1Division of Cancer Imaging Research, Department of Radiology, Johns Hopkins University, School of Medicine, Baltimore, MD, United States, 2McGill University Health Centre and RI-MUHC, Montreal, QC, Canada, 3Systems Biology Laboratory, Department of Biomedical Engineering, Johns Hopkins University, School of Medicine, Baltimore, MD, United States, 4Department of Oncology, Johns Hopkins University, School of Medicine, Baltimore, MD, United States
Synopsis
Vascular endothelial growth factor (VEGF A) is a potent regulator of angiogenesis, invasion, and metastasis, especially in breast cancer. Secreted VEGF that forms a part of the interstitial milieu along with other metabolites shapes the microenvironment. Here, using 1H MR spectroscopy and microarray, we have characterized the metabolic and gene signature of the tumor tissue derived from MDA-MB-231 cells that stably overexpressed VEGF gene. Metabolic changes supported by gene array data provide new insight into the role played by VEGF in breast cancer progression
Introduction
Vascular endothelial growth factor (VEGF) A, is a key regulator of physiological and pathological angiogenesis in a multitude of diseases including breast cancer. To expand our understanding of the role of VEGF in cancer aggressiveness we recently characterized the angiogenic secretome of MDA-MB-231 tumors with and without VEGF overexpression by using a Proteome Profiler Antibody Array kit to characterize cytokines in the TIF obtained from these tumors [1]. Here we have related the metabolic patterns of TIF from these tumors obtained using 1H MRS, to the associated gene changes in the same tumors obtained using an Affymetrix GeneChip.Methods
TIF from wild type (231 WT) and VEGF (231 VEGF) overexpressing triple negative MDA-MB-231 tumors was collected as previously described [2]. After collecting TIF, tumor samples were freeze clamped and the tissue used for microarray analysis of gene expression. mRNA expression profiling of 231 WT and 231 VEGF tumors was carried out using an Affymetrix GeneChip Human Genome U133 Plus 2.0 Array per the manufacturer's protocol. Data was then processed for differential expression and categorized into groups based on various metabolites that were found in the TIF 1H MRS studies. High-resolution 1H MRS of TIF was performed on an Avance III 750 MHz Bruker Spectrometer equipped with a 5 mm broadband inverse probe. 1H MR spectra with water suppression were acquired using a one-dimensional Carr-Purcell-Meiboom-Gill (CPMG) pulse sequence with the following parameters: spectral width of 15495.8 Hz, time domain data points of 64K, effective 90° flip angle, relaxation delay 10s, acquisition time of 2.1s, 128 number of scan with 8 dummy scan, a receiver gain of 1030, and echo time of 25ms [2].Results and Discussion
VEGF overexpression resulted in significant changes in metabolites detected by 1H MRS as shown in the representative spectra in Figure 1. Changes in metabolites are summarized in Figure 2 for metabolites that increased or decreased over 20%. Also shown in Figure 2 are the genes that showed a 1.3 fold or higher change (decreased in green, increased in red) in 231 VEGF tumors compared to 231 WT tumors associated with each of the metabolites displayed in the heat map. The 20% increase in acetoacetate in VEGF tumors was associated with changes in fumarylacetoacetate hydrolase domain containing 2B (FAHD2B) and fumarylacetoacetate hydrolase domain containing 2A (FAHD2A). The 30% increase of arginine/lysine was associated with changes in lysine demethylase 1B, 5A (KDM1B and KDM5A), WNK lysine deficient protein kinase 1 (WNK1), lysine acetyltransferase 7 (KAT7), arginine and serine rich coiled-coil 1 (RSRC1), protein arginine methyltransferase 6 (PRMT6), arginine and glutamate rich 1 (ARGLU1), KDM8, KDM4A, arginine vasopressin (AVP), PRMT1, ASH1 like histone lysine methyltransferase (ASH1L), dimethylarginine dimethylaminohydrolase 1 (DDAH1), arginine and serine rich protein 1 (RSRP1), WNK4, KDM5D, electron transfer flavoprotein beta subunit lysine methyltransferase (ETFBKMT), lysine methyltransferase 2E (KMT2E), serine and arginine rich splicing factor 5 (SRSF5), ADP-ribosylarginine hydrolase (ADPRH), alanine and arginine rich domain containing protein (AARD), KDM4D. The 30% increase of glutamate was associated with PAXIP1 associated glutamate rich protein 1 (PAGR1), SH3 domain binding glutamate rich protein like (SH3BGRL), glutamate decarboxylase 1 (GAD1), glutamate receptor interacting protein 1 (GRIP1), glutamate-ammonia ligase, (GLUL), glutamate-cysteine ligase modifier (GCLM). The 34% increase of acetate was associated with isoamyl acetate-hydrolyzing esterase 1 homolog (IAH1), FAHD2B, FAHD2A. The 35% increase of choline was associated with phosphate cytidylyltransferase 1 choline alpha (PCYT1A). The 36% increase of BHB was associated with branched chain keto acid dehydrogenase E1 alpha polypeptide (BCKDHA). The 36% decrease of glucose was associated with glucose-6-phosphate dehydrogenase (G6PD), glucose-6-phosphatase catalytic subunit (G6PC), suppressor of glucose, autophagy associated 1 (SOGA1), glucose-fructose oxidoreductase domain containing 1 (GFOD). The 38% increase of lipid was associated with phospholipid scramblase 4 (PLSCR4), ATPase phospholipid transporting 8A1 (ATP8A1), hypoxia inducible lipid droplet associated (HILPDA), ATP11B (putative), lipid droplet associated hydrolase (LDAH), StAR related lipid transfer domain containing 4 (STARD4), PLSCR1, SEC14 like lipid binding 2 (SEC14L2), phospholipid transfer protein (PLTP), STARD13, SEC14 L1, proteolipid protein 2 (PLP2), Raftlin, lipid raft linker 1 (RAFN1). The 38% increase of PUFA was associated with fatty acid binding protein 6 (FABP6), ELOVL fatty acid elongase 6 (ELOVL6), fatty acid desaturase 1 (FADS1), FADS2 2, fatty acid 2-hydroxylase (FA2H), ELOVL7, FABP5. The 50% increase of phosphocholine was associated with lecithin retinol acyltransferase (LRAT), lysophosphatidylcholine acyltransferase 3 (LCAT3). The 55% increase of lactate was associated with ilvB acetolactate synthase like (ILVBL). These data highlight the major and provide new insights in the role of VEGF in modifying tumor metabolism as well as several genes in key metabolic pathways.Acknowledgements
This work was supported by NIH R35CA209960, R01CA138264 and NIH P30CA06973. We thank Mr. Gary Cromwell for valuable assistance.References
- Dore-Savard L, Lee E, Kakkad S, Popel AS, Bhujwalla ZM. The Angiogenic Secretome in VEGF overexpressing Breast Cancer Xenografts. Scientific reports. 2016;6:39460. doi: 10.1038/srep39460.
- Bharti, SK and Roy, R. Metabolite Identification in NMR-based Metabolomics. Current Metabolomics. 2014; 2: 163-173.
Figures

Figure 1. Representative 1H MR spectra obtained
from 231 WT (black) and 231 VEGF (red) tumors.
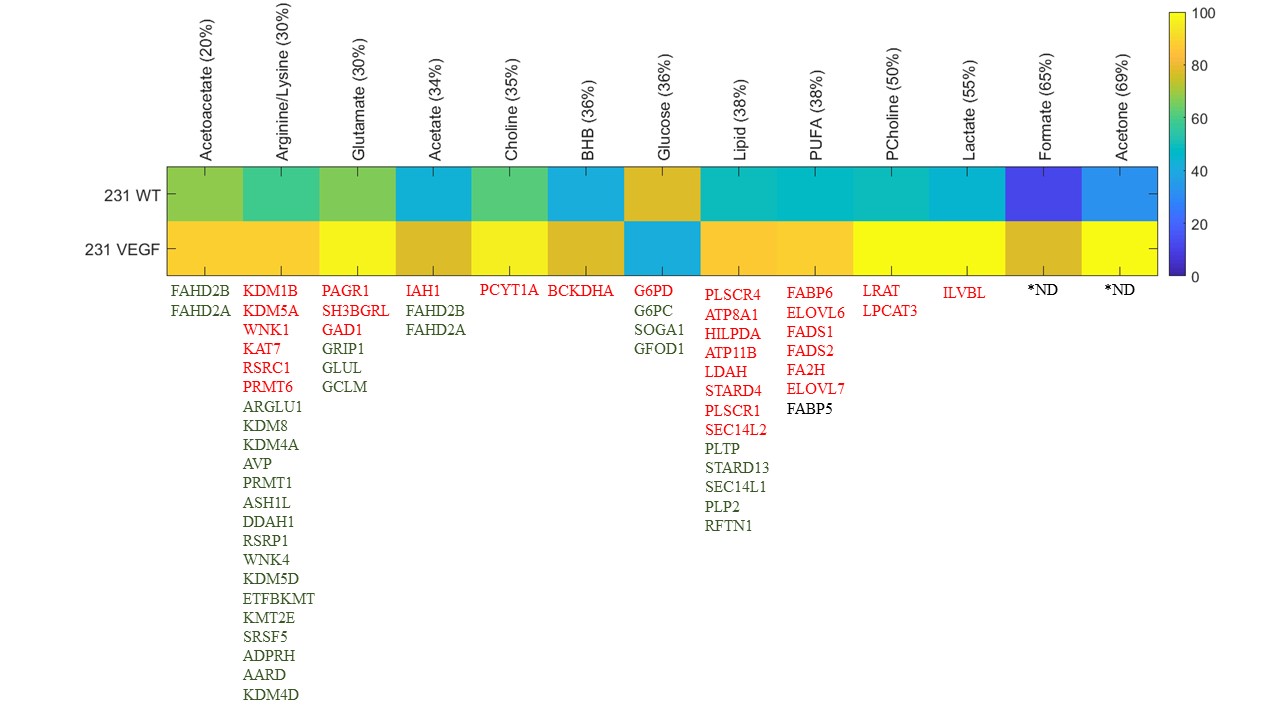
Figure
2. Heat map of metabolites that exhibited over 30% changes in 231 VEGF
(n=4) compared to 231 WT (n=4) tumors.
Genes associated with each of the metabolites are represented as gene
symbols. Genes that showed a 1.3 fold or higher decrease in 231
VEGF tumors compared to 231 WT tumors are shown in green, and genes that showed
a 1.3 fold or higher increase in 231 VEGF tumors compared to 231 WT tumors are
shown in red. *ND; not
determined. PUFA: polyunsaturated fatty
acids; BHB: beta hydroxybutyrate.