1337
Metabolic characteristics of oncogenically transformed mouse neural progenitor cells using one dimensional 1H NMR1Northern Institute for Cancer Research, Newcastle University, Newcastle, United Kingdom, 2School of Natural and Environmental sciences, Newcastle University, Newcastle, United Kingdom, 3Institute of Neuroscience, Newcastle University, Newcastle, United Kingdom, 4Northern Institute for cancer research, Newcastle University, Newcastle, United Kingdom
Synopsis
Metabolic profiles of oncogenically transformed neural progenitor cells (NPCs) derived from 3 and 12 month old mice were evaluated using one dimensional 1H NMR spectroscopy. Principal component analysis revealed two distinct clusters which corresponded to the differently-aged NPCs. Metabolites identified in these cell lines were similar but differed in their relative abundance. The 3 month NPCs were characterised by high lipid CH2, creatine and choline. The metabolic signature of 12 month NPCs featured high levels of taurine, myo-inositol and branched-chain amino acids. This data suggests alterations in metabolic phenotype of aged NPCs which may arise from differences in enzymatic capacity.
Introduction
Glioblastoma (GBM) is the most common primary adult-onset brain tumour and currently has unfavourable prognostic outcomes1. Understanding the molecular mechanisms that underpin GBM pathogenesis will aid the development of more clinically relevant animal models which in turn facilitates the development of more efficacious therapies. One such model exploits orthotopic transplantation of oncogenically transformed mouse neural progenitor cells (NPCs) in an immunocompetent mouse2. The maintenance of host immunity, an intact blood brain barrier and a dynamic tumour microenvironment is useful for evaluating tumour biology and testing of pharmacological compounds. The objective of this study was to investigate the metabolic profiles of differentially aged transformed mouse NPCs using one dimensional 1H NMR. Identification of alterations in metabolic networks may be useful for development of diagnostic and prognostic biomarkers e.g. PET tracers and in vivo MRS.Methods
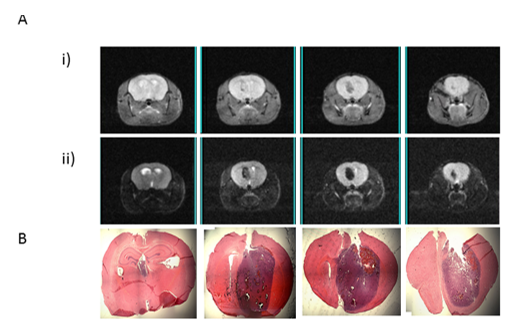
Intracranial injections. Isolated NPCs from adult-wildtype C57BL/6 mice which were previously transformed through inhibition of the p53/Rb pathways and overexpression of Ras, were transplanted into striatum of mice with the same genetic background. Mice were clinically monitored and imaged using in vivo MRI (7 T, Varian) at 14 day intervals to monitor tumour progression. Endpoint post-mortem histology of brains were evaluated to confirm presence of tumour. Metabolic profiling. 3 month and 12 month NPCs were grown in 10 cm culture dishes in the following drug conditions for 24 hours: Control (PBS and 10% DMSO), 100µM Etomoxir, 100µM Temozolomide and combined drug group in duplicate. Cells were washed in PBS and centrifuged at 1500 rpm for 3 mins and pellets frozen until use. Cells were re-suspended in 500 µl of deuterium oxide and loaded into a 5mm NMR tube. One dimensional 1H NMR spectra was acquired using a 700 MHz spectrometer (Bruker Biospin GbmH, Germany) at 294K. 1H spectra were acquired with water suppression using pre-saturation, spin echo and TE= 8ms. Spectral processing was executed using Mestresnova version 11 (Mestrelabs Research S.L.). All spectra were baseline corrected using ablative method and out of phase spectral regions corrected manually. Metabolites were assigned based on literature and the human metabolome database3. The area under each peak was defined by their integral values which were normalised to the total area of spectrum and referenced to creatine at 3.03ppm. Statistical analysis. Multivariate analysis using principal component analysis (PCA) was performed. Regions containing solvent peaks were discarded from the analysis.Results
Orthotopic transplantation of 12 month NPCs into mouse striatum resulted in MRI visible tumours around 100 days post-transplantation (n= 2). This confirmed previous work demonstrating the ability of transformed mouse NPCs to form GBMs that recapitulate human disease.
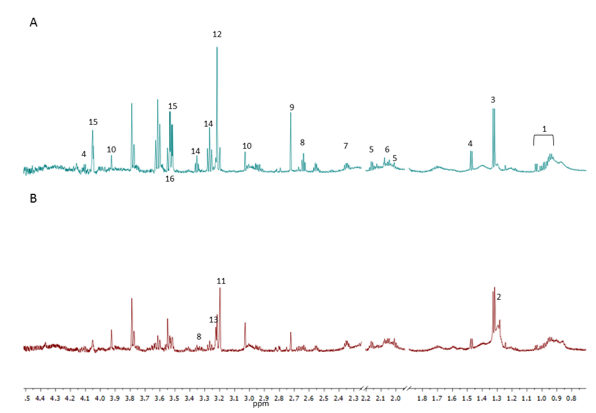
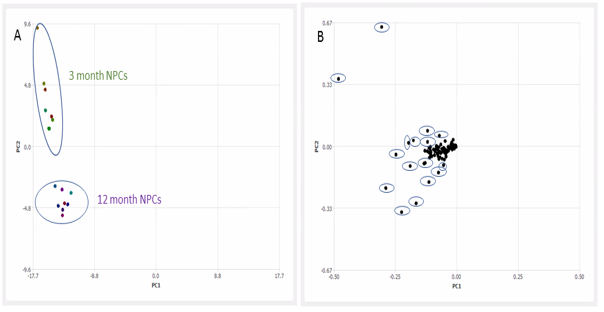
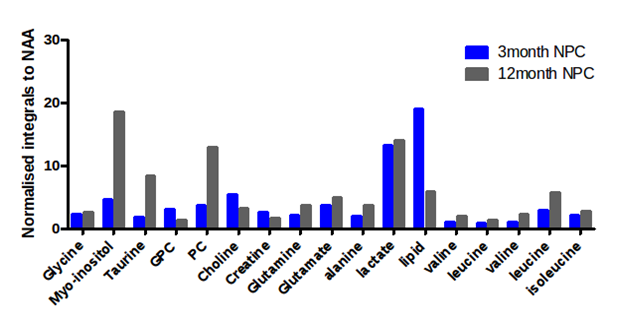
Distinct metabolic signatures were observed for 3 month and 12 month mouse derived oncogenic NPCs. PCA using 5 components revealed two distinct clusters with PC1 accounting for 89% of the variance. The clusters were separated based on cell lines (i.e. 3 month or 12 month NPCs) and were independent of drug treatment. Inspection of the PCA loading plots revealed regions that contributed to separation. Elimination of these regions from spectral analysis reduced separation and resulted in no apparent clustering of the samples. The 3 month NPCs where characterised by high creatine and signals from lipids. However, the 12 month NPCs had higher myo-inositol, taurine, alanine and branched chain amino acids; valine, leucine and isoleucine. The two NPCs had altered ratios of choline based metabolites. 12 month NPCs were characterised by high phosphocholine whereas 3 month NPCs had higher choline levels. Furthermore ratios of glutamine and glutamate were comparable in the NPCs. Levels of NAA was present at low concentrations in both NPCs which may be as a result of their oncogenic transformation.
Discussion
The present study revealed a possible age-associated difference in the metabolic profiles of these tumour initiating mouse NPCs. In our study we found that 12 month NPCs had high levels of taurine which is reported as malignant feature of glioma cells4. Interestingly, 3 month NPCs had more detectable lipids which may be a result of increased fatty acid synthesis or slower catabolism. Previous studies have highlighted alterations in protein expression of enzymes such as creatine kinase and increased malignancy potential in aged NPCs2,5. Changes in the expression of key enzymes may underlie differences observed in metabolite levels. Other variations may result from post-translational modifications in key enzymes, impacting catalytic activity. Further work would use a larger sample size to confirm the metabolic phenotype of these cells. Alterations in metabolic profiles may provide a useful tool in identifying malignant features, subgroup classification and prognostic markers of GBMs.Acknowledgements
This project was supported by the Newcastle University Research Excellence Academy.References
1. Ostrom, Q.T., et al. CBTRUS Statistical Report: Primary Brain and Other Central Nervous System Tumors Diagnosed in the United States in 2009-2013. Neuro-Oncology 18, v1-v75 (2016).
2. Mikheev, A.M., et al. Increased age of transformed mouse neural progenitor/stem cells recapitulates age-dependent clinical features of human glioma malignancy. Aging Cell 11, 1027-1035 (2012).
3. Shao, W., et al. Malignancy-associated metabolic profiling of human glioma cell lines using H-1 NMR spectroscopy. Molecular Cancer 13(2014).
4. De Micheli, E., et al. Extracellular levels of taurine in tumoral, peritumoral and normal brain tissue in patients with malignant glioma: An intraoperative microdialysis study. in Taurine 4: Taurine and Excitable Tissues, Vol. 483 (eds. DellaCorte, L., Huxtable, R.J., Sgaragli, G. & Tipton, K.F.) 621-625 (2000).
5. Stoll, E.A., et al. Aging Neural Progenitor Cells Have Decreased Mitochondrial Content and Lower Oxidative Metabolism. Journal of Biological Chemistry 286, 38592-38601 (2011).
Figures