1335
Restoration of truncated FID by machine learning1Department of Biomedical Sciences, Seoul National University, Seoul, Republic of Korea, 2Department of Radiology, Seoul National University Hospital, Seoul, Republic of Korea
Synopsis
The potential applicability of a recurrent neural network (RNN) in the reconstruction of spectra from truncated FIDs was explored. A RNN was trained on a set of simulated full FIDs with varying metabolite concentrations. Then, the performance of the trained RNN was tested on severely truncated FIDs (~95% truncation). Our preliminary study suggests that RNNs may be used in the restoration of truncated FIDs and thus reconstruction of spectra including tiny multiplets. A well trained RNN may be applicable to the situations where data sampling is highly limited such as in cardiac MRS and spectroscopic magnetic resonance fingerprinting (sMRF).
Target audience
Those interested in the reconstruction of spectra from truncated FIDs.Introduction
Reconstruction of spectra from truncated free-induction-decay (FID) has long been an issue1. A variety of different signal processing algorithms have been reported for this purpose1. Given the recent remarkable success of machine learning in solving a wide range of problems, we explored potential applicability of a recurrent neural network (RNN)2,3,4 in the reconstruction of spectra from truncated FIDs. First, a RNN was trained on a set of simulated full FIDs with varying metabolite concentrations. Then, the performance of the trained RNN was tested on severely truncated FIDs.Methods
FID simulation
FIDs were simulated for protons at 9.4T in response to a one-pulse sequence including 18 metabolites5 (dwell time=0.2 ms, 1024 data points) and macromolecule baseline (Matlab, Mathworks Inc.). Initially, the relative signal intensity of the metabolites was adjusted for normal rat brain according to the literature6. Then, FIDs were generated with varying concentrations of Cho, Cr, NAA, and Lac such that the spectra from the simulated FIDs can be classified into groups of a normal brain and a brain tumor. The macromolecule baseline was modeled (M1-M10) according to the literature6 and included in the spectra with a fixed signal intensity. The SNR and linewidth of the spectra were also adjusted empirically to mimic in vivo data. A total of 50 FIDs were generated (n=33 and 17 for the normal brain and the brain tumor groups, respectively).
RNN
A nonlinear autoregressive neural network (NARNet)2 was
designed by using the neural network toolbox of Matlab (Mathworks, Inc.) (1
hidden layer, 10 neurons, time delay of 240 ms (equivalent to 1200 FID points)). Among the 50 simulated
FIDs, 44 FIDs were selected (n=30 and 14 for the normal brain and the
brain tumor groups), and 30,
7 and 7 FIDs were randomly assigned as training, validation and test data sets,
respectively (equivalent to 30720, 7168, and 7168 FID points). Then, the real
and imaginary parts of the FIDs were separately stored. For the final evaluation
of the performance of the trained RNN, the rest 6 FIDs (n=3 for each group) were truncated down to 50 FID points
(~95% truncation) and the truncated part of the FIDs (974 FID points) were predicted by the trained RNN. The
performance of the RNN was evaluated in terms of the coefficient of
determination R2 between the spectra reconstructed from the full
FIDs and the predicted FIDs over the 0.5-4.5 ppm range.
Results
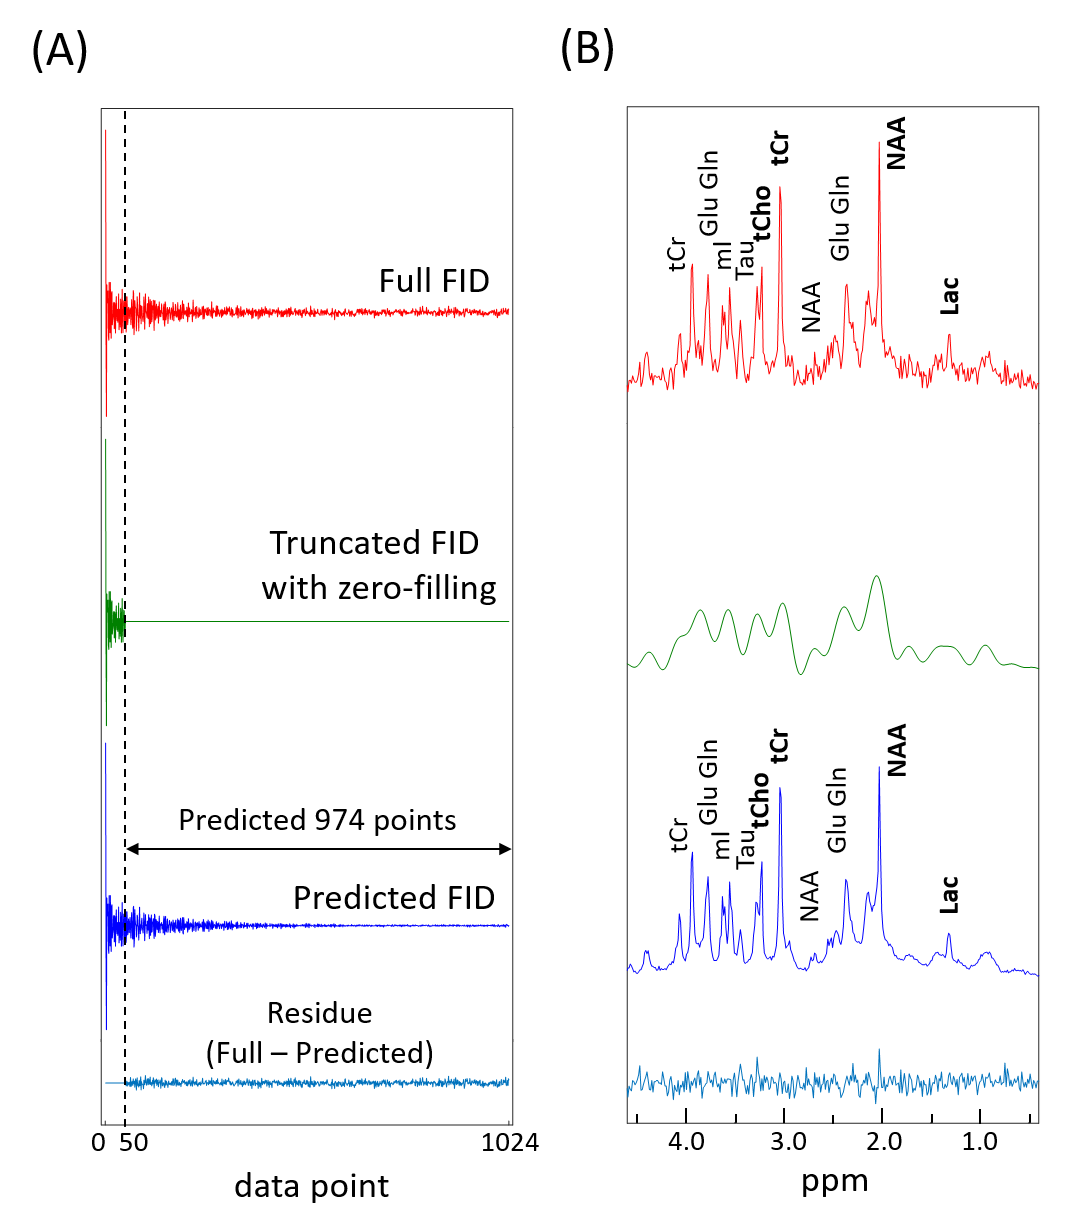
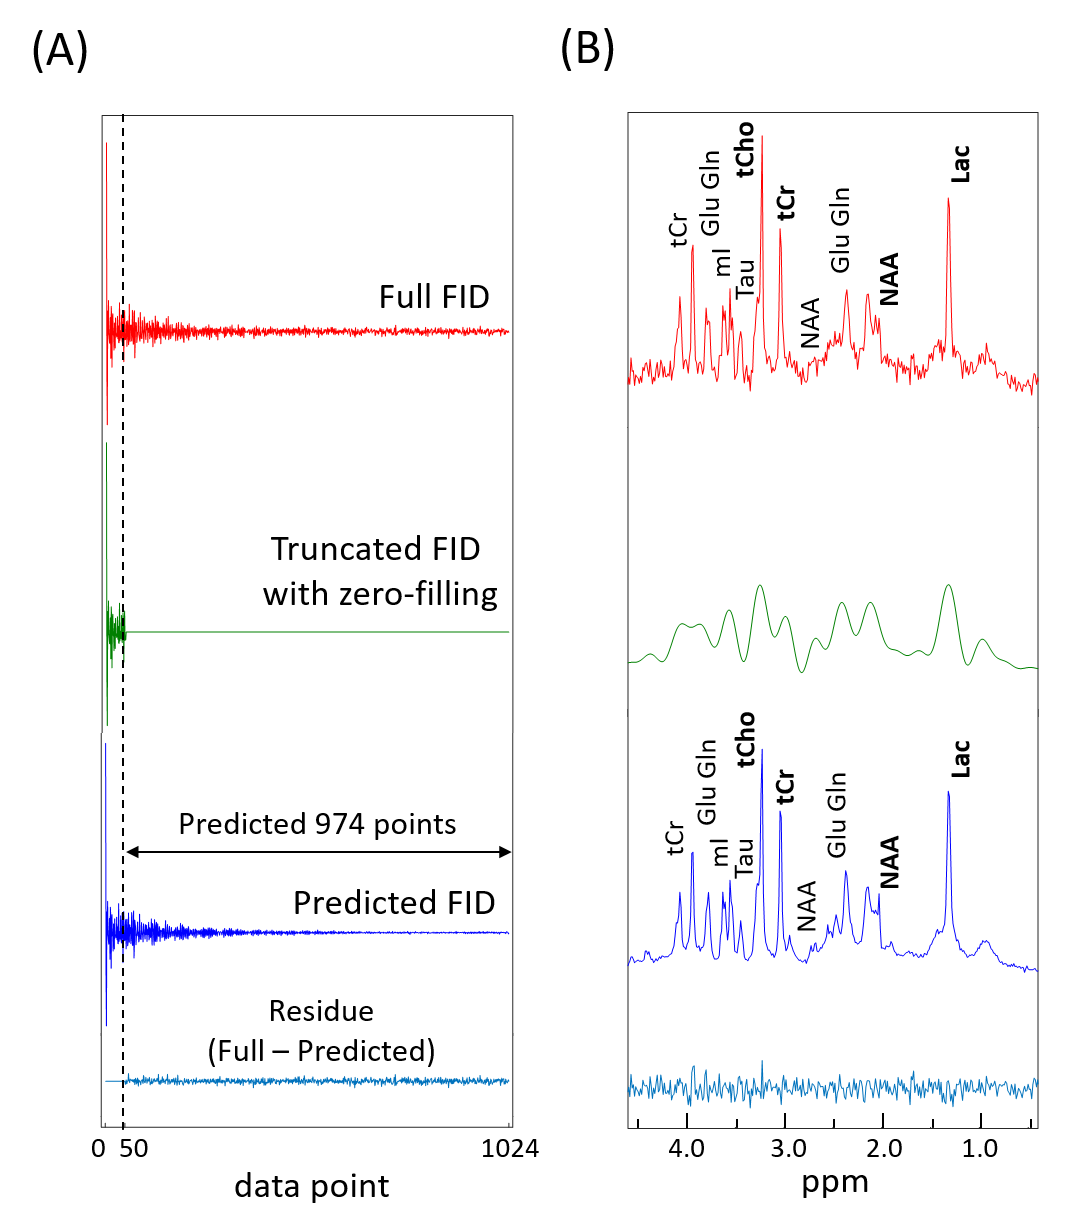
The representative full FIDs, truncated FIDs with zero-filling, and predicted FIDs by the RNN are shown for the normal brain and the brain tumor groups in Figs.1 and 2, respectively, along with the residual FIDs between the full FID and the predicted FID. The corresponding spectra are also shown. For the truncated 6 FIDs, the mean R2 between the spectra from full FIDs and the spectra from predicted FIDs were 0.9200 and 0.9335 for the normal brain and the brain tumor groups. For both FID groups, the relative peak intensity ratios and linewidths are well preserved in the spectra from the predicted FIDs even after 95% truncation. The improved SNR therein is an additional benefit.Discussion
The major limitation of our preliminary study was the use of simulated FIDs, which did not account for potential variations in the macromolecule baseline and had limited ranges of metabolite concentrations, SNR and linewidths. Therefore, drawing a conclusion as to the practical applicability of the RNNs in the restoration of truncated FIDs should be held off till they are thoroughly tested against in vivo spectra with diverse spectral characteristics. The RNNs have been used for nonlinear time-series prediction such as weather forecasting3 and financial market prediction4. The FID in 1H-MRS is also very complicated time-series signal variation resulting from the evolution of spin systems under the chemical shift and J-coupling Hamiltonians in combination with relaxation. Nonetheless, our preliminary study suggests that RNNs might also be used in the restoration of truncated FIDs and thus reconstruction of spectra including tiny multiplets. Upon validation with in vivo data, RNNs may be applicable to the situations where data sampling is highly limited such as in cardiac MRS and spectroscopic magnetic resonance fingerprinting (sMRF)7.Conclusion
The RNNs may potentially be applicable in the restoration of severely truncated FIDs in MRS.Acknowledgements
This work was supported by the National Research Foundation funded by the Korean government, MSIP (NRF-2014M3A9B6069340) and the Ministry of Education, Science and Technology (2016R1D1A1B03931233) of Korea.References
1. Stern AS, Donoho DL, Hoch JC. NMR data processing using iterative thresholding and minimum l1-norm reconstruction. J Magn Reson. 2007;188(2):295-300.
2. Connor JT, Martin RD, Atlas LE. Recurrent neural networks and robust time series prediction. IEEE Trans Neural Netw. 1994;5(2):240–254.
3. Hagan MT, Behr SM. The time series
approach to short term load forecasting. IEEE
Trans Power Syst. 1987;2(3):785–791.
4. Wang JH, Leu JY. Stock market trend prediction using ARIMA-based neural networks. Proc Int Conf Neural Networks. 1996;4:2–7.
5. Thompson RB. “The response of coupled proton spin systems to in vivo nuclear magnetic resonance spectroscopy experiments.” Ph.D. thesis. University of Alberta. 1999.
6. De Graaf RA. In vivo NMR spectroscopy; principles and techniques: 2nd Edition. Wiley. 2007;Ch2.
7. Wang CY, Griswold MA, Yu X. Efficient Quantification of
metabolite concentration and T1 relaxation by 31P spectroscopic magnetic
resonance fingerprinting. Proc Intl Soc Mag Reson 2015;p56.
Figures