1334
Effects of non-linearity correction on statistical descriptors of pH heterogeneity, obtained from 3-APP and inorganic phosphate resonances of tumor 31P MR spectra1CRMBM, Aix-Marseille University, Marseille, France
Synopsis
We recently presented a method for extracting statistical descriptors of pH heterogeneity from lineshapes of pH-sensitive 31P MRS resonances. The first step in this analysis is the conversion of the resonance in question into the corresponding pH profile. The latter is then corrected for non-linearity between chemical shift and pH. However, this procedure is insufficient since the unequal spacing of the digital points making up such pH profiles needs to be compensated for by appropriate weighting. Exact statistical descriptor values are of importance in quantification of tissue pH heterogeneity, an issue that has received major attention in recent cancer research.
Introduction
The 31P MRS chemical shift of a number of phosphates and phosphonates is dependent on pH. Thus, intracellular pH (pHi) in tumors has been determined non-invasively through the (endogenous) inorganic phosphate (Pi) 31P resonance, and extracellular pH (pHe) through the (exogenous) 3-aminopropyl phosphonate (3-APP) resonance 1,2. However, these classical methods obtain, for any given tissue volume or voxel, only one pHi and/or pHe value, as defined by the Pi or 3-APP peak maximum, respectively. In heterogeneous tumors, pHi and/or pHe often vary within the volume in question, and the obtained single pHi or pHe value may not even represent an accurate mean pH, let alone quantitate pH heterogeneity. Yet, quantitative information on the underlying pH distribution is in fact encoded in Pi and 3-APP 31P lineshapes. We recently presented a method for extracting several statistical descriptors of pH heterogeneity from such lineshapes 3. The first step in this analysis is the conversion of the Pi or 3-APP resonance to the corresponding pH profile. Since the relationship between chemical shift and pH is non-linear, corrections for non-linearity should be applied before further evaluation. While the effect of such corrections on peak maxima (modes) has been reported previously 1, studies investigating the consequences of these corrections for the calculation of statistical descriptors of pH heterogeneity are unavailable to date. We present here such a study based on in-vivo tumor 31P MRS spectra of a mouse model, with emphasis on the following descriptors: mean, median, standard deviation, kurtosis, skewness and entropy, as well as mode height and area ratios.Methods
Single-voxel in-vivo 31P MR spectra were acquired from five heterogeneous mouse tumors at 4.7 T (Bruker Biospin, Ettlingen, Germany) after 3-APP injection, as described previously 3 . Processed spectra were saved as ASCII files, and post-processed by a specially programmed spreadsheet (based on EXCEL for Macintosh vs. 14.4.7, Microsoft, Redmond, WA, USA). Statistical descriptors of pH distribution were calculated with or without taking into account the consequences of correction for non-linearity between the chemical shift and pH.Results and Discussion
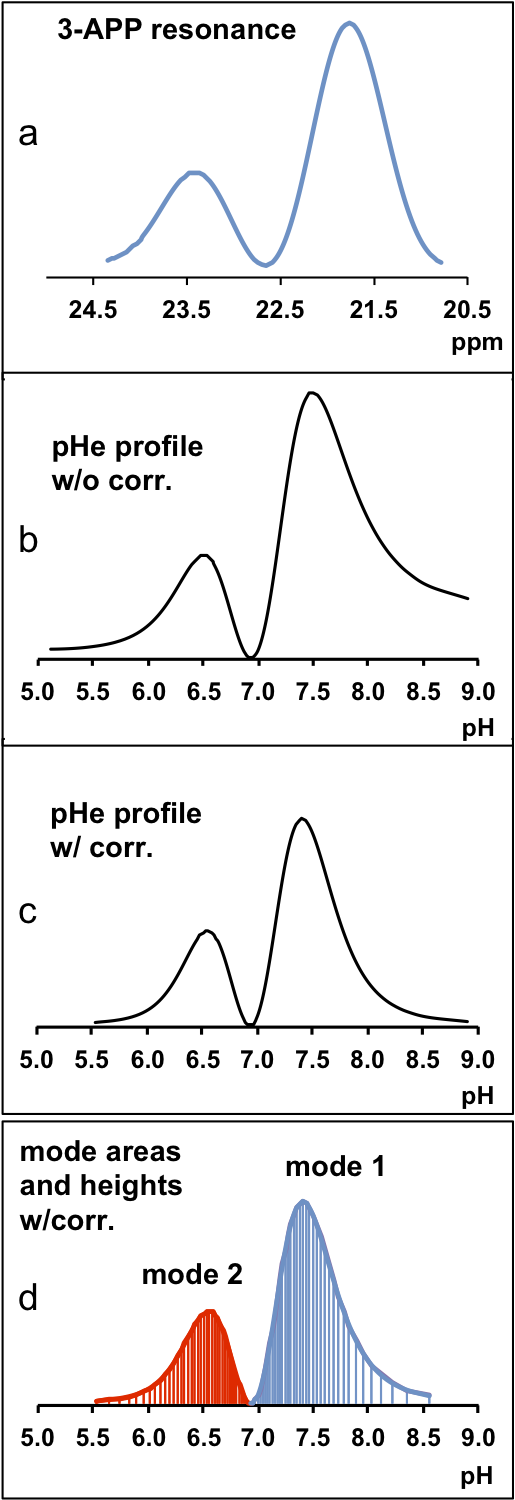
The effects of correction for non-linearity between chemical shift and pH on calculated pH profiles are evident for the representative example shown in Fig. 1 (based on the 3-APP resonance for pHe). The bimodal resonance (a) results in a distorted pH profile (b) unless non-linearity correction is applied (c). Although the latter profile accurately describes the pH distribution per se (provided other linebroadening factors are negligible), it is made up of unevenly spaced digital data points, as illustrated by the vertical lines in (d). Since the calculation of the statistical pH distribution descriptors is based on these digital points, it overemphasizes the central region of the overall distribution where points are more densely spaced than in the wings. This needs to be compensated for by weighting the data points correspondingly, using the intensities in (b) as a reference.
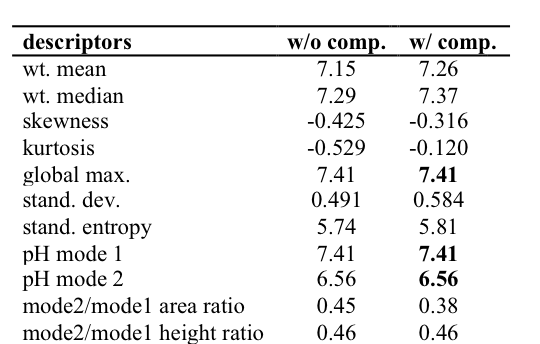
The quantitative results obtained for the pH
distribution of Fig. 1 demonstrate, indeed, that this compensation resulted in
altered descriptor values (Table 1). Weighted mean and median were shifted toward
larger pH values upon compensation, because the relatively strongly pronounced
right tail of the pH distribution was more adequately taken into
consideration. For the same reason, the left skew of the distribution (negative
skewness values) was less marked, and the area ratio (i.e., mode 2 area over mode 1 area) decreased. Moreover, the generally
higher emphasis on the tails lead to a higher kurtosis value, in accord with
the definition of kurtosis 3. Quite logically, extended tails also resulted in increased
standard deviation. Since the pH values of the modes are directly obtained from
the pH distribution curve, the compensation procedure had no effect (bold
numbers). Analogous results have been obtained from four additional animal tumor 31P MR spectra, for both pHe and pHi (data not shown).
Conclusion
To obtain accurate pH profiles from 31P MRS lineshapes such as Pi or 3-APP, correction for the non-linearity between the ppm and pH scales should be applied. However, this procedure is insufficient if statistical distribution descriptors beyond pH values for modes are to be determined. In this case, the unequal spacing of digital data points making up the pH profile needs to be compensated for by appropriate weighting. Correct statistical descriptor values are of importance in quantification of tissue pH heterogeneity, an issue that has received major attention in recent cancer research.Acknowledgements
Support from the Centre National de la Recherche Scientifique, UMR 7339, is greatfully achnowledged.References
1. Graham RA, Taylor AH, Brown TR. A method for calculating the distribution of pH in tissues and a new source of pH error from the 31P-NMR spectrum. Am J Physiol 1994;266:R638-45.
2. Gillies RJ, Liu Z, Bhujwalla ZM. 31P-MRS measurements of extracellular pH of tumors using 3-aminopropylphosphonate. Am J Physiol 1994;36:C195–C203.
3. Lutz NW, Le Fur Y, Chiche J, Pouyssegur J, Cozzone PJ. Quantitative in-vivo characterization of intracellular and extracellular pH profiles in heterogeneous tumors: a novel method enabling multiparametric pH analysis. Cancer Res 2013;73:4616–4628.
Figures