1333
Conditions for extracting statistical descriptors from MR spectra characteristic of heterogeneous materials such as biological tissue1CRMBM, Aix-Marseille University, Marseille, France
Synopsis
Materials such as biological tissue are often characterized by considerable heterogeneity. This can manifest itself in significant variability of certain physicochemical parameter values across the measured volume. If the chemical shift of a particular MR resonance varies systematically with such a parameter, the resulting lineshape can be used to quantitatively characterize the heterogeneity with respect to this parameter. This is achieved by transforming the MRS lineshape into a curve representing the statistical distribution of the parameter values in question, followed by the derivation of a histogram. We study here two important conditions for the statistical evaluation of such spectrum-derived histograms.
Introduction
Heterogeneous materials such as biological tissue are known to significantly broaden MRS lineshapes when compared to homogeneous solutions 1. We have previously suggested to exploit this feature in cases where lineshape is largely determined by a known parameter, x, varying across the measured volume, e.g., x = intra or extracellular pH 2 (31P MRS signals of inorganic phosphate, Pi, or 3-aminopropylphosphonate, 3-APP, respectively), or x = temperature 3 (1H MRS signal of water; relevant in hyperthermia treatment). Under appropriate circumstances, quantitative descriptors of statistical distributions of parameter values, xk (k = 1 to m), can be extracted from the resonances in question, including weighted mean, weighted median, standard deviation, skewness, kurtosis, entropy, and others. In this work, we studied two fundamental conditions for obtaining accurate descriptor values.Methods
In-silico models of MR spectra and derived histograms were generated using a dedicated spreadsheet (based on EXCEL for Macintosh vs. 14.4.7, Microsoft, Redmond, WA, USA). In addition, a phantom containing two 3-APP solutions at pH 6.5 or 7.4 was subjected to single-voxel 31P MR spectroscopy at 4.7 T (Bruker Biospin, Ettlingen, Germany). First, we evaluated statistical descriptor values of well-defined model lineshapes (Lorentzian or Gaussian) as a function of correction for the center of histogram bins, using histograms derived from linehapes. Second, we analyzed statistical descriptor values for our phantom as a function of the ratio of the total number, m, of histogram bins (from m curve points), and the total height (weight W), n, of all histogram bars. These calculations were performed using a customized EXCEL spreadsheet.Results and Discussion
Each digital point of an MRS resonance was transformed into the analog of a histogram bin. Thus, we first analyzed the conditions for constructing correct histograms. In a conventional histogram, the height (= weight Wk) of a bin is proportional to the number of measurements that result in parameter values falling into a given interval (Fig. 1 top; arbitrary max. count = 7 in this example). For our purpose, the counts of histogram bins, b1, b2, ... bm, are replaced with the heights of digital points from MRS resonances. These points define the positions of the center lines of "surrogate bins", x1, x2, ... xm (Fig. 1 bottom, vertical lines; arbitrary max. height = 2800 in this example). Although for conventional histograms, the median is determined by identifying the x value at half the total cumulative sum (x = xcustot/2), our point-based histograms require that to this value, half the difference between xcustot/2 and the next higher x value, xcustot/2+1, be chosen: x = xcustot/2 + 0.5(xcustot/2+1- xcustot/2).
Evaluations of simulated temperature distribution curves (example: Fig. 2) demonstrated that correction for the center of histogram bins indeed lead to noticeable changes for medians. Based on our calculations, uncorrected medians for monomodal (mode 3), bimodal (modes 2 and 3) and trimodal (modes 1 to 3) distributions amounted to 62.19, 58.92 and 56.61 °C, respectively, whereas the corresponding corrected medians were 62.77, 59.51 and 57.19 °C, thus stressing the relevance of the corrections introduced here.
Furthermore, if the number of
bins, m, of a histogram is not optimally chosen, the
standard deviation, s, derived from the histogram becomes dependent on the m/n
ratio, with $$$s=\sqrt{\frac{\sum_{k=1}^m W_{k}(x_{k}-\overline{x})^{2}}{n-1}}$$$.
The mathematical expressions for several other
statistical descriptors, notably skewness and kurtosis, also contain s. In our
algorithms, these descriptors are rendered independent of m/n by proportionally
upscaling all W values (corresponding to raw intensities), which does not affect the statistics of the
distribution. Based on bimodal pH distributions with well-defined m values, we
determined that all three descriptors become virtually n-independent for $$$n>>(10\times m)$$$,
with $$$n=\sum_{k=1}^mW_{k}$$$ (example: m = 40 for Fig. 3, derived from a
phantom 3-APP 31P MR spectrum). Thus, a scaling factor, N (Fig. 3
top left), such that $$$\sum_{k=1}^mW_{k}>>(10\times m)$$$, avoids algorithmic
artifacts. Corrections for MRS lineshape contributions unrelated to x will be presented separately.
Conclusion
Two conditions must be met to obtain accurate quantitative descriptors of statistical distributions of measurement parameter x, based on an MRS peak whose chemical shift is a function of x: (1) the algorithm for medians must take into account the fact that spectra-derived data points become centers of histogram bins; and (2) the weight of the individual bins must be proportionally scaled to ensure that the total weight is much larger than $$$10\times $$$ the number of bins. These modifications to classical statistical algorithms permit accurate quantitative characterization of heterogeneity with respect to particular physicochemical parameters in materials such as biological tissue and, consequently, more accurate insights into the underlying physiological processes.Acknowledgements
Support from the Centre National de la Recherche Scientifique, UMR 7339, is greatfully achnowledged.References
1. Juchem C, Merkle H, Schick F, Logothetis NK, Pfeuffer J. Region and volume dependencies in spectral line width assessed by 1H 2D MR chemical shift imaging in the monkey brain at 7 T. Magn. Reson. Imaging 2004;22:1373–1383.
2. Lutz NW, Le Fur Y, Chiche J, Pouyssegur J, Cozzone PJ. Quantitative in-vivo characterization of intracellular and extracellular pH profiles in heterogeneous tumors: a novel method enabling multiparametric pH analysis. Cancer Res 2013;73:4616–4628.
3. Lutz NW, Bernard M. Multiparametric quantification of thermal heterogeneity within aqueous materials by water 1H NMR spectroscopy: paradigms and algorithms. PLOS ONE 2017;12:e0178431.
Figures
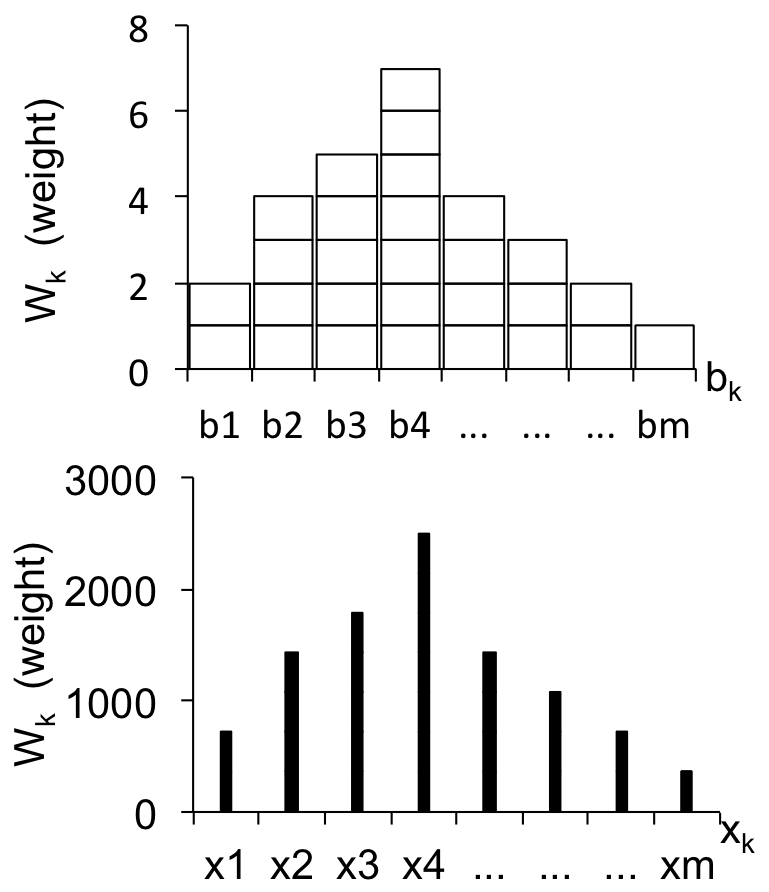
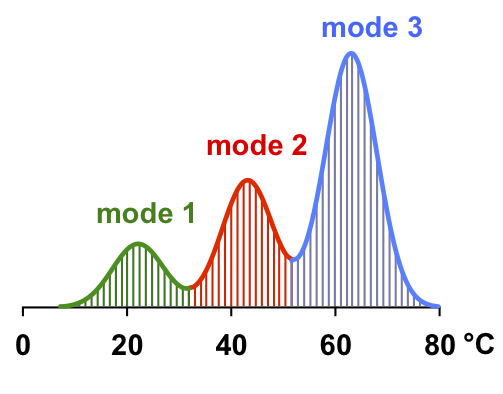
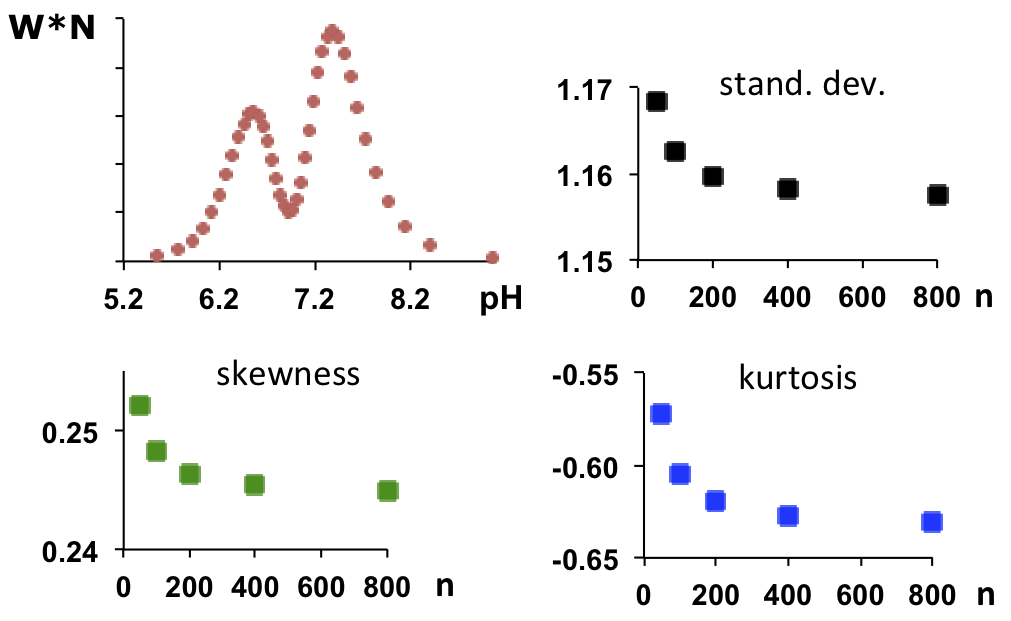
Fig. 3. Top left: Experimentally measured pH distribution curve from a phantom with two 3-APP solutions at different pH values. The curve was derived from the underlying 31P MRS lineshape (W = raw intensity). Red dots indicate the positions of the digital points directly derived from the corresponding points of the 31P MR spectrum. Large scaling factors (N) result in large Wk and, therefore, large n values (see text). For increasing n, the values for standard deviation, skewness and kurtosis converge toward n-independent values (diagrams top right and bottom).