1331
Multivariate Analysis of Developmental-Dependent Differences in Metabolites in White and Gray Matter: An Ultra-Short TE 1H MRS Study at 3TJack Knight-Scott1
1Radiology, Children's Healthcare of Atlanta, Atlanta, GA, United States
Synopsis
Application of multivariate analysis of variance (MANOVA) to a developmental data set of 1H spectra from white and gray matter brain tissue shows not only significant tissue differences but also significant gender and age differences. By specifically controlling for metabolite correlations, MANOVA results show higher sensitivity and power than individual ANOVAs.
Purpose
To examine developmental differences in brain metabolites in proton magnetic resonance spectroscopy (1H MRS) using multivariate statistical analyses.Methods
All studies were approved by the IRB and performed on a 3T MRI system (Siemens Healthineers, Erlangen, Germany) using a 12-channel head coil. Data was acquired using a 4 ms echo time STEAM sequence, a 12 ms mixing time, 3250 ms repetition time, 7-10 cm3 VOI, 2.5 kHz spectral width, 2048 complex points, and 120 averages. Spectra were collected from the anterior cingulate cortex and the frontal centrum semiovale in three age groups (Figure 1): middle childhood (8-9 yrs, n= 10), preadolescence childhood (12-13 yrs, n=11), and emerging adulthood (17-19 yrs, n=10). A RRAMSC acquisition was employed for metabolite quantification.1 All data were analyzed using a nineteen-metabolite basis set in LCModel.2 Metabolites with average Cramér-Rao lower bounds (CRLBs) greater than 25% were excluded from further analysis. Remaining metabolites were presented as ratios using a combination of lowest correlation. To improve sensitivity and power, ratios were examined in a three-way multivariate analysis of variance (MANOVA) by excluding metabolites with correlations outside the range of 0.20 - 0.80. Validity of MANOVA results were checked through post-hoc three-way ANOVAs of individual ratios. For the MANOVA and individual ANOVAs, the main effects examined were: age group, gender, and tissue type.Results
Employing CRLBs and metabolite correlations criteria, as mentioned above, excluded all but six metabolites. Applying normality and equal variance requirements excluded two more metabolites, resulting in only glutamate (Glu), myo-inositol + glycine (mIno+), total choline (tCho), and total N-acetylaspartate (tNAA) remaining (Table 1). These were represented as ratios: tNAA/Glu and mIno+/tCho (Table 3). Analysis of the two ratios in a three-way MANOVA revealed significant multivariate main effects for age group, gender, and tissue type as well as a significant interaction effect between age group and tissue type (Table 2). While individual ANOVAs showed both ratios significant for all three main effects, the interaction effect was due to the tNAA/Glu ratio.Discussion
As expected, white and gray matter have uniquely distinct metabolite patterns independent of gender or age. Even after paring the metabolite set to only the few ratios that satisfy our strict criteria here, the power to metabolically distinguish white and gray matter is excellent, suggesting tissue type is always spectroscopically distinguishable in healthy brains. (Table 2). With a power of 0.951, age group dependent differences are also readily distinguishable, but with caveats. First, post-hoc analysis shows only differences between adult and children are significant, but not differences between the two groups of children. Second, the analysis suggests that these age group differences are primarily due to changes in white matter. Nonetheless, the high power associated with both effects indicates the potential for establishing developmental reference values for inter-institutional comparisons. In contrast, neither gender nor the interaction of age group and tissue type reach the power of 0.8 necessary for individual assessments, but at 0.75 are likely useful for group analyses. Gender differences are particularly intriguing in that such differences are rarely spectroscopically detectable. Here, the effect is significant for both metabolite ratios. Overall, power and significance are lower for individual ANOVAs compared to the MANOVA. In fact, additional post-hoc analyses (data not shown) examining gender differences independently for each tissue type are not significant, suggesting the combination of white and gray matter might be necessary to detect these effects. Furthermore, examination of metabolite correlation in each tissue type independently reveals a much different correlation pattern. Thus, a different set of metabolites might be needed when studies are restricted to just one tissue type or possibly a different region.Conclusion
Careful application of MANOVA can improve detection of metabolite differences.Acknowledgements
No acknowledgement found.References
- Knight-Scott J, Dunham SA, Shanbhag DD. Increasing the speed of relaxometry-based compartmental analysis experiments in STEAM spectroscopy. J Magn Reson 2005;173:169–174.
- Provencher SW. Estimation of metabolite concentrations from localized in vivo proton NMR spectra. Magn Reson Med 1993;30:672–679.
Figures
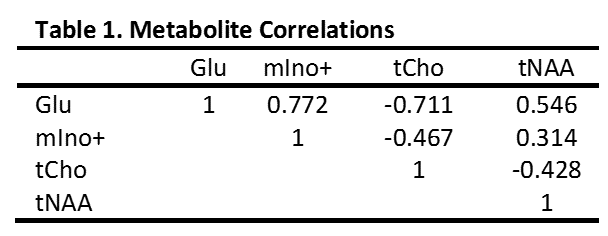
Table 1
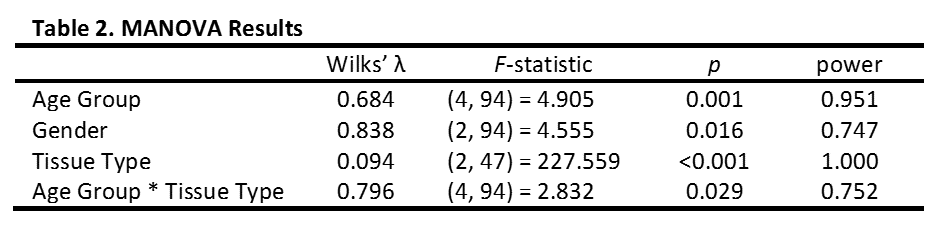
Table 2
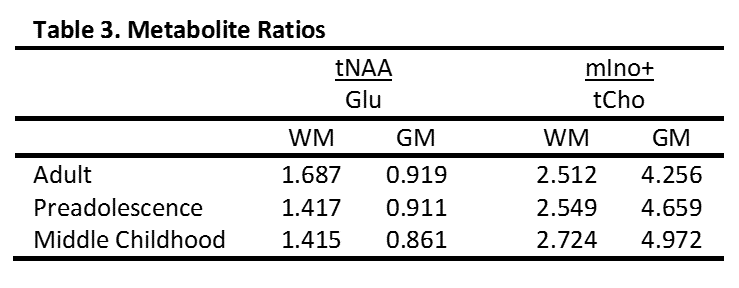
Table 3
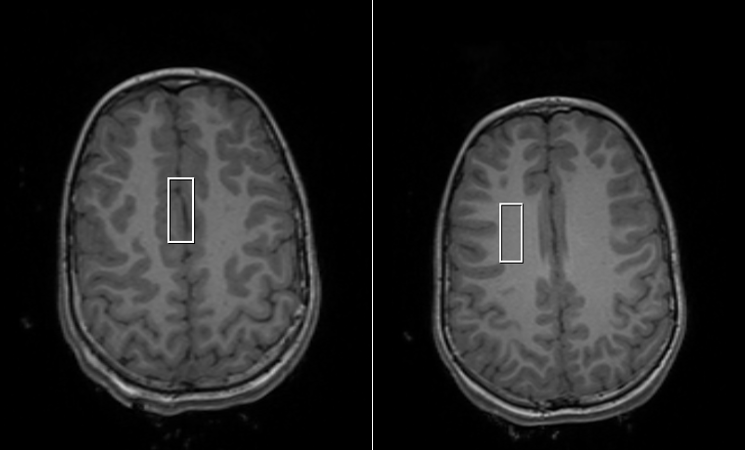
Figure 1. Representative voxel placement for gray and white matter.