1330
Estimation of T2 Relaxation Times of Downfield Peaks in Human Brain at 9.4 T1Max Planck Institute for Biological Cybernetics, Tuebingen, Germany, 2Institute for Biomedical Engineering, UZH and ETH Zurich, Zurich, Switzerland, 3Depts. Radiology and Biomedical Research, University of Bern, Bern, Switzerland, 4Institute of Physics, Ernst-Moritz Arndt University Greifswald, Greifswald, Germany
Synopsis
T2 relaxations times for the downfield metabolites in human brain 1H MR spectra were estimated at 9.4 T. A possible new peak at 8.35 ppm with rapid T2 decay is reported. Due to the use of a non-water suppressed MRS method, the T2 of slowly exchanging peaks could be assessed. The shorter T2 relaxation times in the downfield compared to the upfield spectral areas leads us to suspect a macromolecular contribution, while also exchange effects may contribute to the short apparent T2s.
Purpose
Previous studies demonstrated [1,2,3] that there is valuable additional information in the downfield part of 1H spectra of the human brain; however, it remains largely uncharacterized and unassigned. The aim of this study was to measure the T2 relaxation times of the downfield peaks at 9.4 T including that of exchangeable peaks, which would aid to better characterize the downfield area and peak assignment. This could be of great interest to both the MR Spectroscopy and the Chemical Exchange Saturation Transfer (CEST) communities.Methods
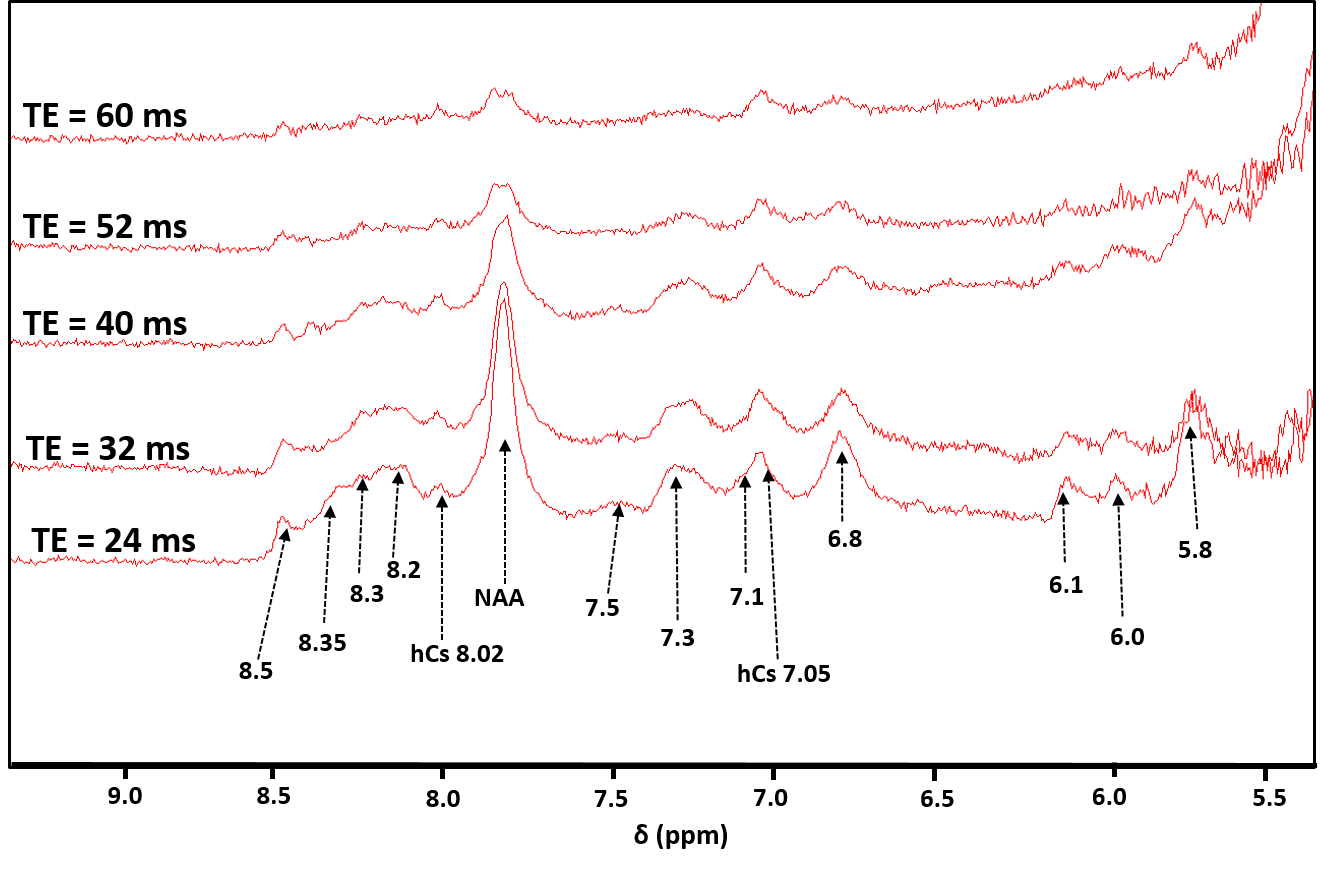
The measurements were performed on a Siemens 9.4 T whole-body MRI scanner (Erlangen, Germany) using a home-built proton coil with 8-transmit and 16-receive channels [4]. Six healthy volunteers participated in the study after informed signed consent as approved by the local ethics board. A voxel (2x2x2 cm3) was chosen in the occipital lobe with mixed gray and white matter content. B0 shimming was performed using FASTESTMAP [5] and voxel-based power calibration was done [6]. An echo-time (TE) series (TE= 24, 32, 40, 52, 60 ms) was acquired using the non-water suppressed metabolite-cycled (MC)-semi-LASER sequence [7] (TR 6000 ms, 96 averages per TE). The RF frequency was centered in the downfield region at 7.3 ppm. The spectra from different volunteers were averaged for each TE response individually and the TE series was modeled using FitAID [8] with 14 narrow peaks and 4 broad line-shape components. All the components were modeled based on offset from [1]. The NAA peak was modeled in VesPA [9] using a spin echo sequence with ideal pulses for a starting TE = 6.5 ms for the TE series [10]. The averaged spectra were fit individually. Finally, the calculated areas were fit to exponential decays to retrieve T2 value estimates.Results
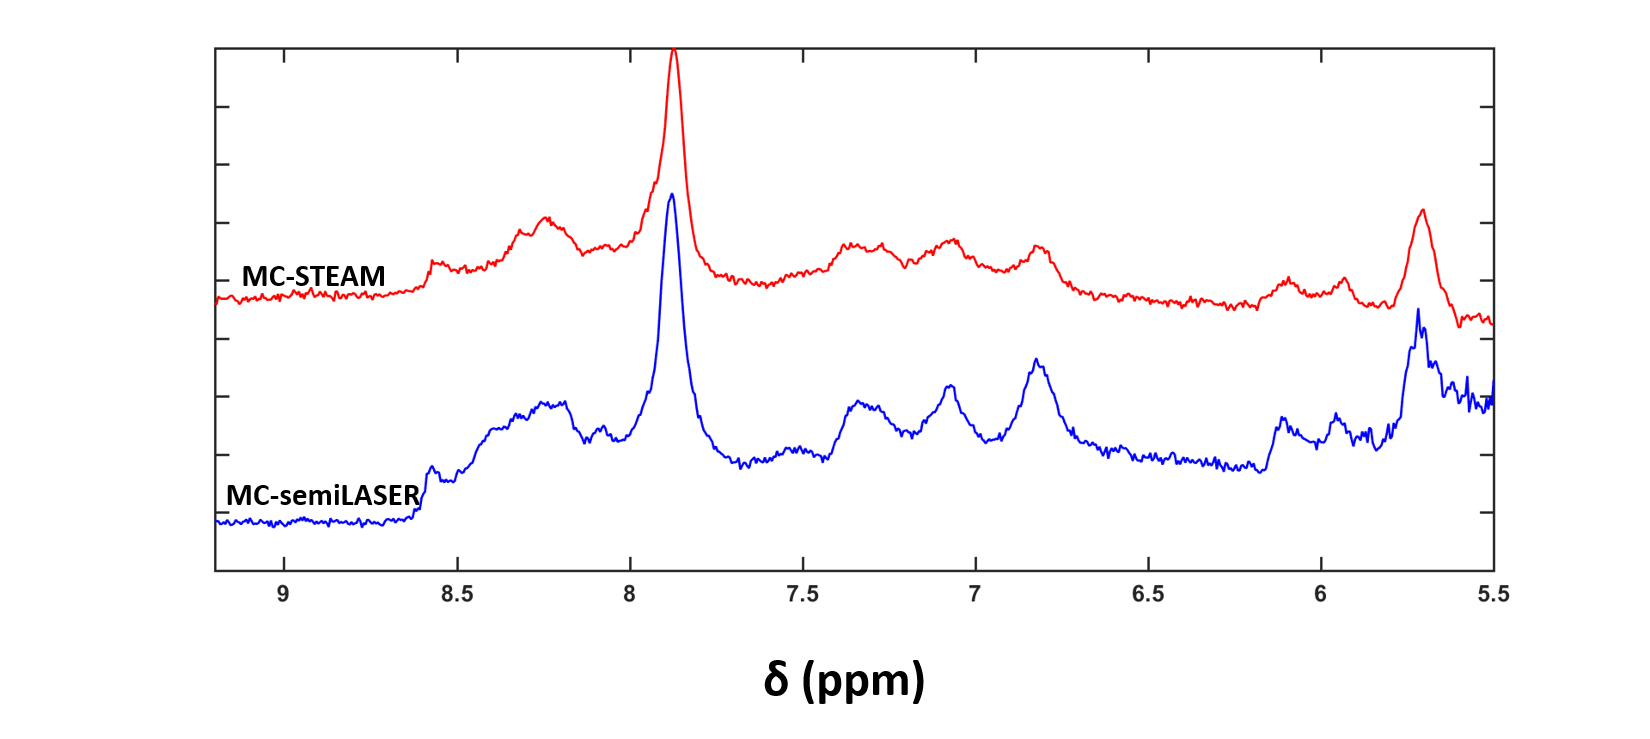
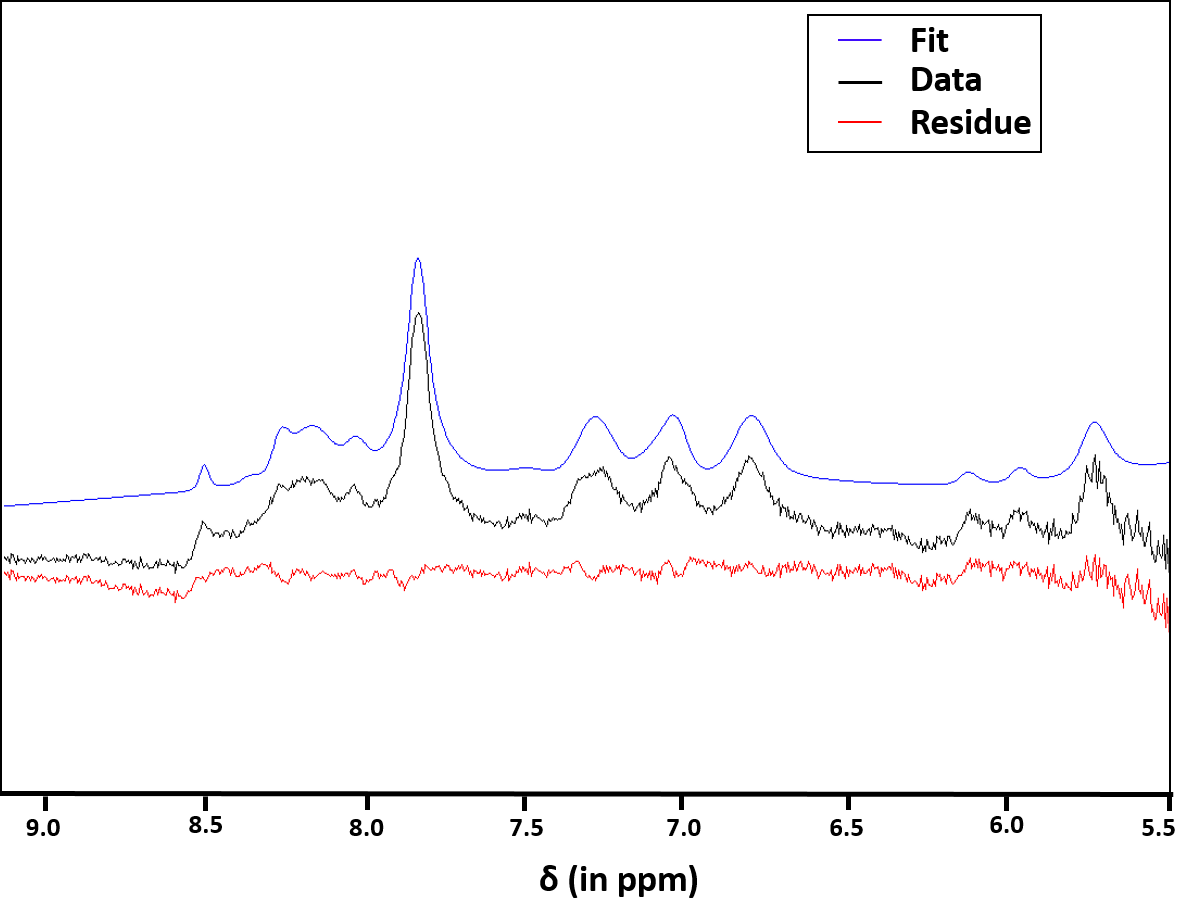
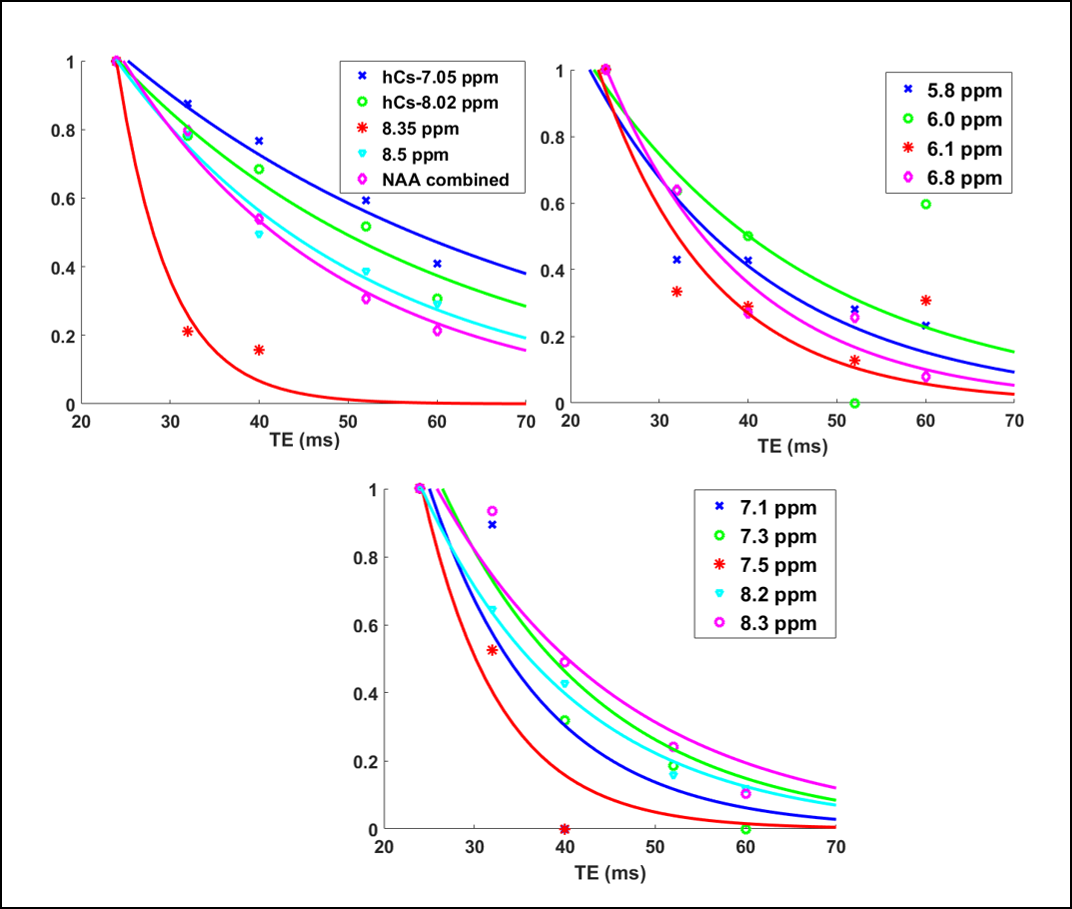
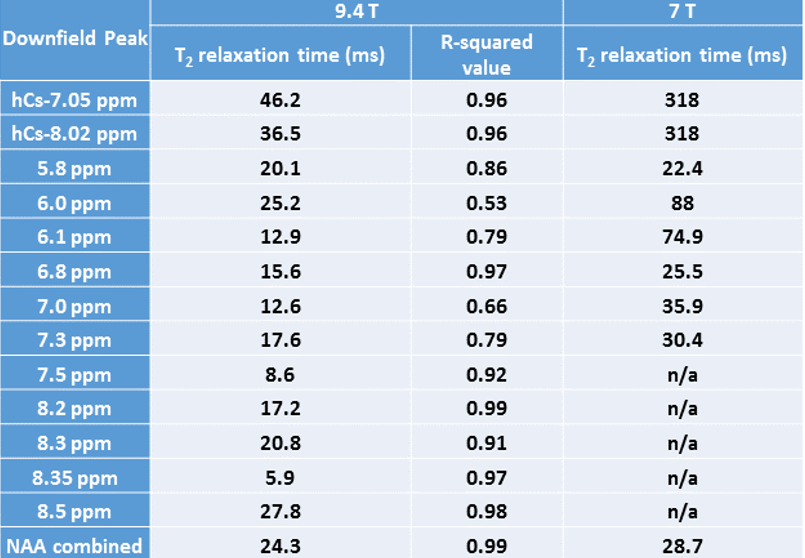
The decaying summed signal with increasing TE can be seen in Fig.1. The modeled peaks are indicated. In Fig.2, there is an additional broad peak at 8.35 ppm when compared to the MC-STEAM spectra acquired at 9.4 T previously [1]. The selected basis set models the spectra well, as indicated from the mostly flat fit residue (Fig.3). All modeled metabolites could be fit with an exponential decay function (Fig.4). Based on this exponential model, the T2 relaxation times and the R2 values of the fit are reported in Table 1.Discussion
This work gives an estimate of the T2 relaxation times of the downfield peaks at 9.4 T. The use of a non-water suppressed MRS method allowed assessment of the T2 relaxation times for exchangeable peaks [3]. The appearance of the peak at 8.35 ppm (Fig. 2) in the downfield human brain spectra is observed for the first time, potentially due to the spin-lock effect [11, 12] during the adiabatic pulses in MC-semiLASER or less exchange-sensitivity compared to the MC-STEAM sequence from [1]. Since this possible peak was estimated to have a very short T2 relaxation time of 5.9 ms (Table 1), we see it prominently for TE = 24 ms which is equivalent to a non-adiabatic spin-echo sequence of TE = 6.5 ms [10]. A tentative splitting of ~15 Hz is seen for the peak at 7.82 ppm when TE = 52-60 ms whereas the coupling constant of the NAA-NH group is 6.4 Hz [13]. A splitting at 7.82 ppm was reported also in [14]. Hence, a further investigation of high SNR spectra recorded at TE of 52 ms is required to fully understand the splitting at 7.82 ppm and distinguish possible other contributions. The correction for a T1-weighting bias [15] in the calculated T2 values is neglected as TR > ~8 T1, considering the T1 values reported in [1]. The apparent B0 dependency effects [16,17] are seen in the T2 values at 9.4 T when compared to the reported T2 values for the downfield peaks at 7 T in [2] . The T2 relaxation times in the downfield have values shorter than the values in the upfield [18], which lets us suspect macromolecular contributions in the downfield part as mentioned in [2,19], in addition to the exchange effects [1]. Further detailed exploration of the downfield range with more volunteers, individual volunteer-wise fitting and careful adjustment of first-order phase for finer results will be performed in the future.Acknowledgements
This work was supported by the Horizon 2020 CDS-QUAMRI grant. The authors thank Johanna Dorst and Loreen Ruhm from Max Planck Institute for Biological Cybernetics, Tuebingen, for their help in this work.References
1. Fichtner, N.D., et al., In vivo characterization of the downfield part of 1H MR spectra of human brain at 9.4 T: Magnetization exchange with water and relation to conventionally determined metabolite content. Magnetic Resonance in Medicine, 2017.
2. Fichtner, N.D., et al., Elucidation of the downfield spectrum of human brain at 7 T using multiple inversion recovery delays and echo times. Magnetic resonance in medicine, 2017. 78(1): p. 11-19.
3. MacMillan EL, Chong DG, Dreher W, Henning A, Boesch C, Kreis R. Magnetization exchange with water and T1 relaxation of the downfield resonances in human brain spectra at 3.0 T. Magnetic resonance in medicine, 2011 May 1;65(5):1239-46.
4. Avdievich N, Giapitzakis IA, Henning A. Optimization of the receive performance of a tight-fit reansceiver phased array for human brainimaging at 9.4T. In Proceedings of the 25th Annual Meeting of ISMRM, Honolulu, Hawai’i, USA, 2017. p. 2575.
5. Gruetter, R. and I. Tkáč, Field mapping without reference scan using asymmetric echo‐planar techniques. Magnetic resonance in medicine, 2000; 43(2): p. 319-323.
6. Versluis MJ, Kan HE, van Buchem MA, Webb AG. Improved signal to noise in proton spectroscopy of the human calf muscle at 7 T using localized B1 calibration. Magnetic resonance in medicine, 2010;63:207–211.
7. Giapitzakis, I.A., et al., Metabolite‐cycled STEAM and semi‐LASER localization for MR spectroscopy of the human brain at 9.4 T. Magnetic Resonance in Medicine, 2017.
8. Chong, D.G., et al., Two-dimensional linear-combination model fitting of magnetic resonance spectra to define the macromolecule baseline using FiTAID, a Fitting Tool for Arrays of Interrelated Datasets. Magnetic Resonance Materials in Physics, Biology and Medicine, 2011. 24(3): p. 147-164
9. Soher B, Semanchuk P, Todd D, Steinberg J, Young K. VeSPA: integrated applications for RF pulse design, spectral simulation and MRS data analysis. In Proceedings of the 19th Meeting of ISMRM, Montreal, Quebec, Canada, 2011. p 1410.
10. Giapitzakis IA, Henning A. Basis set optimization for quantification of semi-LASER at 9.4T under consideration of CP effect and relaxation. 25th Annual Meeting and Exhibition of ISMRM, Honolulu, Hawaii, 2017.
11. Allerhand A, Thiele E. Analysis of Carr—Purcell Spin-Echo NMR Experiments on Multiple-Spin Systems. II. The Effect of Chemical Exchange. The Journal of Chemical Physics 1966; 45:902-916.
12. Scheenen TW, Klomp DW, Wijnen JP, Heerschap A. Short echo time 1H-MRSI of the human brain at 3T with minimal chemical shift displacement errors using adiabatic refocusing pulses. Magnetic Resonance in Medicine, 2008;59:1-6.
13. Govindaraju V, Young , Maudsley AA. Proton NMR chemical shifts and coupling constants for brain metabolites. NMR Biomed. 2000; 13(3):129-53.
14. Murali Manohar SV, Giapitzakis IA, Borbáth T, Gaertner M and Henning A. Qualitative Comparison between In Vivo J-Resolved Semi-LASER at 3 T and 9.4 T. 25th Annual Meeting and Exhibition of the International Society for Magnetic Resonance in Medicine (ISMRM 2017), Honolulu, HI, USA
15. Fleysher R, Fleysher L, Kirov I, Hess DA, Liu S, Gonen O. Retrospective correction for T 1-weighting bias in T 2 values obtained with various spectroscopic spin-echo acquisition schemes. Magnetic resonance imaging. 2009 Dec 31;27(10):1410-9.
16. Henning A, Fuchs A, Boesch C, Boesiger P, Kreis R. Downfield Spectra at Ultrahigh Field. In Proceedings of the 16th Annual Meeting of ISMRM, Toronto, Canada, 2008. p. 777.
17. Kreis R, Boesch C, Vermathen P. Characterization of the Downfield Part of the Human Cerebral 1H MR Spectrum at 3 T. In Proceedings of the 14th Annual Meeting of ISMRM, Seattle, Washington, USA, 2006. p. 2636.
18. Deelchand DK, Van de Moortele PF, Adriany G, Iltis I, Andersen P, Strupp JP, Vaughan JT, Uğurbil K, Henry PG. In vivo 1 H NMR spectroscopy of the human brain at 9.4 T: initial results. J Magn Reson. 2010; 206(1):74-80.
19. Zhou J, Payen JF, Wilson DA, Traystman RJ, van Zijl PC. Using the amide proton signals of intracellular proteins and peptides to detect pH effects in MRI. Nature medicine. 2003 Aug 1; 9(8):1085-90.
20. Deelchand DK, Henry PG, Marjańska M. Effect of carr‐purcell refocusing pulse trains on transverse relaxation times of metabolites in rat brain at 9.4 Tesla. Magnetic Resonance in Medicine, 2015; 73(1):13-20.
Figures