1329
MRF in Single Voxel Spectroscopy: Signal to Noise Ratio or Dictionary Length - Which is more important?1Weizmann Institute of Science, Rehovot, Israel
Synopsis
We use MR spectroscopic fingerprinting (MRSF) to quantify T1,T2 and concentration addressing the tradeoff between fingerprint lengths and averaging. Methods. MRSF using 25, 50 and 100 fingerprint lengths were compered to inversion recovery (IR) and multi-TE using Monte-Carlo simulations and in-vivo experiments. Bias and variance were estimated for NAA, Creatine and Choline. Results. Simulations of all MRSF sequences show better accuracy and bias over IR. In-vivo experiments show improved T1 and concentration estimation. Conclusion. The low SNR emphasizes the tradeoff between fingerprint length and averaging. The In-vivo results show clear advantage using shorter fingerprint and increasing the SNR.
Target Audience.
Clinicians and basic scientists interested in quantitative spectroscopy.
Purpose.
Brain metabolite concentrations and relaxation parameters (T1 and T2) can change in various pathologies. Not only do such changes carry diagnostic value [1], but accurate per-subject knowledge of T1, T2, and transmit inhomogeneity (B1+) is necessary for accurate quantification. MR spectroscopic fingerprinting (MRSF) can be used to simultaneously quantify metabolite concentrations, T1, T2 and B1+ values [2,3]. Our aim here was to address the question of the tradeoffs between schedule length and number of averages for a fixed acquisition time (i.e. between T1, T2, B1+ encoding on the one hand and SNR on the other).Methods.
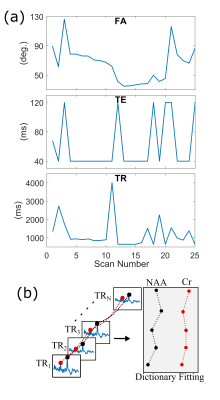
Sequence & dictionary: A point-resolved spectroscopy (PRESS) sequence was adapted to the fingerprinting framework by varying the excitation flip angle (FA) of the first pulse echo time (TE) and repetition time (TR) between N=25 (Fig. 1), 50 and 100 consecutive excitations, with TA=30,60 and 120 seconds respectively. The FA, TE and TR were optimized for to yield minimum correlation between different dictionary entries [4] for every excitation set (25, 50 and 100). Dictionary entries were created for non J-coupled singlets, solving the Bloch equations using the full time-dependent pulse waveforms on a 3D spatial distribution of 80×15×15 spins. The dictionary was generated “on-the-fly” during an iterative fitting process due to prohibitive computational costs of pre-generating the entire dictionary (≈2 sec/entry). Monte-Carlo simulations: Three different dictionary length MRSF sequences were compared to inversion recovery (IR) and multi-TE experiment. MRSF dictionary length were 25, 50 and 100, trading sequence length for averaging (gain in SNR) in the shorter sequences. Inversion recovery with inversion times TI=250, 1000, 5000ms was fitted to S(TI)=A·(1-B·exp(-TI/T1)). Multi-TE experiment with TE=40 and 160 ms was simulated and fitted to two-parameter equation S(TE)=A·exp(-TE/T2). The same SNR per unit time was used for all methods. NMC=300 repetitions were used to estimate all methods’ bias, variance and root mean square error (RMSE) in estimating T1 and T2 using SNR=20 per full excitation (at FA=90°). In-vivo experiments: 3 subjects (IRB approved) were scanned twice. 4.5 ml voxel was positioned in mostly white matter region (Fig. 3a). Two MRSF sequences (MRSF-25 and MRSF-50) were used to estimate T1, T2 and B1+ via dictionary fitting for NAA, Cho and Cr. Concentrations were estimated by summing all excitations and averages, corrected by dividing by the sum of the fitted dictionary entry, and then normalized using the single-average reference water scan. For comparison, IR (TE/TE=8000/40) was used for T1 estimation and a multi-TE experiment (TR/TE=1500/40,160 ms) was used to estimate T2 similar to the Monte-Carlo simulations. The scan time was constant at a total of 6 min. Concentrations were estimated using the TI=5000 measurement and a single average reference water scan. Standard deviation for all experiments were calculated from the scan re-scan measurements.Results.
Monte Carlo Simulations: All MRSF sequences show better accuracy and bias over IR for a range of T1 values (Fig. 2). T2 estimations showed comparable results for all methods. In-vivo Experiments: Fig. 3b shows an experimental MRSF-25 curve for NAA and its fitted dictionary entry. Averaged over all metabolites and subjects, T1 relative standard deviation was 8.1%, 19% and 8.6% for MRSF-25, MRSF-50 and IR respectively (Fig 3c). T2 relative standard deviation was 11.4%, 32.2% and 8.6% for MRSF-25, MRSF-50 and multi-TE respectively (Fig 3c). Concentrations were estimated for MRSF-25 and IR, the relative average standard deviation was 3.5% for MRSF-25 and 4.6% for the conventional methods, average over all metabolites (Fig 3d).Discussion.
Single voxel MRSF is capable estimating T1, T2, B1+ as well as concentration, using the full acquisition time to estimate all parameters. The low SNR presents a unique challenge for MRF and adds an emphasis to the tradeoff between fingerprint length VS SNR (averaging). The In-vivo results show clear advantage for using a shorter fingerprint and increasing the SNR in the spectral domain. Future challenges include the expansion of the model to J-coupled resonances, which would require incorporation of full quantum mechanical simulations with relaxation.Conclusion.
Our preliminary results show MRSF can quantify T1 with superior bias (accuracy) and variance (precision) to conventional IR based alternatives. MRSF T2 quantification is equivalent to standard multi-TE approach. The improvement in T1 estimation as well as the ability to use the full acquisition time provides MRSF advantage in concentration estimation over conventional methods as was demonstrated in the in-vivo results.Acknowledgements
No acknowledgement found.References
[1] II Kirov et al, Radiology 254(3):858-866 (2010);
[2] D Ma et al, Nature 495:187-192 (2013);
[3] Tal A, Proc Intl Soc Magn Reson Med 24:0025, Singapore (2016);
[4] O Cohen and MS Rosen, Magn Reson Imag, http://dx.doi.org/10.1016/j.mri.2017.02.010 (2017)
Figures


