1327
How does inclusion of different macromolecular baseline models affect reproducibility of 1H-FID MRSI in the brain at 7T?1High Field MR Centre, Department of Biomedical Imaging and Image-guided Therapy, Medical University of Vienna, Vienna, Austria, 2Hamm-Lippstadt University of Applied Sciences, Hamm, Germany, 3Russell H. Morgan Department of Radiology and Radiological Science, The Johns Hopkins University School of Medicine, Baltimore, MD, United States, 4F. M. Kirby Research Center for Functional Brain Imaging, Kennedy Krieger Institute, Baltimore, MD, United States, 5Athinoula A. Martinos Center for Biomedical Imaging, Department of Radiology, Massachusetts General Hospital, Harvard Medical School, Boston, MA, United States, 6Christian Doppler Laboratory for Clinical Molecular Molecular MR Imaging, Vienna, Austria
Synopsis
The goal was to investigate how the use of different macromolecular baseline models affects both the accuracy and test-retest reproducibility of metabolite quantification for clinically attractive FID-MRSI scan with in-plane resolution of 3.4 x 3.4 mm2 and acquisition time of 5 min. We confirmed that our 1H-FID-MRSI sequence provides information about abundance and spatial distribution of several neurometabolites with high accuracy. Including the information about the macromolecular background into the quantification process does not decrease its reproducibility.
Purpose
Magnetic resonance spectroscopic imaging (MRSI) combines information about brain anatomy with biochemical background of tissues. MRSI especially benefits from ultra-high field strength (i.e., 7T), as the spatial and spectral resolution improve significantly. However, at such high field strengths the T2 relaxation times and hence the SNR of detectable neurometabolites decrease drastically. To maximize the number of detectable compounds, FID-based MRSI with only negligible acquisition delay was proposed[1]. While this improves the detectability of neurometabolites such as N-acetyl aspartate,Choline,Creatine,Myo-inositol, Glutamate,Glutamine or Glutathione, FID-MRSI also enhances the background signal of macromolecules (MM). This poses challenges for accurate metabolite quantification in the presence of strong MM resonances[2]. Therefore, it is mandatory to include MMs into the fitting model appropriately[3,4]. Several approaches have been proposed including the entire MM baseline as a single component[2] or adding several parameterized MM components to stay flexible in the presence of pathological changes[3]. Both these approaches were evaluated for fairly high SNR (hence long scan times) and although the accuracy for metabolite quantification was investigated, the effects on reproducibility were only indirectly assessed via CRLBs.
Therefore, we wanted to investigate, how the use different MM baseline models or rather skipping MMs for quantification affect both the accuracy and test-retest reproducibility of metabolite quantification for clinically attractive FID-MRSI protocols.
Methods
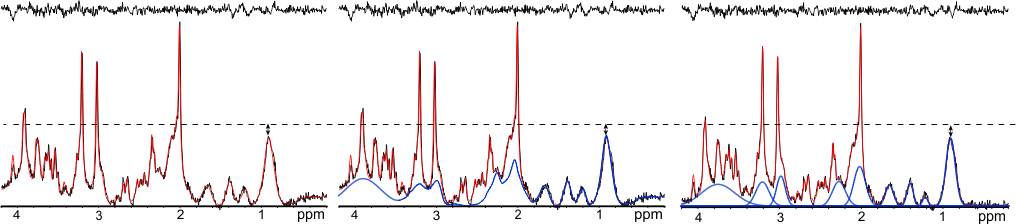
Ten volunteers (7M/3F, 28±4y) were scanned twice in separate sessions with a Siemens 7T whole-body MR scanner and a 32-channel head coil. A 1H-FID-MRSI sequence[1] with TE/TR, 1.3/600ms; matrix size, 64x64; nominal voxel volume, 3.4x3.4x8mm3; 1024 spectral points, 6kHz bandwidth, 2D-CAIPIRINHA[5] acceleration with ~5 min scan time was measured in transverse plane above the ventricles. Auto-align ensured reproducible slice positioning between test-retest measurements[6]. Data were processed with in-house developed software employing LCModel, MATLAB, Bash and MINC and were evaluated with SPSS. Three different basis sets were used for LCModel quantification: i) without any MM spectrum included –“no_MM”; ii) with a single measured MM spectrum included –“full_MM”; iii) with nine individual MM components included, but with soft constraints[4] –“parameterized_MM”(Figure 1). Test-retest reproducibility for metabolite levels and their ratios was assessed within two ROIs: in frontal white matter (ROI1) and in parietal white matter (ROI2). Spectral quality measures (SNR, linewidth), fitting quality (CRLBs), coefficients of variation(CV), intra-class correlation coefficients(ICC) and Bland-Altman statistics were obtained.Results
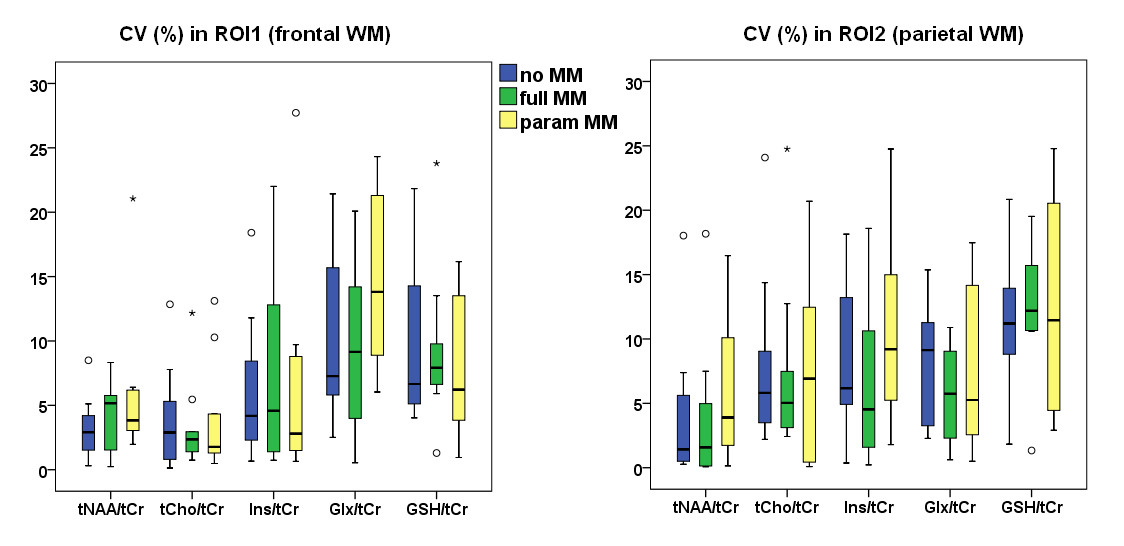
We found low CV and high ICC for five metabolic ratios (tNAA/tCr, tCho/tCr, Ins/tCr, Glx/tCr, GSH/tCr) when using the “no_MM” basis set. The CVs varied between 3.0-9.5% and ICCs between 0.694-0.95. Within the ROIs the mean SNR was 7.1 and CRLBs varied between 3.8-12.9%.
Quantification with the “full_MM” basis set similarly revealed highly reproducible quantification accuracy with CVs varying between 2.8-9.3% and ICC between 0.678-0.954 for the same metabolic ratios. In ROIs the mean SNR was 7 and CRLBs in a range of 4.2-13.2%.
Finally,
quantification using the “parameterized_MM”
basis set also provided reproducible results for the majority of the metabolic
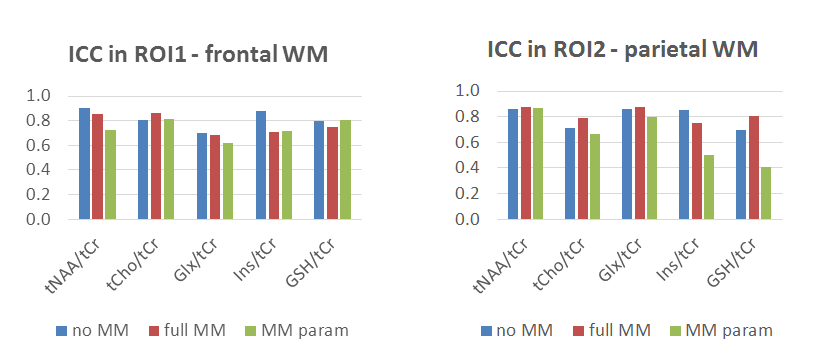
ratios (ICC 0.616-0.977 and CV 3.7-10.2%). Only quantification of J-coupled
resonances (e.g.,GSH or Glx) in parietal region was biased by the presence of
MM components in the basis set (ICCs: 0.409 for GSH/tCr, 0.469 for Glx/tCr). The
mean SNR was 6.1 and CRLBs in a range of 5-16%. Results are summarized in
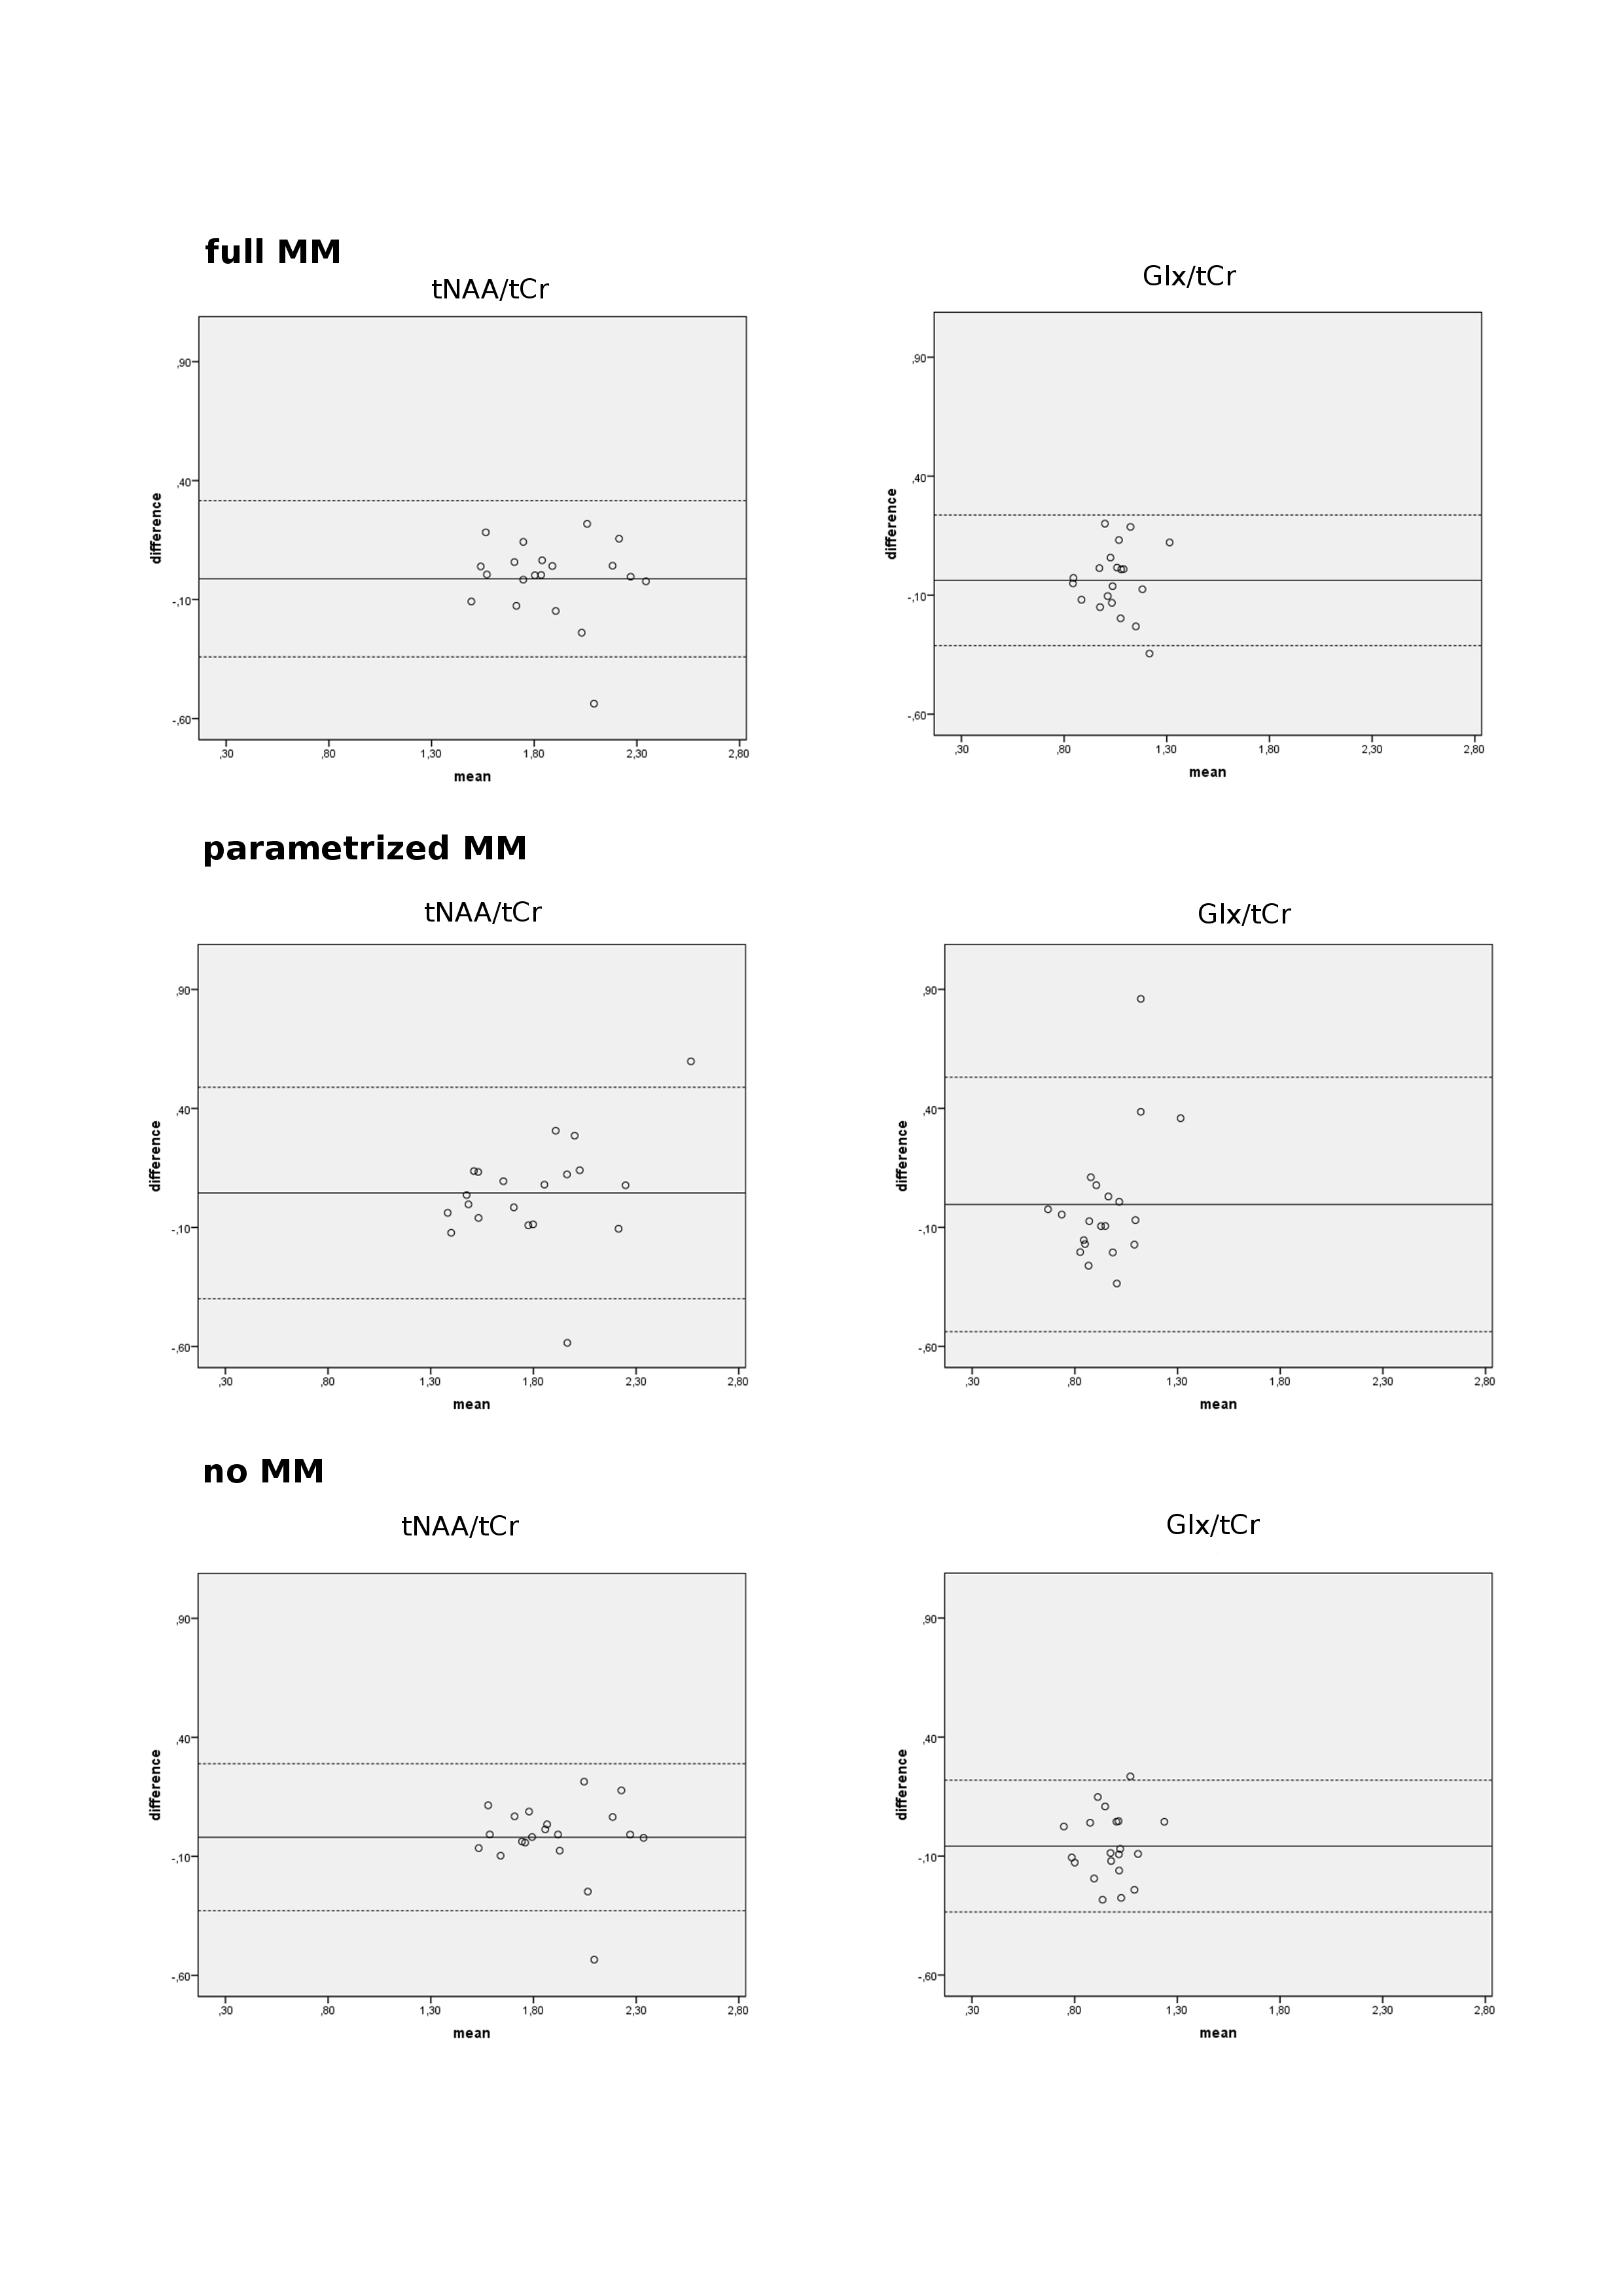
Figure 2 and 3. Bland-Altman plots of
test-retest reproducibility for tNAA/tCr and Glx/tCr are displayed in Figure 4.
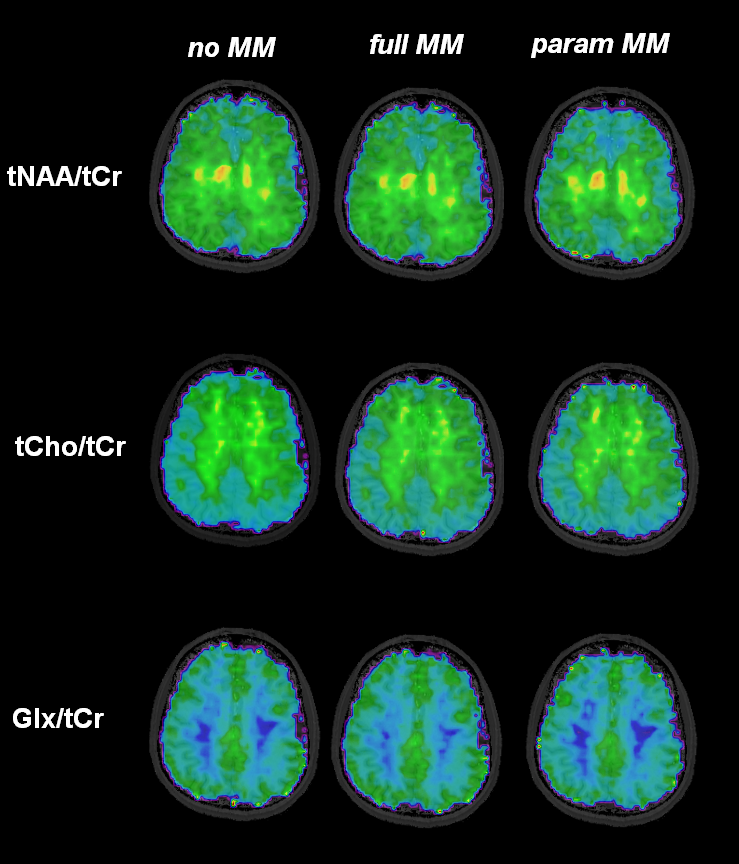
Figure 5 shows representative metabolic maps.
Discussion
Based on CVs and ICCs we confirmed that our 1H-FID-MRSI sequence provides information about abundance and spatial distribution of several neurometabolites with high accuracy and reproducibility in only ~5min. Including the information about the macromolecular background into the quantification process either via a “full_MM” or “paramterized_MM” basis sets did not significantly decrease the reproducibility of most metabolite ratios. This confirms earlier reports that were performed with much higher SNR and longer scan times of ~30min[2,3]. Yet, the slightly increased variability introduced into quantification by separate fitting of parameterized MM resonances can become a problem for lower abundant J-coupled metabolites when SNR is low. This must be taken into account when MM levels themselves are of interest. In that case SNR and consequently quantification accuracy can be improved, e.g. by increasing the acquisition time. So far we have only completed the evaluation of a single MRSI slice. However, the full study included acquisition of four transversal slices at different levels of the brain, which will provide a more complete picture of the current clinical feasibility of 7T FID-MRSI.Conclusion
Clinically attractive 7T FID-MRSI with adequate MM prior knowledge provides highly reproducible results for the most common metabolites even when using parameterized MM models.Acknowledgements
This study was supported by the Austrian Science Fund (FWF): KLI 646 and P 30701, and FFG Bridge Early Stage Grant #846505.References
1. Hangel et al., NeuroImage 2016; doi: 10.1016/j.neuroimage.2016.10.043
2. Považan et al., NeuroImage 2015; 1:121:126-135
3. Považan et al. MRM 2017; doi: 10.1002/mrm.26778
4. Penner et al. MRM 2015; 74:4-12
5. Strasser et al., MRM 2016; 78(2):429-440
6. Van der Kouwe et al., NeuroImage 2005; 27:222-230
Figures