1326
Highly Accelerated Simulation of Model Spectra for TE-Averaged Spectral Fitting1National Institute of Mental Health, Bethesda, MD, United States
Synopsis
One-dimensional projection method was applied to the simulation of spatially localized J-resolved magnetic resonance spectroscopy with real RF pulses. As a comparison, the same pulse sequence was simulated using non-localized ideal RF pulses. The resultant TE-averaged spectra of glutamate were compared with phantom experiment at 3T. Conspicuous differences between ideal pulse simulated spectrum and phantom spectrum were found. For vivo comparisons, metabolite quantification was performed with real RF pulse basis set and ideal pulse basis set, respectively. Real RF pulse generated basis set significantly improved the reproducibility of glutamate quantification in vivo.
INTRODUCTION
Quantitative fitting of magnetic resonance spectra requires a series of individual metabolite spectra, known as model spectra or basis set. Traditionally a basis set is obtained using phantom and by scanning individual metabolites separately. A change in pulse sequence parameters or magnetic field strength requires all phantom experiments to be repeated. There is a growing trend of using computer-generated basis set to perform spectral fitting [1-3]. However, three-dimensional simulation of spatially localized MRS spectra has been extremely time-consuming for multi-spin systems. For multi-echo J-resolved experiments [4] the computation load is further increased by 1-2 orders of magnitude. In practice, ideal RF pulses (i.e. without localization) are often used to perform the simulation. This study uses a recently developed fast and highly accurate density matrix simulation technique [5] to compare the differences between the real RF pulse basis set and ideal RF pulse basis set as they are applied to quantifying the TE-averaged spectra [4].METHODS
The recently developed fast density matrix simulation technique projects a three-dimensional voxel onto three one-dimensional spaces and hence increases the computation efficiency by several orders of magnitude [5]. A single voxel was selected using point-resolved spectroscopy (PRESS) at 3 Tesla. The voxel was digitized by 80×60×60 spatial points that were equally spaced in the voxel region. The bandwidths of the excitation and refocusing RF pulses were 2200 Hz and 1200 Hz, respectively. The TE-averaged spectrum had 32 echoes with the echo time (TE) increased by 6 ms after each echo, starting at 35 ms. Eighteen metabolites were simulated to create the basis set. A phantom of 50 mM glutamate was used to verify the simulation results. Both phantom and in vivo data were acquired using a GE 3 T scanner with the same PRESS pulse sequence. Ten subjects were recruited for reproducibility test. Each subject was scanned twice in two different sessions. The voxel was placed in the anterior cingulate cortex, with a volume of 2.0 × 2.0 × 4.5 cm3. The data fitting software was developed in-house. The quantification factored in the tissue fractions of gray matter, white matter, and CSF as well as magnetization relaxation time T2s. Both TE-averaged spectra (J =0) and the cross section of J = 7.5 Hz [6] were quantified using simulated basis sets. The quantification process was executed automatically without user intervention.RESULTS
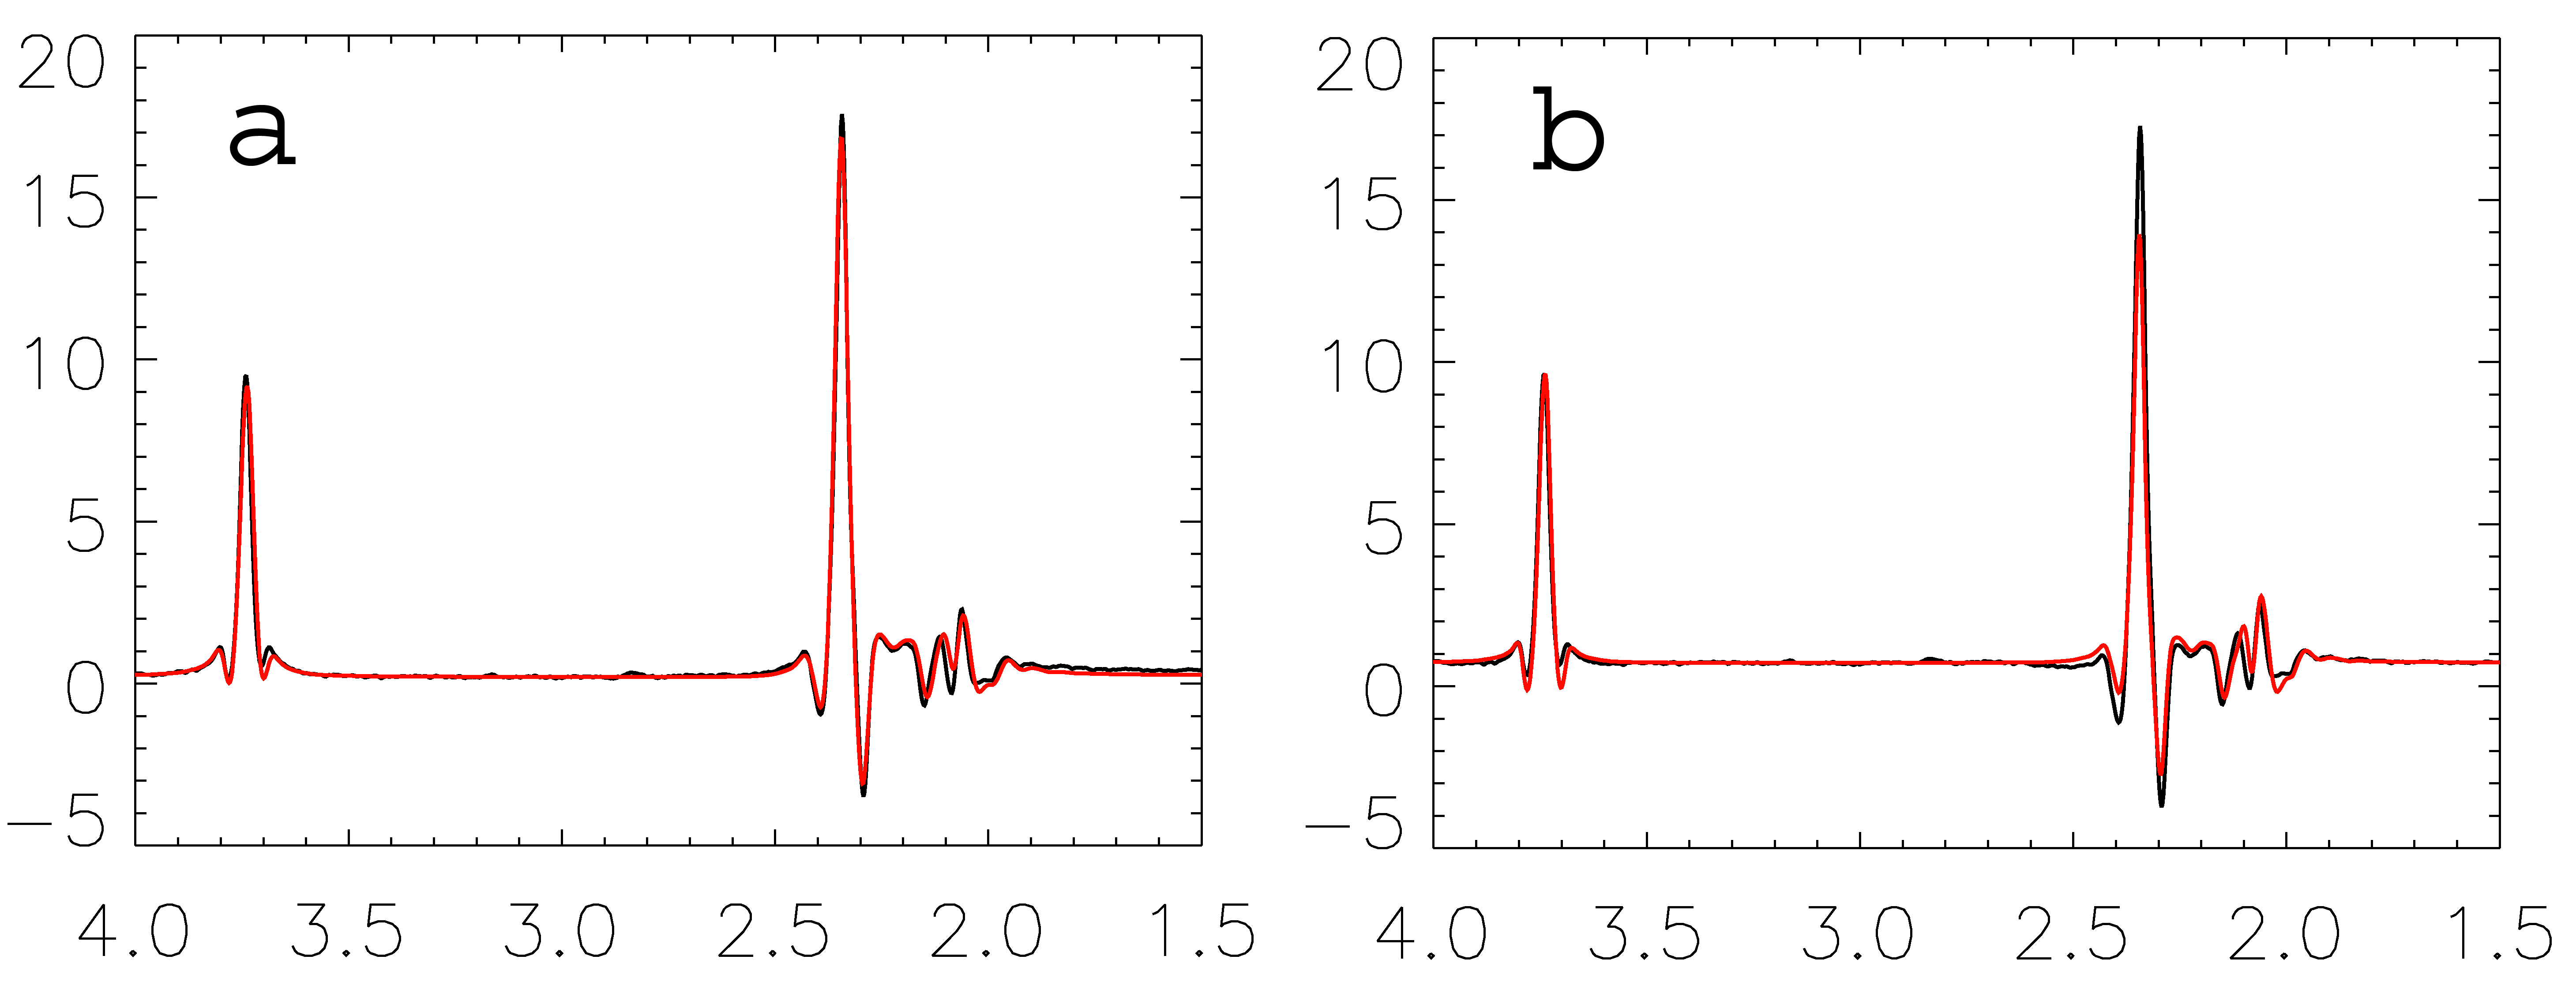
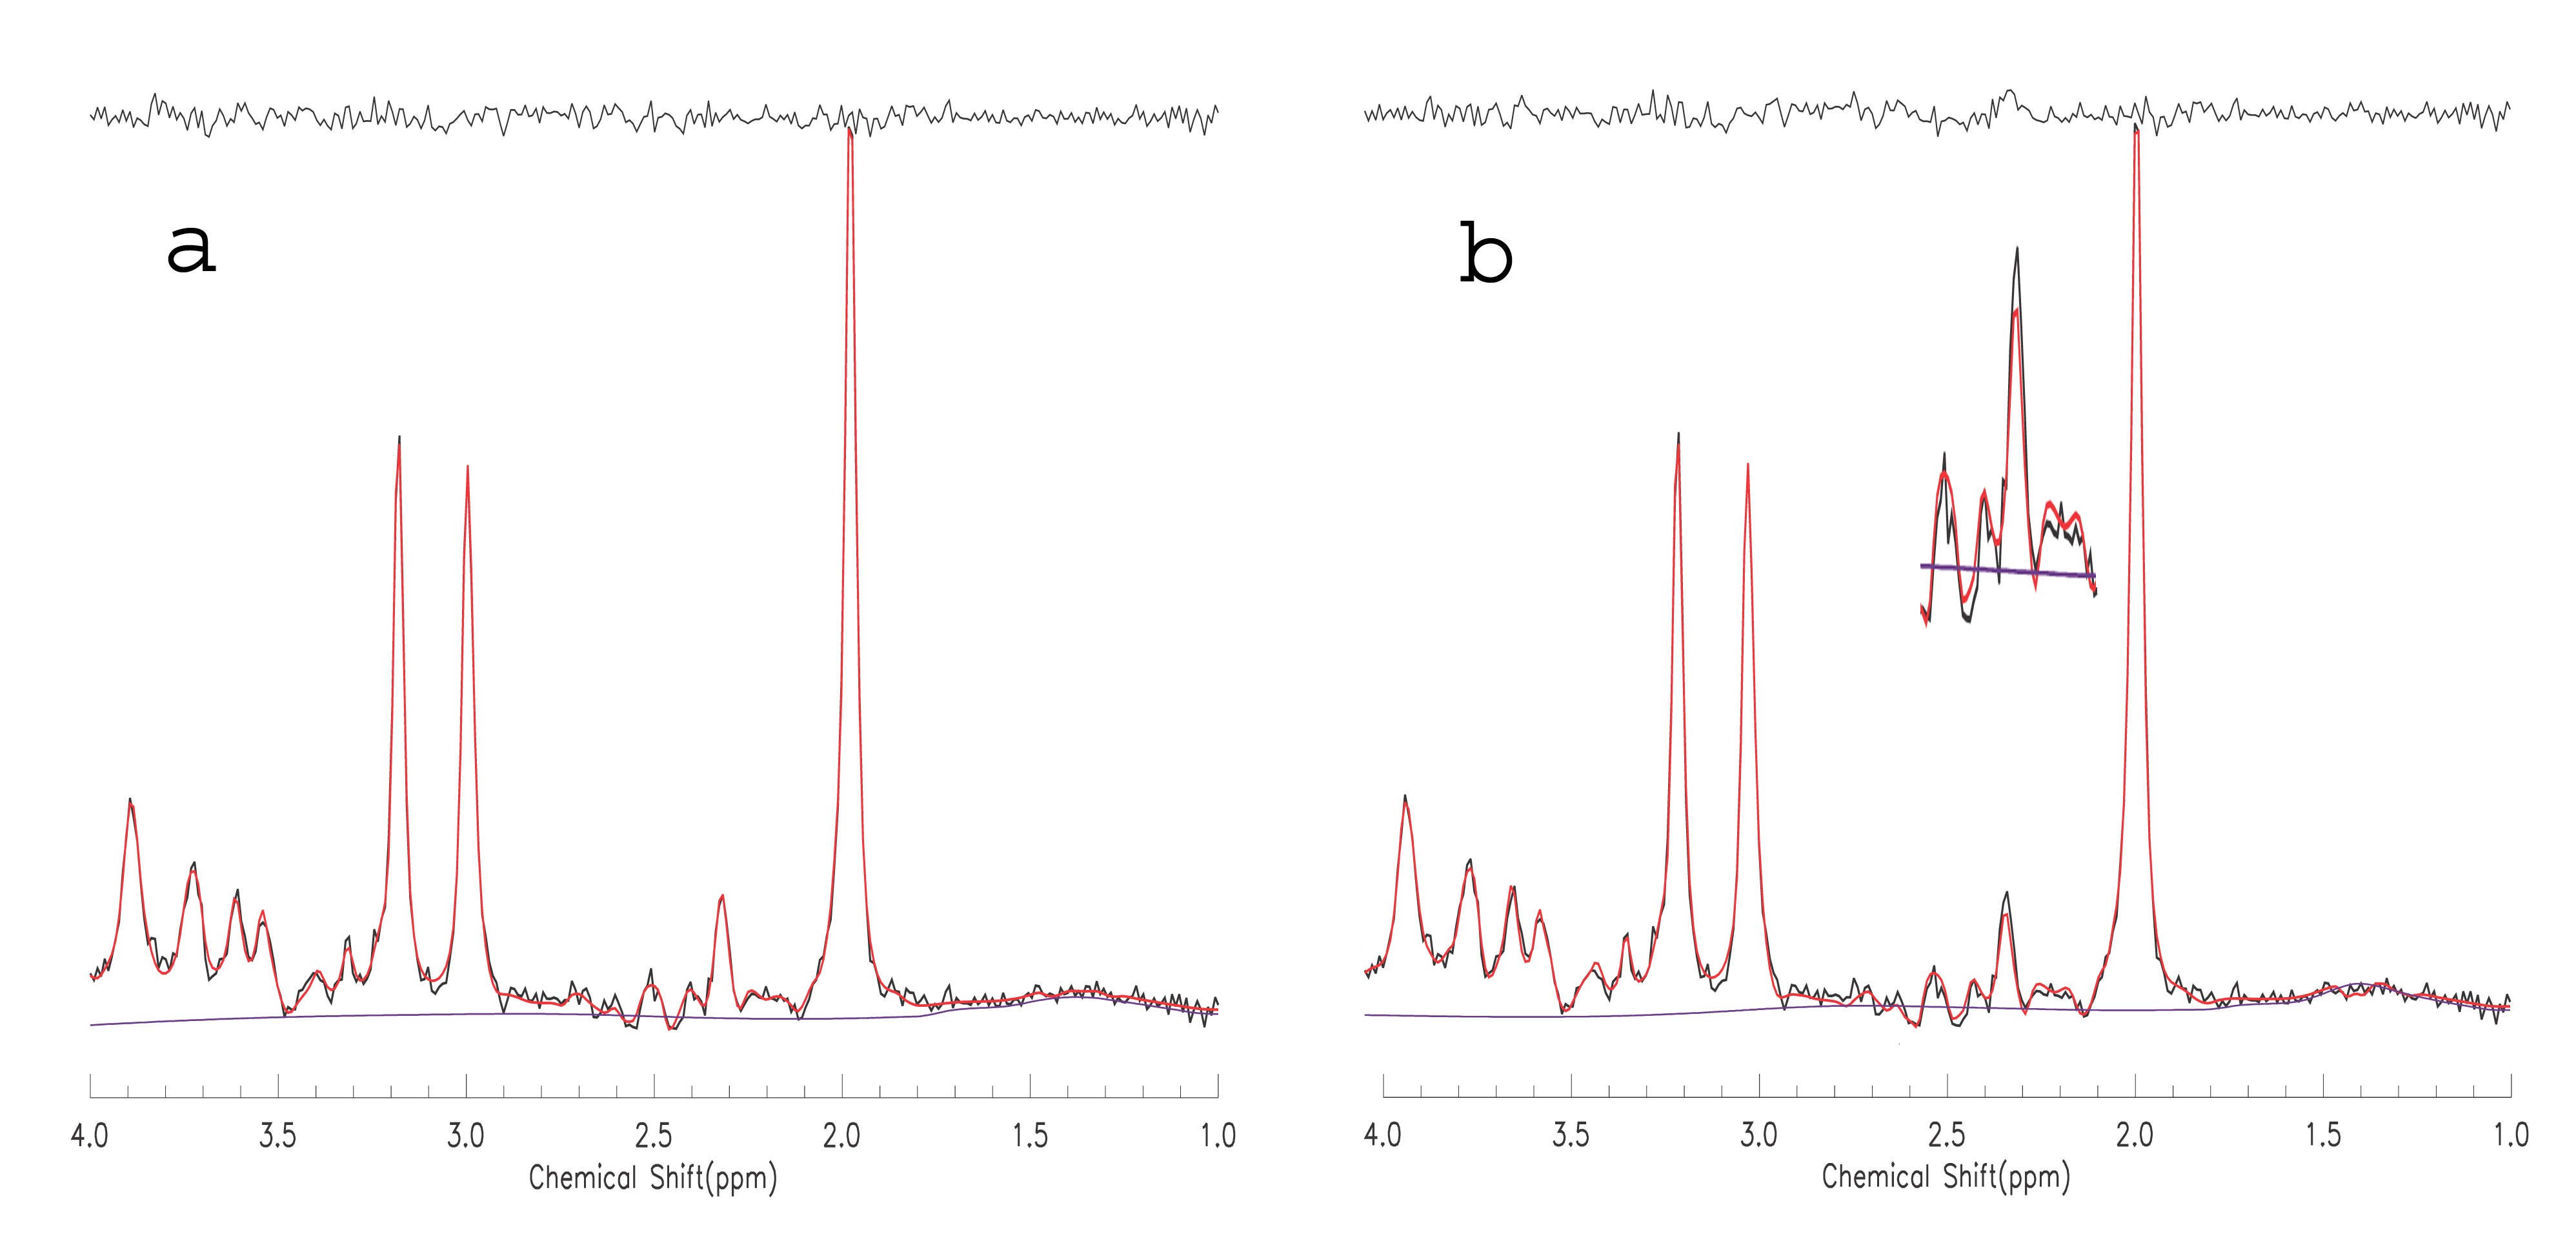
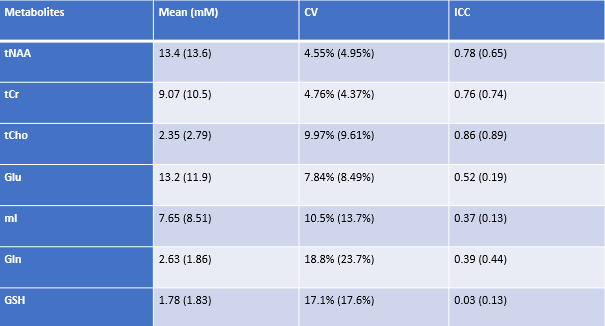
Figure 1 shows the comparisons of simulations (red lines) and phantom spectrum (black lines). There are conspicuous differences between the ideal pulse simulated spectrum (b) and the phantom spectrum, while the spectrum simulated by the real pulses (a) closely matched the phantom result. Similar results were found in vivo (see the scaled up inset in Fig. 2). The estimated metabolite concentrations and reproducibility were listed in Table 1. The results using ideal pulse basis set were given in parentheses. Only the metabolites with CV < 20% were listed. Mean tissue fractions averaged over ten subjects were: fgray = 61.2%( ± 10.5%), fwhite =26.0% (± 5.2%), and CSF = 12.9% (± 3.7%). Mean water T2 was 71 ms (± 3.0 ms). CV and ICC were calculated using the root mean square of paired measurement and Ronald Fisher’s method, respectively.DISCUSSION and CONCLUSION
TE-averaged spectroscopy has simplified spectral structures because resonance lines associated with J-couplings are largely suppressed. As a result, glutamate is differentiated from the rest of metabolites at ~2.35 ppm. TE-averaged spectroscopy has a flatter baseline and better resolved resonance lines (Fig. 2) than short TE spectroscopy. Therefore, fit errors or model inaccuracies are more likely to be revealed. For glutamate, the spectrum simulated using ideal RF pulses showed marked deviations from the phantom spectrum. Similar deviations when using ideal RF pulses were consistently observed in in vivo spectral fitting (Fig.2). For glutamate, the basis sets generated using real RF pulses and ideal RF pulses led to significantly different results. Both the fits and quantification reproducibility were improved using the basis set generated using real RF pulses. The one-dimensional projection method dramatically increased the simulation efficiency for localized MRS. For the current study, the basis set included 18 metabolites, and the J-resolved MRS consisted of 32 echoes. The whole simulation, using real RF pulses, was finished in less than one hour on a standard desktop computer. The fast density matrix simulation technique takes account of chemical shift effect, RF frequency offset, RF pulse excitation profile, water suppression, outer volume suppression, and etc. It is capable of building a virtual MRS experiment for metabolite quantification in vivo.Acknowledgements
No acknowledgement found.References
1. S.A. Smith, T.O. Levante, B.H. Meier, R.R. Ernst, "Computer simulations in magnetic resonance. An object-oriented programming approach," J Magn Reson A 106, 75-105(1994).
2. A.A. Maudsley, V. Govindaraju, K. Young, Z. Aygula, P.M. Pattany, B.J. Soher,G Matson, "Numerical simulation of PRESS localized MR spectroscopy," J Magn Reson. 173, 54-63(2005).
3. L.G. Kaiser, K. Young, G.B. Matson, "Numerical simulations of localized high field 1H MR spectroscopy," J Magn Reson. 195, 195:67-75(2008).
4. Hurd R, Sailasuta N, Srinivasan R, Vigneron DB, Pelletier D, Nelson SJ. Measurement of brain glutamate using TE-averaged PRESS at 3T. Magn Reson Med 2004; 51:435–440.
5. Zhang Y, An L, Shen J. Fast computation of full density matrix of multispin systems for spatially localized in vivo magnetic resonance spectroscopy. Med Phys. 44, 4169-4178(2017).
6. Y Zhang, J Shen. Simultaneous quantification of glutamate and glutamine by J-modulated spectroscopy at 3 Tesla. Med. Res. Med 76, 725-732 (2016).
Figures