1325
Classification of brain tumors by 1H MRSI and MRI using convolutional neural networks1Data Science, Radboud University Nijmegen, Nijmegen, Netherlands, 2Analytical Chemistry, Radboud University Nijmegen, Nijmegen, Netherlands, 3Radiology and Nuclear Medicine, Radboud University Nijmegen, Nijmegen, Netherlands
Synopsis
Several machine learning approaches have been used to classify brain tumors using MR images and spectra. Here we explore the specific properties of convolutional neural networks (CNN) for this task. We designed a CNN that could be trained on combined MR image and spectroscopic image data by exploiting their specific properties (spatial and spectral locality). Using a ‘leave-one-out’ validation, we demonstrate that our method outperforms state-of-the-art classification methods to distinguish tumor grades. These results demonstrate that CNNs are a powerful approach for tumor classification using MRSI data.
Introduction
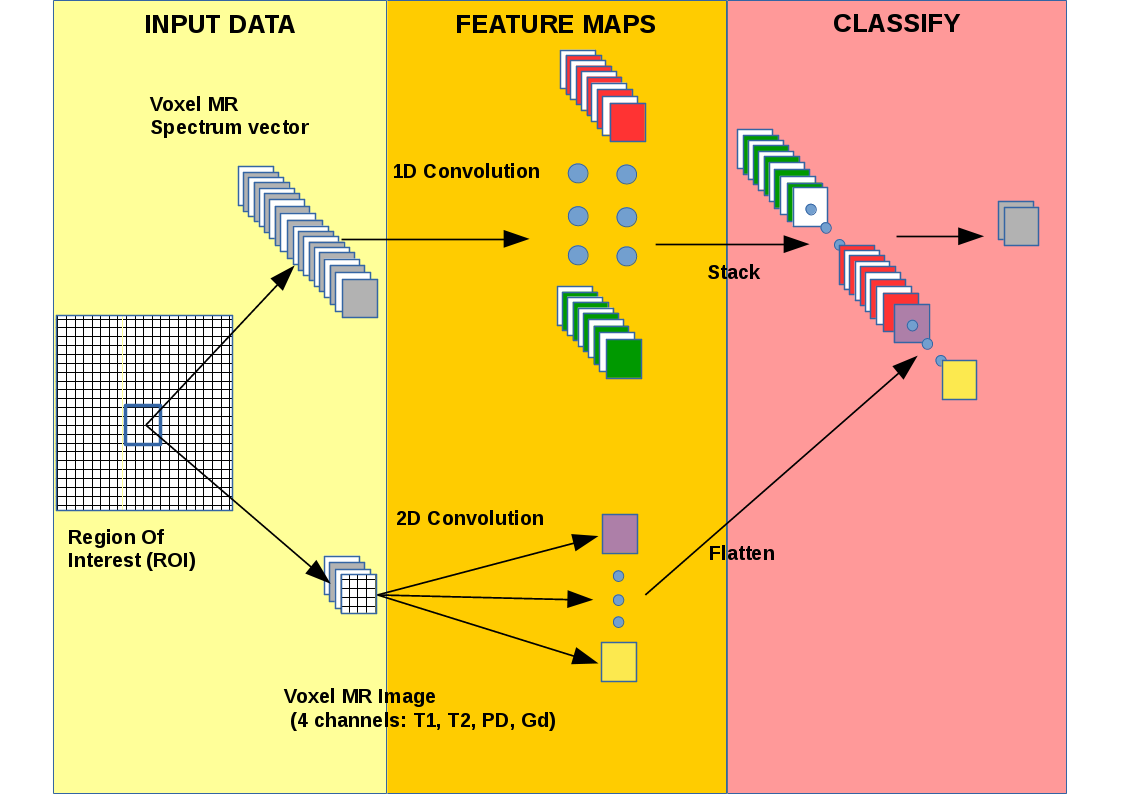
Automatic classification and treatment evaluation of brain tumors by combined MR imaging (MRI) and MR spectroscopic data (MRS) using machine learning approaches has been explored in several studies (e.g. 1,2). We explored Convolutional Neural Networks (CNN) to classify brain tumors from MR spectroscopic imaging (MRSI) and MRI data. CNNs have several advantages compared to other methods such as model flexibility, implicit feature construction and the possibility to identify important features driving the classification. These properties make trained CNN models interpretable. The CNN based method, we developed using MRSI and MRI data for classification called MRSI-CNN, includes a custom regularization term3 which accounts for the locality of the information enclosed into spectra by constraining neighbor weights of convolutional filters. MRSI-CNN can take advantage of different data modalities by correctly exploiting their properties (i.e. spatial and spectral locality for images and spectra respectively). Finally, we used t-SNE4 as a new representation to visualize data produced by MRSI-CNN.Methods
MRSI and MRI data were acquired at the RUMC in the context of the INTERPRET project5 with approval of the local ethical committee from 25 patients with a brain tumor and 4 healthy volunteers. The data set encompassed 6 classes:
1. Normal brain tissue (8 persons);
2. Cerebral Spinal Fluid (8 patients);
3. Grade II gliomas (10 patients);
4. Grade III gliomas (5 patients);
5. Grade IV glioblastomas (7 patients);
6. Meningiomas (3 patients).
A strict quality control procedure was applied to each case and tumor types were determined by histopathological consensus6 . Of each patient water suppressed and unsuppressed 1H 2D MRSI data were acquired of a STEAM localized slab covering tumor and surrounding normal appearing tissue (TE=20ms, TR=2500ms, 16x16x1024 samples) avoiding signals from fat tissue at the skull. Additionally, four different MR images were acquired: T1-weighted, T2-weighted, PD-weighted and gadolinium (Gd)-enhanced T1-weighted images. The STEAM slab for MRSI was centered at the location of the Gd-enhanced T1-weighted or T1/T2 images that showed the largest tumor area. The MR images were registered with respect to the MRSI slice. After processing, including zero-filling to 32x32 voxels, several voxels, situated in the healthy, CSF and tumorous areas, were selected from the respective patients to obtain a sufficiently large data set (669 voxels). The dataset consists of 10 quantified metabolite peak areas from the processed MRSI spectra from the selected voxels, and the corresponding MR pixel intensities of the 4 MR images. The images and spectra are fed as distinct inputs to MRSI-CNN. After each input, there is one convolutional layer (1D and 2D shaped for spectral and image voxels respectively). More in detail, the convolutional layers construct new features from their inputs therefore changing how input data are represented. The output of both layers is then flattened and concatenated. The next and last layer of MRSI-CNN provides the class prediction for each input voxel (Figure 1). We compared the MRSI-CNN method with an SVM with RBF kernel (SVM-RBF) because SVM is a well-known method that generally achieves good accuracy7,8.
Results
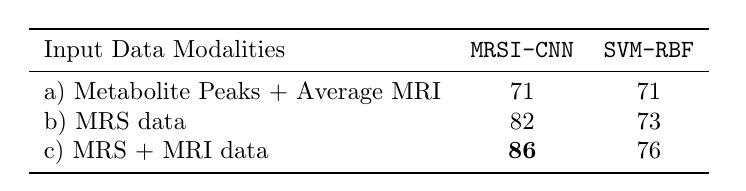
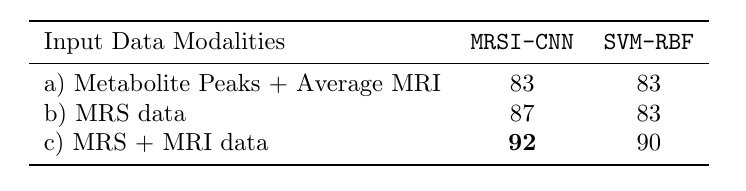
To demonstrate the MRSI-CNN method we selected two classification tasks: Grade II vs Grade III and Grade III vs Grade IV. For both, a double Leave One Patient Out (LOPO) cross-validation was used: an internal cross-validation to tune the hyper-parameters of MRSI-CNN and an external cross-validation to validate the obtained model. The MRSI-CNN and SVM-RBF were trained with different data sets:
a) integrals of 10 metabolite peaks and average intensity of MRI pixels9;
b) only complete MR spectra;
c) complete MR spectra and MRI data of the selected ROIs.
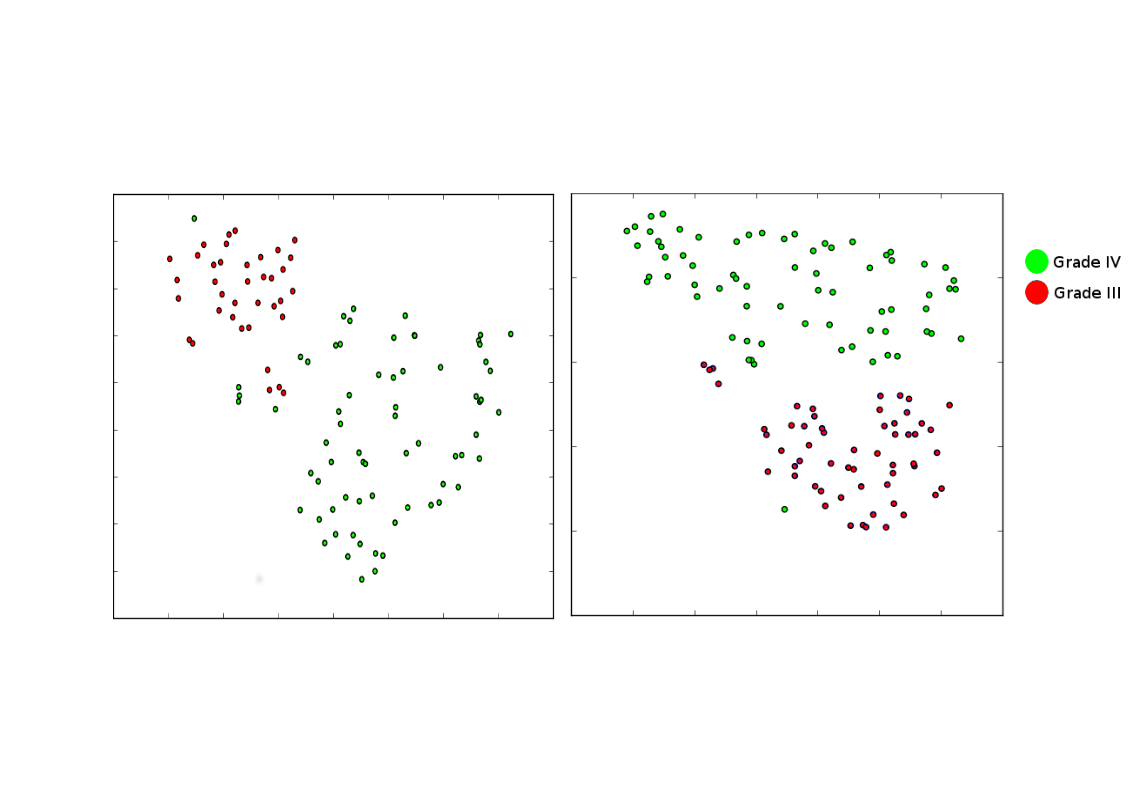
From the results reported in Tables 1,2 it is clear that MRSI with dataset c) performed best. A visual representation of the results is provided by t-SNE plots
Discussion
We designed a CNN approach (MRSI-CNN) to classify brain tumors with combined MRSI and MRI data. Our method outperforms state of art methods such as SVM (see Figures 2,3). There is already an improvement with respect to this method and 9 when MRSI-CNN is trained with spectra. The use of both MR spectra and images increases the performance of MRSI-CNN further for both classification tasks. Moreover, t-SNE 2D plots (see Figures 4,5) in which every dot represents a voxel and each color its ground-truth, visualize how good brain tumor grades can be separated. In conclusion, these results demonstrate that CNNs are a powerful approach for tumor classification with MRSI and depending on the data available may be extended with multiple hidden layers and applied to different tasks.Acknowledgements
No acknowledgement found.References
[1] A. W. Simonetti, W. J. Melssen, M. van der Graaf, G. J. Postma, A. Heerschap, and L. M. C. Buydens, “A chemometric approach for brain tumor classification using magnetic resonance imaging and spectroscopy,” Analytical Chemistry, vol. 75, no. 20, pp. 5352–5361, 2003. PMID: 14710812.
[2] J. Luts, T. Laudadio, A. J. Idema, A. W. Simonetti, A. Heerschap, D. Vandermeulen, J. A. K. Suykens, and S. Van Huffel, “Nosologic imaging of the brain: segmentation and classification using mri and mrsi,” NMR in Biomedicine, vol. 22, no. 4, pp. 374–390, 2009.
[3] J. Acquarelli, T. van Laarhoven, J. Gerretzen, T. N. Tran, L. M. Buydens, and E. Marchiori, “Convolutional neural networks for vibrational spectroscopic data analysis,” Analytica Chimica Acta, vol. 954, pp. 22 – 31, 2017.
[4] L. van der Maaten and G. Hinton, “Visualizing data using t-SNE,” Journal of Machine Learning Research, vol. 9, pp. 2579–2605, 2008.
[6] M. van der Graaf, M. Julia -Sape, F. A. Howe, A. Ziegler, C. Majos, A. Moreno-Torres, M. Rijpkema, D. Acosta, K. S. Opstad, Y. M. van der Meulen, C. Arus, and A. Heerschap, “Mrs quality assessment in a multicentre study on mrs-based classification of brain tumours,” NMR in Biomedicine, vol. 21, no. 2, pp. 148–158, 2008.
[7] T. Joachims, Text categorization with Support Vector Machines: Learning with many relevant features, pp. 137–142. Berlin, Heidelberg: Springer Berlin Heidelberg, 1998.
[8] S. Hua and Z. Sun, “Support vector machine approach for protein subcellular localization prediction,” Bioinformatics, vol. 17, no. 8, pp. 721–728, 2001.
[9] G. J. Postma, J. Luts, A. J. Idema, M. Julia-Sape, Angel Moreno-Torres, W. Gajewicz, J. A. Suykens, A. Heerschap, S. V. Huffel, and L. M. Buydens, “On the relevance of automatically selected single-voxel mrs and multimodal mri and mrsi features for brain tumour differentiation,” Computers in Biology and Medicine, vol. 41, no. 2, pp. 87 – 97, 2011.
Figures