1318
Quantification of Glutamate and Glutamine in the healthy brain via 1H in-vivo CSI MRS using LCModel is not reliable.1Departement of Diagnostic and Interventional Neuroradiology, University Hospital Tuebingen, Tuebingen, Germany
Synopsis
Glutamate and glutamine play an important role in CNS. Both are quantifiable via 1H in-vivo MRS, although a correct, separate quantification of both metabolites is often very challenging. In this study, 1H in-vivo CSI MRS was performed on ten healthy subjects, using the CSI sequences PRESS and Semi-LASER with TE=40ms,60ms,80ms,100ms and 135ms at 3T. The inner 64 spectra of each CSI matrix at each TE were averaged to a single spectrum. Averaged spectra were analysed using LCModel. The quantification of glutamate and glutamine, using this method, which is also a popular approach in MRS research, was shown to be inconsistent.
Introduction
Glutamate and glutamine both are metabolites, which are present and important in healthy and morbid brain tissue. Due to tissue concentrations of 3-6mmol of glutamine and 6-12mmol of glutamate 1, both contribute to in-vivo 1H MR spectra. Nevertheless, reliable quantification is often very challenging, mainly due to the coupled spin systems and the overlap with other metabolites. A common practise in MRS research is quantifying both metabolites separately or summarized to Glx, using the software package LCModel. In any case, the evaluated metabolite concentrations should show a monotone signal decay with increasing echo times. This property can be used as an indicator for reliability of the quantification method.Methods
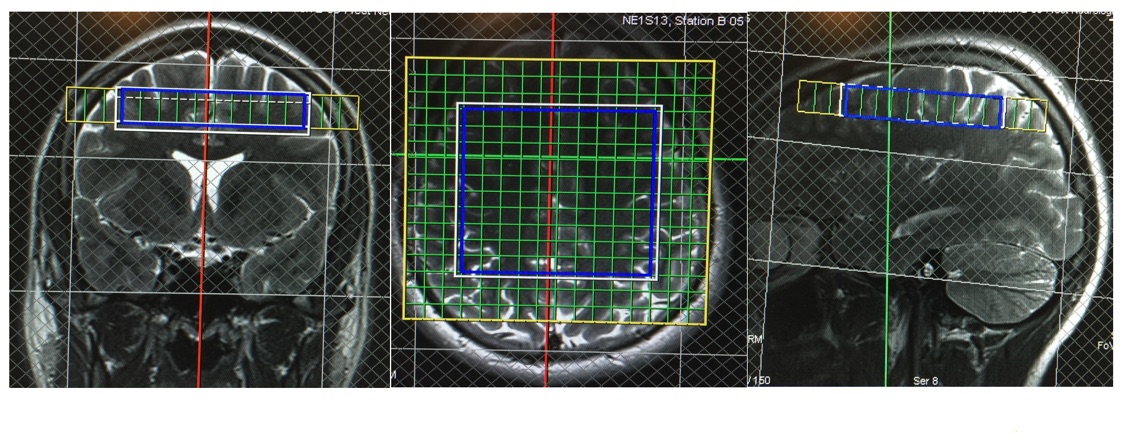
Ten healthy subjects were measured at 3T using a whole-body MR system with a 20-channel head and neck coil. (Skyra, Siemens, Erlangen). MRSI was performed using a CSI PRESS sequence and a CSI Semi-LASER sequence with TEs 40,60,80,100,135 ms, TR 1600ms, FOV = 160×160 mm2, matrix size = 16×16, slice thickness = 15 mm, VOI = 80×80 mm2. The axial slice was positioned nearly over the corpus callosum in the central cerebrum. The positioning of the MRS matrix is shown in figure 1. Outer fat signal suppression was performed. The voxel of the VOI were used for further evaluation by averaging all 64 spectra of each measurement to a single spectrum after performing frequency correction. The averaged spectra were analyzed using LCModel. For each sequence and echo time, a 17 metabolites containing LCModel basis set was simulated under the assumption of ideal rf-pulses. Concentration values of total creatine, glutamate, glutamine and the sum of glutamate and glutamine (Glx) were evaluated.Results
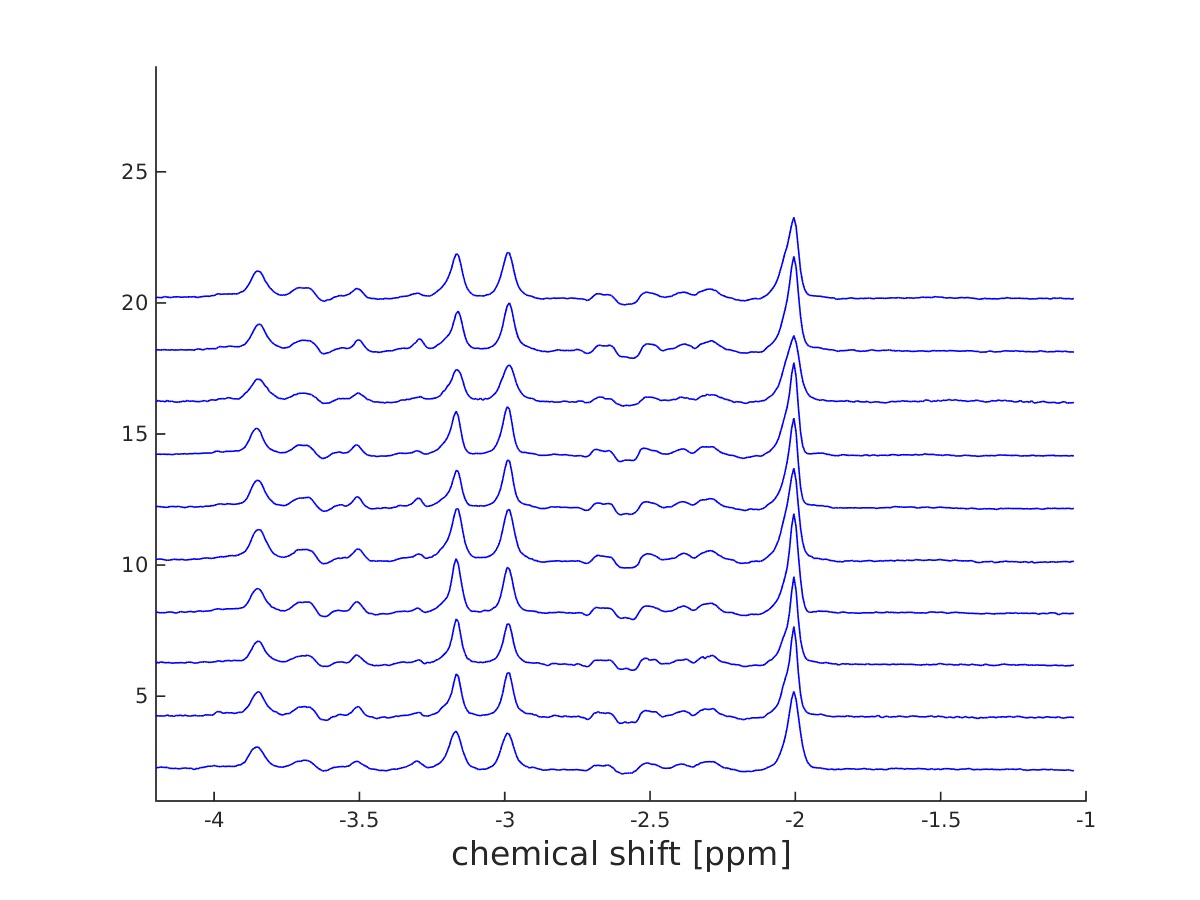
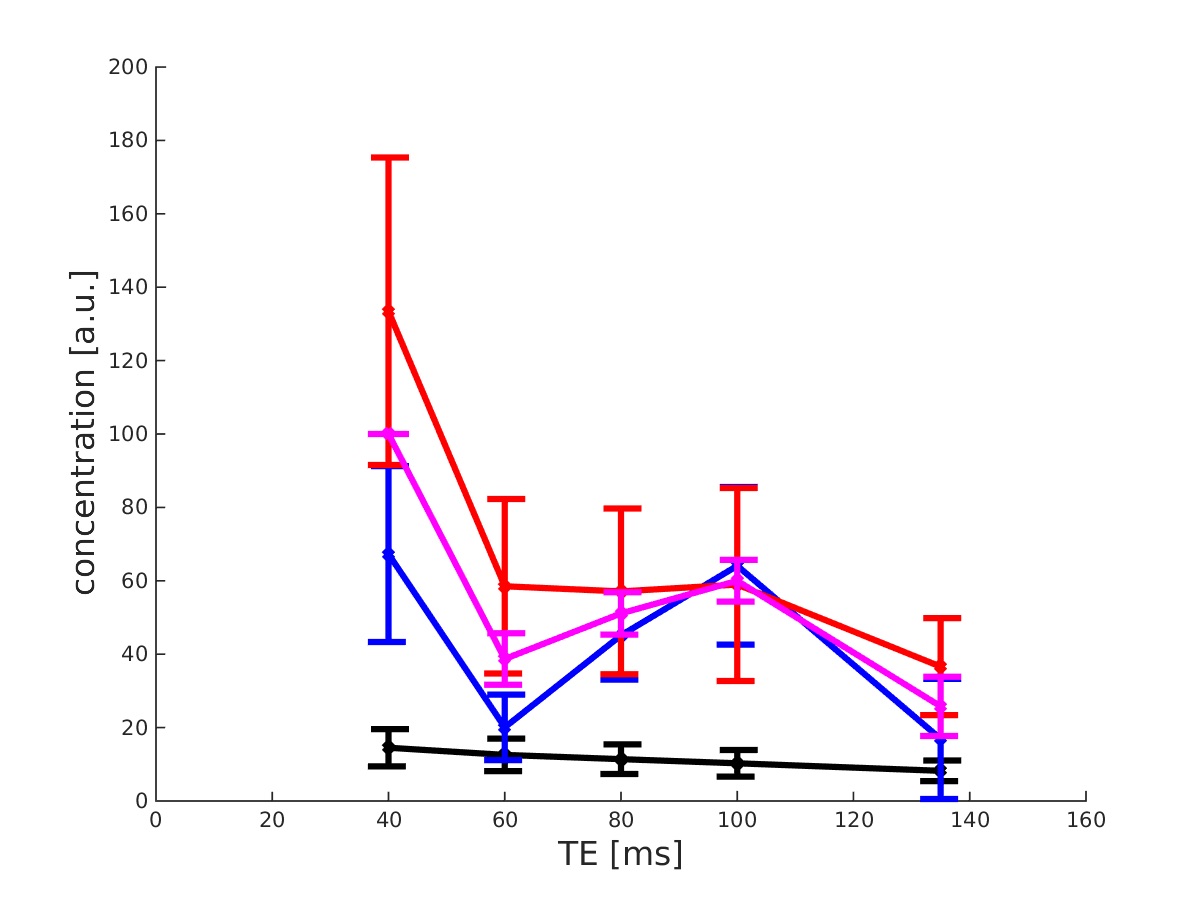
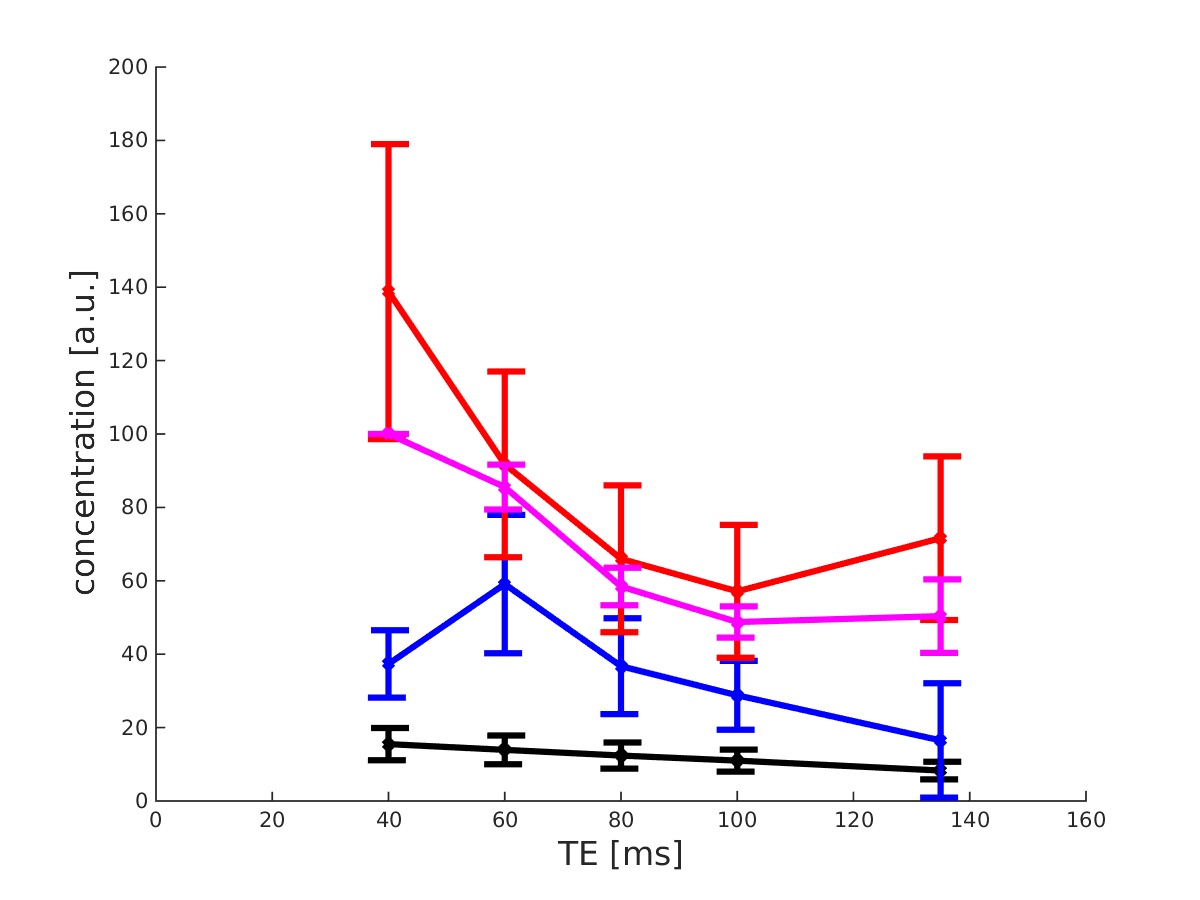
Figure 2 shows the ten spectra obtained by averaging the inner 64 voxels of each CSI data set at the echo time 135ms of all ten subjects, using PRESS-Sequence as localisation method for acquisition. In figures 3 and 4, the mean concentration values of total creatine, glutamate, glutamine and the sum of glutamate and glutamine acquired with PRESS (figure 3) and semi-LASER (figure 4) are plotted against the echo time. The values of creatine show a monotone decay with increasing echo time in both sequences. Measured concentrations of glutamine alternate and increase especially between TE=60ms and TE=100ms in the PRESS experiment and between TE=40ms and TE=60ms in the semi-LASER experiment. Additionally, glutamine concentrations rise from TE=100ms to TE=135ms in the semi-LASER experiment. This is also observed for GlxDiscussion
Regarding the averaged spectra of the ten subjects at echo time 135ms in figure 2, the similarity of these is very remarkable. Although variable in sex and especially age, the metabolic profile of each subject, estimated based on the spectral line shape, seems nearly unchanged between subjects (beside small amplitude variations). According to figures 3 and 4, especially the quantification of glutamine with this method seems not to be sufficient and reliable. An increase of metabolite concentrations in a measurement with increased echo time is not possible and indicates imperfections of the quantification method. The expected decay of the concentration values of glutamate and total creatine with increasing echo time is measured. This behaviour cannot be observed for the values of glutamine. The measured concentration of Glx as sum of glutamate and glutamine in the ratio 2.5:1 also show no steady decay with increasing echo time. A common approach in MR research is the absolute quantification of glutamate and glutamine via 1H in-vivo MRS by averaging various echo times, using LCModel for analysis 2. This method seems not to be reliable. However, the validity of the relative quantification of the concentration values of glutamate and glutamine using this method is not questioned by this results.Conclusion
The quantification of glutamine via 1H in-vivo MRS at 3T using LCModel at multiple echo times for analysis was shown to be not reliable. Although the analysed spectra had a very high SNR due to averaging of single CSI spectra, the estimation of quantitative concentration values of glutamine was not possible. Considering the results of this study, the usage of this method using LCModel for quantification of glutamine or Glx should at least be carefully questioned.Acknowledgements
We would like to thank the IZKF student stipend program for support.References
1. Govindaraju, V., K. Young, and A.A. Maudsley, Proton NMR chemical shifts and coupling constants for brain metabolites. NMR Biomed, 2000. 13(3): p. 129-53.
2. Srinivasan, R., et al., TE-averaged two-dimensional proton spectroscopic imaging of glutamate at 3 T. Neuroimage, 2006. 30(4): p. 1171-8.
Figures