1316
Simultaneous modeling of sum and difference spectra improves quantitative outcomes for edited MRS1Division of Biomedical Engineering, Department of Human Biology, University of Cape Town, Cape Town, South Africa, 2Russell H. Morgan Department of Radiology and Radiological Science, The Johns Hopkins University School of Medicine, Baltimore, MD, United States, 3F. M. Kirby Research Center for Functional Brain Imaging, Kennedy Krieger Institute, Baltimore, MD, United States, 4Cape Universities Body Imaging Centre (CUBIC-UCT), Cape Town, South Africa
Synopsis
J-difference-edited MR spectroscopy allows for the detection of several low-concentration compounds at 3T, but suffers from long acquisition times. Multiplexed editing experiments provide simultaneous detection of two or three metabolites by differentially modulating the spin systems of interest, and separating edited signals into distinct sum or difference spectra. For a novel multiplexed experiment (HERCULES), with simulated metabolite basis functions we demonstrate that simultaneously modeling the sum and difference spectra results in comparable metabolite levels with lower coefficients of variation, compared to separate modeling of the sum and difference spectra.
Purpose
To establish whether modeling the sum and difference spectra at the same time is a more robust way to quantify edited MRS spectra.Introduction
J-difference editing is widely used to quantify brain metabolites, such as γ-aminobutyric acid (GABA) and glutathione (GSH)1, improving resolution by subtracting out stronger overlying signals from more concentrated metabolites. This subtraction is performed in post-processing, and it is common to perform further analysis of the editing-off subspectrum (or the sum spectrum) to quantify the higher-concentration metabolites, such as N-acetylaspartate (NAA), creatine (Cr), choline (Cho), myo-inositol (mI), glutamine (Gln), and glutamate (Glu)2.
Performing independent analyses for edited and non-edited metabolites does not conform to best practice for statistical modeling. Given that a substantial subset of compounds will contribute signal to both sum and difference spectra, it is expected that the model will be more reliably constrained by considering all acquired information at the same time.
With the recent development of Hadamard-encoded editing, it is possible to extract more than one difference spectrum from a single acquired dataset3. This ‘multiplexed’ editing approach further motivates a multiplexed analysis pipeline. Therefore, in this abstract, we compare simultaneous fitting of data from a new experiment HERCULES (Hadamard Editing Resolves Chemicals Using Linear-combination Estimation of Spectra) to separate quantification of the edited sum spectrum and each of the two difference spectra.
Methods
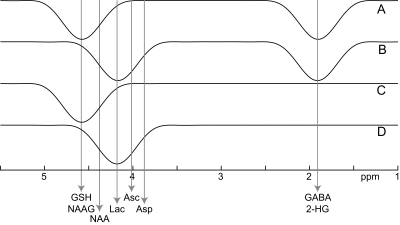
21 in vivo datasets were acquired with the HERCULES pulse sequence using a Philips Achieva 3 T scanner in 11 healthy adults. Parameters: 3 × 3 × 5 cm3 voxels; TE 80 ms; TR 2s. HERCULES data are acquired as four sub-experiments (as shown in Figure 1): experiment A applies editing pulses at 1.9 and 4.58 ppm; experiment B at 1.9 and 4.18 ppm; experiment C at 4.58 ppm; and experiment D at 4.18 ppm. The aim of this acquisition is to differentially modulate the spin evolution of a number of editable metabolites, including: aspartate (Asp); ascorbate (Asc); GABA; GSH; lactate (Lac); NAA; and N-acetylaspartylglutamate (NAAG). The SUM spectrum (A+B+C+D) contains un-edited signals and the NAA aspartate signal. One difference spectrum (DIFF1=A+B-C-D) is a traditional GABA-edited experiment with prominent signals from GABA, Glu/Gln, and NAA. Edited signals from GSH, NAAG, Asp, Asc and Lac are separated into the other difference spectrum (DIFF2=A-B+C-D).
Density-matrix simulations were performed using FID-A4, to generate a basis set for the linear-combination modeling, with the SUM and difference sub-spectra concatenated (for multiplexed HERCULES fitting). Basis sets for separate modeling of the SUM or difference sub-spectra were also generated. Modeling was performed using a custom linear-combination MATLAB routine, which uses least-squares minimization to estimate the coefficients for each metabolite contribution and models the baseline an independent spline in each sub-spectrum.
Metabolite ratios to total Cr (tCr) and the coefficients of variation (CV) were calculated for each metabolite across all spectra. The tCr signal from the SUM spectrum was used as the reference to quantify the isolated difference spectra.
Results
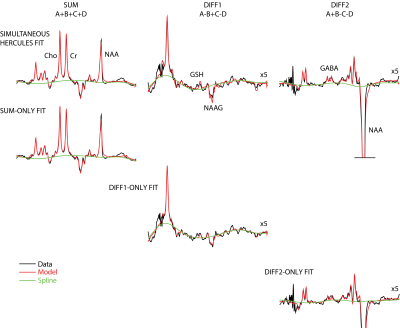
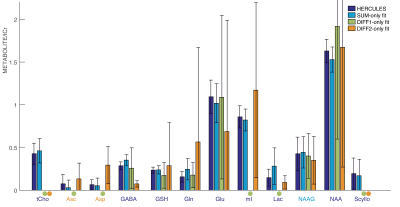
Linear modeling of all datasets with all four approaches yielded visually plausible model spectra, as shown for one dataset in Figure 2. Metabolite levels for each metabolite and fitting approach is shown in Figure 3. Signals that do not contribute meaningfully to the difference spectra are not plotted. There is general quantitative agreement between the modeling approaches. The lowest CV for the majority of metabolites came from the HERCULES simultaneous modeling approach (it was only marginally worse for Asc, Asp and NAAG).Discussion
Here, we demonstrate that modeling all the available information results in less variable fitting outcomes for difference-edited MRS. This is an unsurprising outcome, and therefore one that should substantially change the way edited spectra are quantified, not just for multiplexed editing, but for all J-difference-edited spectra.
One major drawback of J-difference editing is the impact of subtraction artifacts that can bias quantification. The additional constraint provided by simultaneous consideration of the SUM spectrum appears to reduce this effect. Not only is simultaneous fitting less variable, it is also more time-efficient.
With the development of multiplexed editing, it is likely that focus will shift from maximally isolating the signal of a single metabolite of interest to maximally differentiating the evolution of the full set of quantifiable metabolites. The approach to MRS fitting/modeling will have to adjust to accommodate this change. The implementation of multiplexed fitting will allow more complex acquisition approaches to be considered, with the ultimate limit of performing different editing pulses in every TR.
Acknowledgements
This work has been supported by National Research Foundation of South Africa Thuthuka Grant 150612119380.References
1. Harris AD, Saleh MG, Edden RAE. Edited 1 H magnetic resonance spectroscopy in vivo: Methods and metabolites. Magn Reson Med. 2017;77(4):1377-1389.
2. Mullins PG, McGonigle DJ, O’Gorman RL, Puts NAJ, Vidyasagar R, Evans CJ, Cardiff Symposium on MRS of GABA, Edden RA. Current practice in the use of MEGA-PRESS spectroscopy for the detection of GABA. NeuroImage. 2014;86(2):43–52.
3. Chan KL, Puts NAJ, Schar M, Barker PB, Edden RAE. HERMES: Hadamard encoding and reconstruction of MEGA-edited spectroscopy. Magn Reson Med. 2016;76(1):11–9.
4. Simpson R, Devenyi GA, Jezzard P, Hennessy TJ, Near J. Advanced processing and simulation of MRS data using the FID appliance (FID-A)—An open source, MATLAB-based toolkit. Magn Reson Med. 2017;77(1):23–33.
Figures


