1315
On the exploitation of slow macromolecular diffusion for baseline estimation in MR spectroscopy using 2D simultaneous fitting1Depts. Radiology and Biomedical Research, University of Bern, Bern, Switzerland
Synopsis
The slow diffusivity of macromolecules was exploited in 2D signal modeling with FiTAID to estimate the macromolecular baseline in MRS of human brain. Two approaches were used for baseline modeling: (i) a predefined model derived from high-field and T1-based baseline determination and (ii) a model-free description by equally spaced Voigt resonances. Inspection of fit residues and comparison with literature reveals that the second model is more appropriate.
Purpose
The macromolecular baseline (MMBL) is a major feature of clinical MR spectra of the brain: a nuisance on one side that substantially complicates quantification of metabolite content, but a largely untapped source of patho-physiological information, on the other. Multiple methods have been developed to define the MMBL, all based on intrinsic differences in the properties of MMBL and metabolite signals1, in particular for T12-4, T25, T1 and T26,7 or peak shape8. The use of differences in apparent diffusion coefficients (ADC) has also been suggested and implemented to supplement T1-based MMBL segregation for an animal scanner9. Here, we suggest the use of a non-water-suppressed (nWS) diffusion-weighted MR spectroscopy (DWS) sequence in combination with simultaneous 2D modeling of spectral features and ADCs to define the MMBL in human brain from multiple DW scans with different diffusion weightings. In addition, we also test for differences in the resulting MMBL if it is described using a model with prior assignments based on T1-differences10 or if a model-free approach based on a decomposition into equally spaced Voigt lines is used.Methods
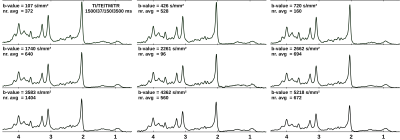
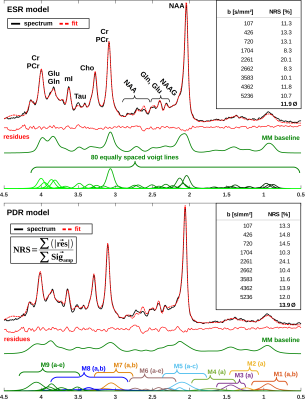
A DWS sequence based on metabolite-cycled STEAM11 was used in 13 healthy volunteers to record nWS spectra from occipital GM at 3T (TE/TM/TR=37/150/3500ms; diffusion gradient length δ=11ms, diffusion time Δ=168ms, maximum gradient Gmax=38mT/m, maximal b-value bmax=5236s/mm²). Spectra were post-processed using the water signal as inherent reference to correct for motion-induced signal loss11. High SNR spectra (Fig. 1) were obtained by collecting and averaging cohort-wide acquisitions at individual b-values. ADC values were estimated in a 2D simultaneous fit in FiTAID12 based on mono-exponential diffusion models. The metabolite basis set comprised 17 components simulated with VESPA assuming ideal RF pulses. Two models were investigated for the description of the MMBL: (i) PreDefines Resonances (PDR) M01-M09 with fixed proportions of amplitude, shape and width (adapted from 9.4T)9; (ii) 80 Equally Spaced Resonances (ESR) of Voigt lines between 0.5 and 4.5ppm (fixed Lorentzian and Gaussian broadenings: 10 and 5Hz). Fitting was performed in two steps: first, the macromolecular ADC was kept fixed near its final estimate, while the amplitudes of subcomponents {M01-M09 in (i) and the individual Voigt lines in (ii)} were allowed to vary; second, the ADC of the MMBL pattern was estimated in parallel with the ADCs of the metabolites (unconstrained in both steps). Additional parameter constraints (metabolite width, phase, frequencies) were identical in both cases. Fitting accuracy was evaluated as Normalized Residual Sum (NRS) calculated from the sum of absolute values of residues normalized by the sum of the measured signals.Results and Discussion
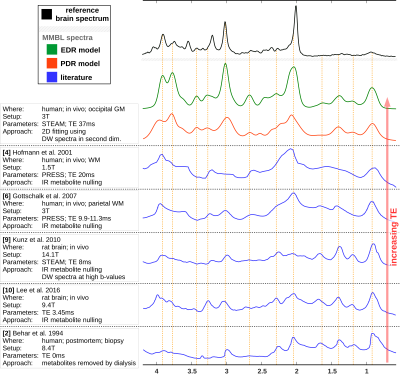
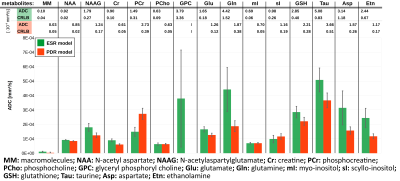
The resulting MMBL is illustrated in Fig. 2 for both models. The measured spectra appear fairly well represented in both cases. However, larger residues for PDR vs. ESR for all b-values show that the predefined model from rat brain at 9.4T and based on T1-differences9 is too restrictive. A comparison of our estimated MMBLs to different literature approaches, as presented in Fig. 3, is hampered by the different acquisition conditions. Higher fields allow for better resolved spectral features, but the present model-free ESR approach based on diffusion- and not T1-differences gives comparably feature-rich results at 3T. Major differences may well be largely due to T2-differences between MMBL components (already noted in [2] for the 2.1ppm peak). However, multi-component peaks with different T1 may also lead to underestimation of some T1-based MMBL components, e.g. at 3ppm. Implementing diffusion-based methods for the MMBL at high fields will resolve this issue. The resulting ADCs for the small metabolites are listed in Fig. 4. They show that the MMBL-definition method strongly influences the ADC estimates and the attainable precision. However, clear trends for substantial differences between metabolites are evident for both models, but will have to be confirmed with cohort statistics based on fits using the derived MMBL. Whether multi-component peaks with similar spectral patterns (creatines, cholines) are resolvable based on diffusion properties also remains to be demonstrated.Conclusion
It is shown that use of diffusion spectroscopy in combination with 2D simultaneous fitting is suitable to define the MMBL in a model-free approach solely based on diffusion properties even on clinical scanners, i.e. without need for ultra-strong gradients to null metabolite signals completely. Further work is needed to do so at shorter TE, and studies at higher fields with this technique may also help to determine whether there are indeed substantial interindividual differences in MMBL composition13. The comparison with literature revealed a broad variety in MMBL estimates, where differences may be due to species, brain region, echo time, B0, but also T1- vs. ADC-based segregation.Acknowledgements
Supported by the Swiss National Science Foundation (#320030_156952, #320030_175984).References
[1] Cudalbu C, Mlynarik V, Gruetter R. Handling macromolecule signals in the quantification of the neurochemical profile. J Alzheimers Dis 31 Suppl 3:S101-S115 (2012)
[2] Behar KL, Rothman DL, Spencer DD. Petroff OAC, Analysis of macromolecule resonances in 1H NMR spectra of human brain. Magn Reson Med 32:294–302 (1994)
[3] Knight-Scott J. Application of multiple inversion recovery for suppression of macromolecule resonances in short echo time 1H NMR spectroscopy of human brain. J Magn Reson 140:228-234 (1999)
[4] Hofmann L, Slotboom J, Boesch C, Kreis R. Characterization of the macromolecule baseline in localized 1H-MR spectra of human brain. Magn Reson Med 46:855–863 (2001)
[5] Ratiney H, Coenradie Y, Cavassila S, van Ormondt D, Graveron-Demilly D. Time-domain quantitation of 1H short echo-time signals: background accommodation. Magn Reson Mater Phy 16 (6):284-296 (2004)
[6] Gottschalk M, Lamalle L, Segebarth C. Short-TE localized 1H MRS of the human brain at 3 T: quantification of the metabolite signals using two approaches to account for macromolecular signal contributions. NMR Biomed 21:507–517 (2008)
[7] Chong DGQ, Kreis R, Bolliger CS, Boesch C, Slotboom J. Two-dimensional linear-combination model fitting of magnetic resonance spectra to define the macromolecule baseline using FiTAID, a Fitting Tool for Arrays of Interrelated Datasets. Magn Reson Mater Phy 24:147-164 (2011)
[8] Provencher SW. Estimation of metabolite concentration from localized in vivo proton NMR spectra. Magn Reson Med, 30:672-679 (1993)
[9] Kunz N, Cudalbu C, Mlynarik V, Huppi PS, Sizonenko SV, Gruetter R. Diffusion-weighted spectroscopy: a novel approach to determine macromolecule resonances in short-echo time 1H-MRS. Magn Reson Med, 64:939–946 (2010)
[10] Lee HH, Kim H. Parameterization of spectral baseline directly from short echo time full spectra in 1H-MRS. Mag Reson Med, 78(3):836–847 (2017)
[11] Döring A, Adalid Lopez V, Brandejsky V, Boesch C, Kreis R. Diffusion weighted MR spectroscopy without water suppression allows to use water as inherent reference signal to correct for motion-related signal drop. In: Proc Intl Soc Mag Reson Med, 24 (2016) #2395
[12] Adalid V, Döring A, Kyathanahally SP, Bolliger CS, Boesch C, Kreis R. Fitting interrelated datasets: metabolite diffusion and general lineshapes. Magn Reson Mater Phy, 30:429 (2017)
[13] Giapitzakis I-A, Avdievitch A, Henning A, Characterization of macromolecular baseline of human brain using metabolite cycled semi-LASER at 9.4T. In: Proc ESMRMB, 30 (2017) #502
Figures


