1313
Quantitative evaluation of systematic bias in clinical MRS introduced by the use of metabolite basis sets simulated with ideal RF pulses1Depts. Radiology and Biomedical Research, University of Bern, Bern, Switzerland, 2NIH, NIMH, Magnetic Resonance Spectroscopy Core, Bethesda, MD, United States
Synopsis
The purpose of this study was to quantitatively evaluate biases caused by the use of ideal PRESS simulations. Metabolite basis spectra were simulated for an ideal PRESS sequence as well as with real shaped RF-pulses. Theoretical ground truth spectra were constructed for different TE and shim settings. They were fitted using both basis sets. It is shown that the fitting accuracy decreases when using ideal simulations and they depend on TE and metabolite. Therefore, simulation of basis sets should include the effects of the real pulse shapes even for the presented case of short TE and fairly large B1 amplitude.
Introduction
Previous investigations have shown that linear combination model fitting of MR spectra can be based on simulated instead of measured metabolite base spectra[1,2]; and sophisticated, but still user-friendly simulation tools are available[3,4,5]. It is also well-known that the four-compartment-effect[6,7] due to limited RF bandwidths can lead to drastic spectral effects at intermediate echo times (e.g. for lactate in PRESS[8] or GABA in editing scans[7]). Simulations including real RF pulse shapes are lengthy but feasible with standard multidimensional simulations and become faster using smart summation of propagators[9].
The purpose of the present study was to quantitatively evaluate the error caused by the use of ideal PRESS simulations to create the metabolite basis set in the “benign” situation of strong B1 fields obtained at 3T with a transmit head coil at short and long TE. To do so, clinical spectra of known ground truth composition were approximated by linear combination of base spectra obtained from simulation of PRESS with the truly implemented shaped RF pulses. These spectra were then modeled with a linear combination fitting tool based on simulated metabolite base spectra obtained from either ideal or real pulse simulations to quantitatively document the effect of neglecting real pulse shapes in the simulation of base spectra.
Methods
Metabolite basis spectra were simulated with Gamma[4,5]: 1) for an ideal PRESS sequence applying ideal rotations to the density matrix and 2) for PRESS with real (shaped) RF pulses (180° Mao and 90° hsinc pulses). 44x44 spatial subvoxels were simulated on a local linux cluster for most metabolites.
Theoretical ground truth spectra were constructed from the real-pulse simulations (RPS) based on literature values for in vivo concentrations[10], Lorentzian T2 broadening (single T2 of 150 ms) and additional Gaussian broadenings (2, 3 or 4 Hz representing different shim conditions) plus random noise. For these three shim settings 10 spectra each were evaluated for each TE in a series of 24 echo times (20 to 307.5 ms; TE1 9.3 ms, TE2 incremented; constant SNR, i.e. T2 signal decay not included for ease of comparison).
These spectra were then fitted in FiTAID[11] using basis sets from RPS and ideal pulse simulations (IPS).
Experimental spectra were obtained at 3T (Prisma, Siemens), with a Tx/Rx head coil and the Siemens PRESS sequence with minimized pulse durations (1.8 and 3.0 ms for 90 and 180° pulses) on a “braino” phantom for the same TE series as described above.
Results and Discussion
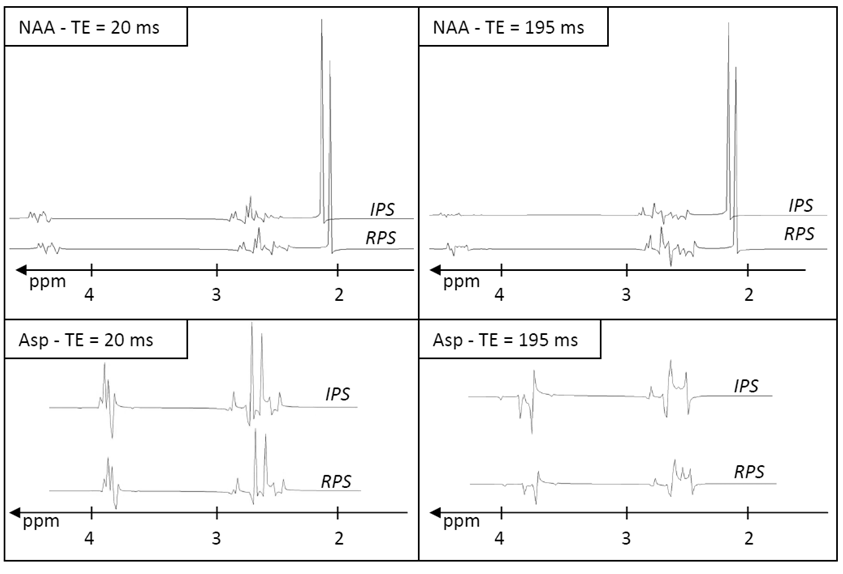
Fitting the in vitro scans with the baseline spectra from RPS reduced the fit residues over all TEs by a factor of 1.7 compared to IPS, demonstrating that the RPS bases are closer to reality than the IPS bases. As expected for fairly strong B1, the apparent spectral differences between the two simulation cases were fairly small even for long TE (Fig 1).
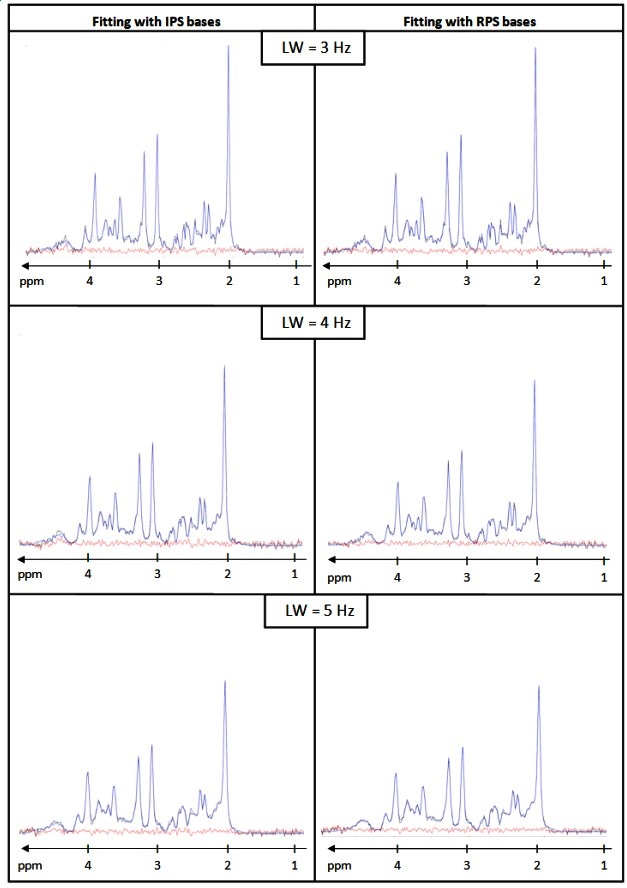
Visually, fitting performance was good for all in silico-constructed brain spectra - irrespective of TE and whether IPS or RPS bases were used (examples for TE = 20 ms given in Fig 2).
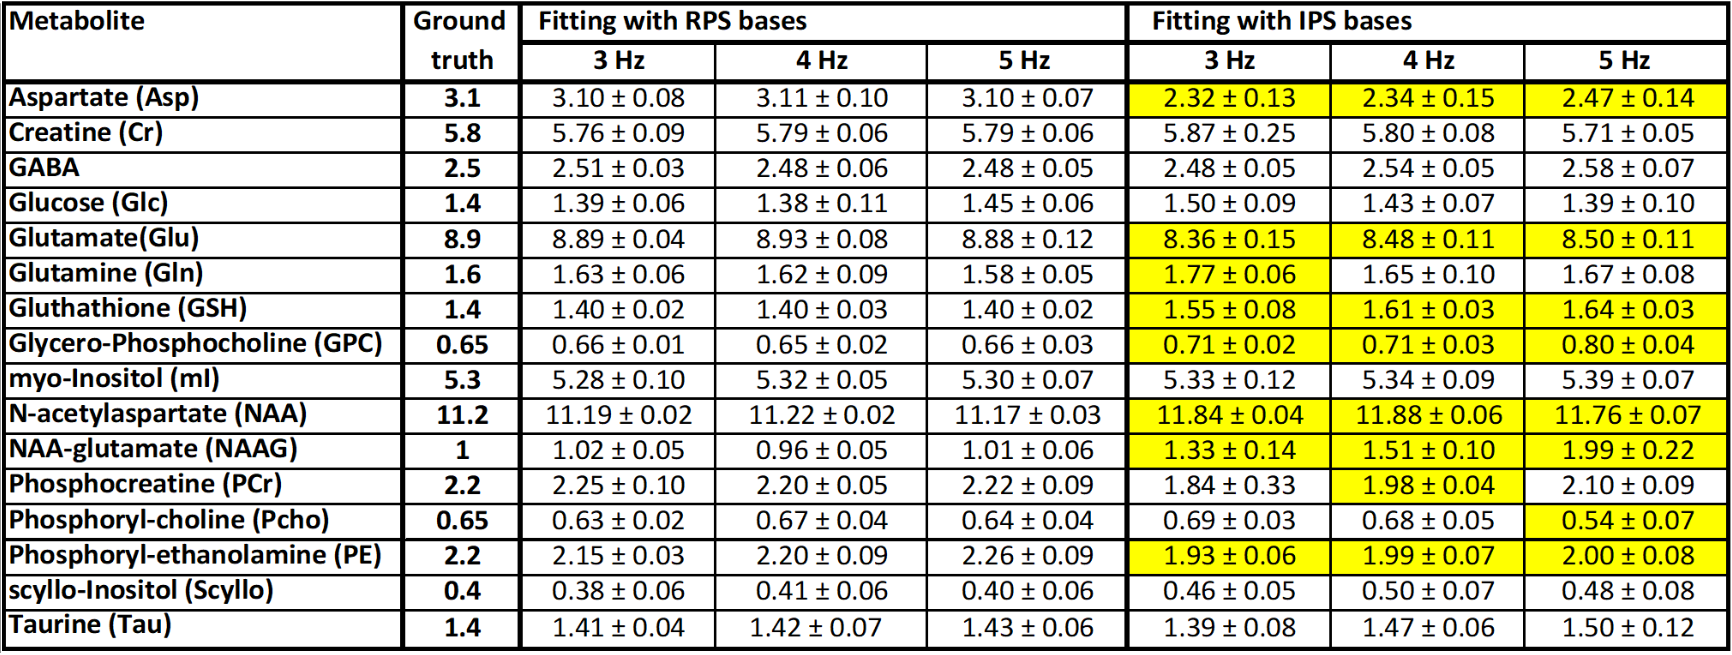
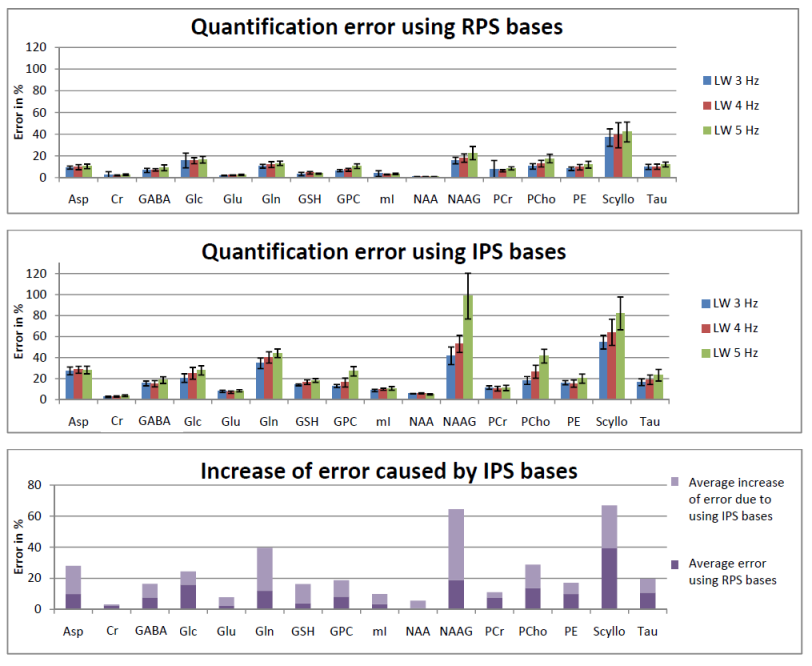
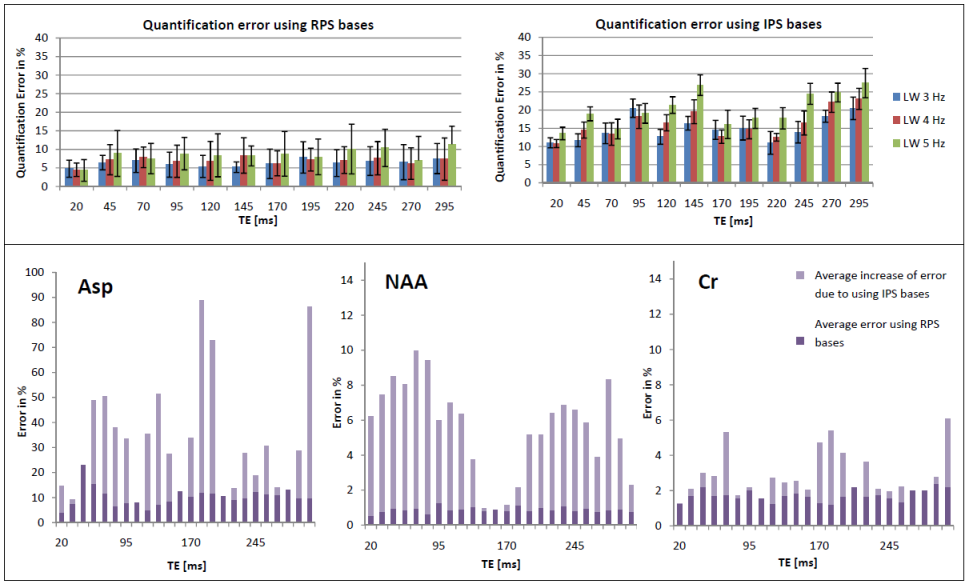
However, quantitative results (Fig 3 and Fig 4) show that use of IPS bases led to a higher bias for multiple metabolites if considering the median over all TEs. On average, the errors increased from 9-11%, to 19-29% for the three shim cases, when IPS was used rather than RPS. For the shortest TE of 20 ms the bias was smaller but still appreciably increased from 4-5% to 10-14%. Fig 5 visualizes that the bias strongly depends on TE for many metabolites when ideal pulse simulations are used, which follows from the fact that deviations in spectral patterns will depend on the amount of J-evolution ‑ which in turn depends on echo time ‑ and its inequality over the selected ROI.
Conclusion
This study shows that simulation of basis sets to be used in fitting clinical PRESS spectra should include the effects of the real pulse shapes and hence limited bandwidths even for the cases of short TE and fairly large B1 amplitude. Methods to speed up quantum-mechanical simulations of spectra[9] should therefore be incorporated in the commonly used simulation tools.Acknowledgements
Supported by the Swiss National Science Foundation (#320030_156952, #320030_175984)References
1. Cudalbu et al., NMR Biomed (2008) 21:627-636
2. Wilson et al., NMR Biomed (2010) 23:1117-1126
3. Starcuk & Starcukova, Anal Biochem (2017) 529:79-97
4. Smith et al., J Magn Reson (1994) 106:75-105
5. https://scion.duhs.duke.edu/vespa/gamma/
6. Maudsley et al., J Magn Reson (2005) 173:54-63
7. Kaiser et al., NMR Biomed. (2008) 21:22-32
8. Lange et al., AJNR (2006) 27 (4):895-901
9. Zhang et al., Med. Phys. (2017) 44:4169-4178
10. Mekle et al., Magn Reson Med (2009) 61:1279-1285
11. Chong et al., Magn Reson Mater Phy (2011) 24:147-164
Figures